Abstract
Background: The value of magnetocardiography (MCG) for the detection of cardiac electrical disturbances associated with myocardial ischemia was studied.
Methods: Sensitivity and predictivity of admission MCG for the presence of coronary artery disease (CAD) were prospectively evaluated in 264 consecutive patients presenting with acute chest pain and without ST‐segment elevation. MCG findings were compared with 12‐lead ECG, echocardiography (ECHO), and troponin‐I in a head‐to‐head design. Coronary angiography was used for CAD diagnosis.
Results: The visual assessment of magnetocardiograms by the experienced reader (R1) was superior to that by the unexperienced reader (R2) and superior to the automated computer analysis. Specificity and positive predictive value of MCG by R1 were comparable with those of ECG and troponin‐I (>90%), while ECHO specificity and ECHO positive predictive value were lower (76.2% and 87.9%, respectively). Sensitivity and negative predictive value of MCG were twice as high as those in the ECG, troponin‐I, and ECHO tests.
Conclusion: For the prediction of CAD in patients presenting with acute chest pain and without ST‐segment elevation, an admission MCG test was superior to an admission ECG, ECHO, and troponin‐I. The results of the study, however, are applicable only to a highly selected population comprising patients in whom immediate coronary angiography can be performed based on their clinical course in the hospital.
Keywords: chest pain, acute coronary syndrome, coronary artery disease, magnetocardiography, sensitivity, specificity, predictive value
In the United States, nearly 5 million patients present to the hospital every year because of a suspected acute coronary syndrome (ACS). Of these, 300,000 die an early cardiac death and 900,000 suffer an acute myocardial infarction, while at the other end of the clinical spectrum, more than 2 million others are diagnosed with noncardiac related chest pain. 1 In the end, approximately 30–40% of the patients presenting to US hospitals with chest pain actually exhibit an ACS. 1 , 2 The emergency physician, therefore, has the difficult task of delivering as quickly and correctly as possible the necessary diagnosis and appropriate therapy to the patient with ACS and of avoiding, under any circumstance, releasing patients with ACS prematurely. Atypical manifestations of ACS are not rare, especially in younger (25–40 years) and older patients (>75 years), in diabetics and in women. 3 On the other hand, increasing pressures are being brought to bear on emergency physicians to avoid unnecessary hospital admissions in order to reduce costs. Additionally, emergency physicians want to stratify the undifferentiated chest pain patient accurately in order to spare patients without ACS unnecessary diagnostic tests, especially invasive ones.
According to the European Society of Cardiology guidelines, patients with ACS can be classified clinically into two groups as follows. 3
-
Group 1:
Patients with suspicion of ACS with prolonged discomfort in the retrosternal area with persistent ST‐segment elevation or a newly occurring left bundle branch block.
-
Group 2:
Patients with pains in the retrosternal area and ECG changes indicative of acute ischemic heart disease, without persistent ST‐segment elevation, but rather with temporary ST‐segment elevation or flat or inverted T waves. Additionally, and most problematic for the emergency physician, the ECG may appear nonspecific or exhibit no ECG changes at all. The strategy in these cases is to alleviate ischemia and symptoms, to observe the patient with serial electrocardiograms and repeat measurements of markers of myocardial necrosis (troponin preferred or CK‐MB) and to initiate appropriate therapy if the diagnosis is confirmed. The admission ECG and cardiac markers such as troponins are often negative in these patients, therefore, further controls and tests are required. 3
Consequently, there is still a great clinical demand for a simple, noninvasive, early diagnostic test in “Group 2” patients, which provides quickly a valid and reproducible result. We, therefore, tested prospectively the value of the admission magnetocardiography (MCG) in comparison with the ECG, ECHO, and troponin‐I upon admission to the intensive care unit.
METHODS
In this registry, 264 consecutive patients meeting the criteria of “Group 2” were included. Patients with acute myocardial infarction, who were unambiguously diagnosed with a 12‐lead surface ECG, hemodynamically unstable patients, and patients who refused entry into the registry were excluded. Patients with left or right bundle branch block were explicitly not excluded.
MCG is a noncontact, noninvasive, and radiation‐free method that enables a complete investigation of a given patient's cardiac magnetic field within 10 minutes. The magnetocardiographic examination was carried out with the system “CMI 2409” (CardioMag Imaging Inc., Schenectady, New York, USA) which was made available for the study by CardioMag Imaging Inc. (Schenectady, New York, USA). It measures local magnetic field components, directly above and close to the torso of the patient. Ion currents of the heart muscle generate these local magnetic fields. Their origin is the same as that of electric potential differences on the patient's body surface, which are measured by conventional electrocardiography. Details of the magnetocardiograph used in this study were published elsewhere. 4
The intent of this investigation is to test whether the admission MCG permits the accurate prediction of coronary artery disease (CAD) in patients who, without persisting ST‐segment elevation in the ECG, are admitted to the intensive care unit with acute chest pain. All patients included in this study were referred by personal physicians and emergency doctors in private outpatient clinics and emergency departments.
DESIGN OF THE REGISTRY STUDY
The single‐center registry study was conducted as a prospective, intra‐individual, comparative examination of different diagnostic procedures after admission to the intensive care unit of Medical Clinic I in Hoyerswerda Hospital. These patients underwent standard clinical evaluation by their clinical team, which included in the first 36 hours following admission, several biochemical examinations (CPK, CPK‐MB, troponin‐I, myoglobin, CRP, and creatinine), resting ECG, echocardiography (ECHO), and coronary angiography. To prove the value of MCG as a noninvasive, early diagnostic test, a head‐to‐head comparison of the admission MCG, ECG, troponin‐I, and ECHO tests was made. The ECG was recorded directly before the MCG, while the patient lay on the MCG table which is located in the intensive care unit. Since coronary angiograms served as the diagnostic “gold” standard, 5 the study included only patients for whom coronary angiography was prescribed by the responsible cardiologist within 36 hours after admission of the patient to the intensive care unit. In general, these were patients who suffered from recurrent angina pectoris despite medical treatment and/or patients who developed clear pathologic changes in subsequent ECG, troponin‐I, or ECHO.
Angiograms were defined as positive if at least one coronary artery branch of first or secondary order revealed a 50% or greater degree of stenosis. 5 Stenosis or occlusion of vessels was not counted as positive if the bypass graft to this vessel was intact.
An ECG was defined as positive if:
-
1
ST‐segment depression was greater than 1 mm (0.1 mV) in two or more contiguous leads, or
-
2
inverted T waves (>1 mm) in leads with predominant R‐waves occurred. 3
Two independent readers evaluated visually the magnetocardiogram without prior knowledge of the results of the laboratory results, the 12‐lead ECG, the echocardiographic, or the coronary angiographic examinations. The results of the MCG test, as well as of the biochemical data, the ECG, the echocardiographic examinations as well as the coronary angiography were then sent to the Institute for Heart and Circulation Research, Hoyerswerda (F.J.) where they were entered into a database for independent statistical analysis.
The study complies with the Declaration of Helsinki. The locally appointed ethics committee of the “Landesärztekammer Sachsen” approved the study, and informed consent was obtained from the patients.
DATA ANALYSIS AND DIAGNOSIS OF MYOCARDIAL ISCHEMIA
The MCG data were analyzed in a two‐step fashion. First, they were displayed in scalar form with QRS complexes, ST segments, and T waves. This allows one to choose specific areas which were represented in the form of magnetic field maps. With these maps, a series of parameters were calculated. According to Tsukada et al., 6 the criteria for ischemia were exclusively analyzed during the time interval between the beginning of the T wave (Tbeg) and the maximum of the T wave (Tmax). Four parameters were defined, from which at least one parameter had to be abnormal for the diagnosis of ischemia to be established. For the characterization of CAD, we chose the following parameters in the time interval described above: direction of the vector (from plus pole to minus pole), change in the angle of this vector, change in the distance between plus and minus poles, and change in the ratio of the pole strengths. Rapid changes in these parameters in a time interval of 30 ms in the MCG interval between Tbeg and Tmax were the characteristic of CAD. Therefore, we defined the following values as parameters for ischemia:
-
P1:
he direction of the main vector lies between −20° and +110° (cross‐hatched region in Fig. 1). In the case of left bundle branch block, this vector always lies between −20° and +110°, so that this parameter could not be used for the determination of ischemia. When the direction of the current vector lies between +110° and −20° (non‐cross‐hatched region in Fig. 1),
-
P2:
a change in the angle of the main vector of more than 45° inside a time interval of 30 ms between Tbeg and Tmax, or
-
P4:
a change in the distance separating the plus and minus poles of more than 20 mm inside a time interval of 30 ms between Tbeg and Tmax, or
-
P4:
P4: a change in the ratio of the plus and minus pole field strengths of more than 0.3 inside a time interval of 30 ms between Tbeg and Tmax.
Figure 1.
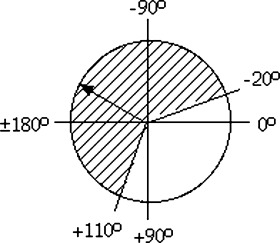
Plot of the position of the current vector.
These three subcriteria are shown in Figure 2 in which the record of an apparently healthy subject (Fig. 2, top) is compared to a patient with CAD (Fig. 2, bottom). In this example, the patient meets all three sub‐criteria: the current vector makes rapid changes (more than 45° within 30 ms), the dipole distance changes by more than 20 mm within 30 ms, and the ratio of the field strength of the plus and minus magnetic poles changes by more than 0.3 within 30 ms. The apparently healthy subject, on the other hand, displays a very stable vector behavior, with only a slow, slight change in the magnetic field vector.
Figure 2.
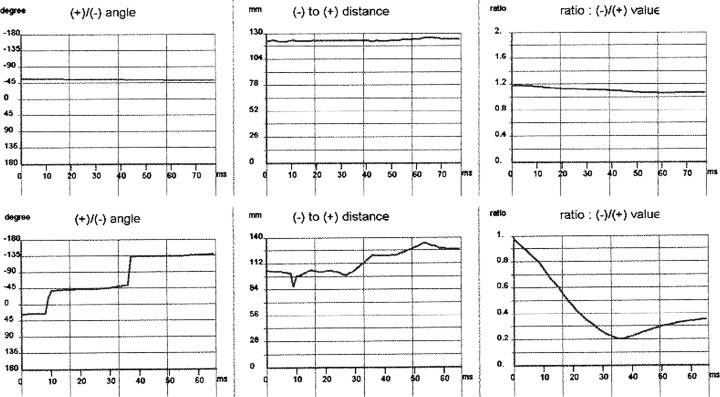
Dynamics of the relative pole behavior with respect to angle, distance, and strength during the time interval between Tbeg and Tmax. (a) Apparently healthy subject (top); (b) patient with coronary artery disease (bottom).
In Figure 3, the behavior of the three‐dimensional dipole vector arrows during the time interval between Tbeg and Tmax, is shown. In contrast to the stable arrow position and direction in an apparently healthy subject (Fig. 3a), in patients with CAD, the arrows rapidly change their positions and directions (Fig. 3b and c).
Figure 3.
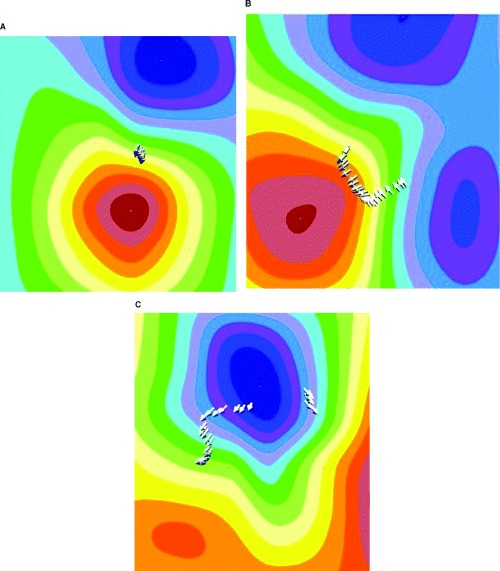
Behavior of the three‐dimensional magnetic‐dipole vector (arrows) during the time interval between Tbeg and Tmax. (a) Apparently healthy subject; (b) patient with coronary artery disease; (c) patient with coronary artery disease.
STATISTICS
Data are reported as mean value ± standard deviation for continuous variables, or as percentages for categorical variables.
Because the evaluation was blinded, and, as a rule, there were no findings available prior to the reception of an emergency department patient, it was not known whether the patient's angina pectoris was actually the result of ischemia. The reader, therefore, had no pretest probability at his/her disposal. In this case, the calculation of sensitivity and specificity of the four diagnostic tests was made according to the following contingency table: 7
| Disease Present | Disease Not Present | ||
|---|---|---|---|
| Test positive | a | b | a + b |
| Test negative | c | d | c + d |
| a + c | b + d |
a: number of patients with disease having a positive test result (true positive).
b: number of patients without disease having a positive test result (false positive).
c: number of patients with disease having a negative test result (false negative).
d: number of patients without disease having a negative test result (true negative).
The sensitivity was calculated as the number of true positive results (a) divided by the number of patients having the disease (a + c): Sens = a/(a + c). The specificity was calculated as the number of true negative results (d) divided by the number of patients without the disease (b + d): Spec = d/(b + d).
With the help of Bayes formula, the probability was calculated whether with a positive diagnostic test result, the disease to be diagnosed was actually present (positive predictive value: PPV = a/(a + b)). Likewise, one can also calculate the probability whether, with a negative test result, the disease is not present, i.e., the negative predictive value: NPV = d/(d + c).
The interobserver (R1 − R2) and methodical variability (R1 − AUT; R2 − AUT) were determined using the contingency coefficient (CC) according to Pearson. CC describes the magnitude of the correlation between categorical data. The raw data of all magnetocardiograms were evaluated in Hoyerswerda (R1: J.‐W.P.) as well as at Johns Hopkins University (R2: P.M.H.) by visual analysis (according to the Hoyerswerda Criteria). In addition, an automated analysis (AUT) by the software of CMI Inc. (software version: MCG 42_24_17b) was carried out.
RESULTS
Two hundred and sixty‐four consecutive patients meeting the inclusion and exclusion criteria were examined and accepted into the registry. Eight patients had to be excluded from the analysis due to intrinsic signal interference: one patient had an implanted defibrillator, two had metal clips after two bypass operations, three patients had a pacemaker, and two patients had excessive metal after permanent teeth replacement. Another 8 patients, in whom subsequently no angiography was performed, were excluded (these patients became symptom‐free after medical therapy, and since serial troponin, ECG, and ECHO remained normal, there was no clinical indication for urgent coronary angiography). In 63 patients, the signal to noise ratio of the raw data was not sufficient to permit a reasonable analysis (see Fig. 4). Consequently the data sets of 185 patients were evaluated. Table 1 summarizes demographic and clinical data.
Figure 4.
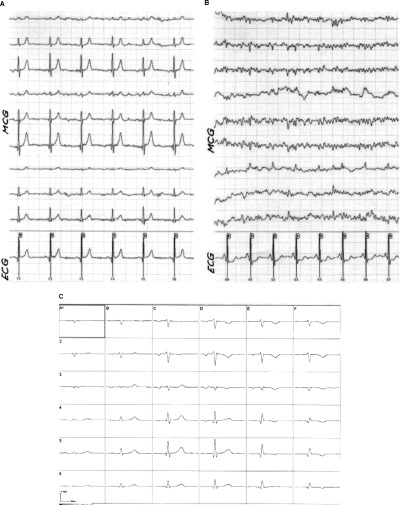
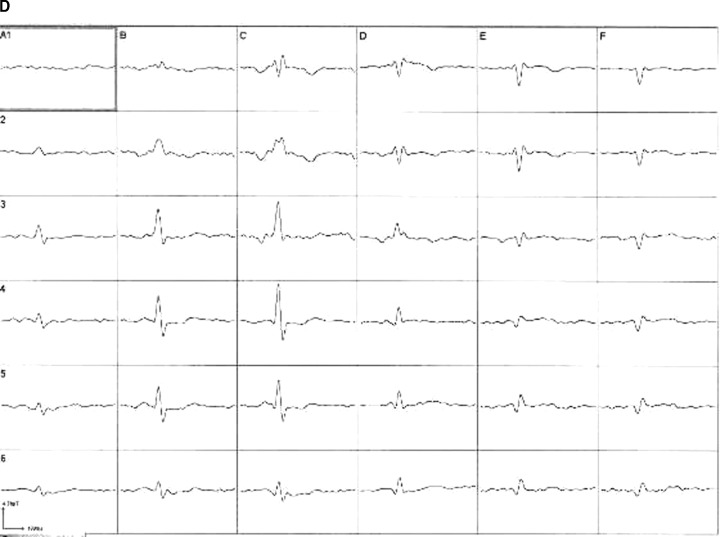
MCG raw data with excellent (left, a) and poor (right, b) signal to noise ratio (MCG: leads 1–9, ECG: lead 10; top). Averaged magnetocardiographic signals from 36 positions after postprocessing (bottom; (c) postprocessed averaged magnetocardiogram of example (a); (d) postprocessed, averaged magnetocardiogram of example (b)).
Table 1.
Demographic and Clinical Data
| Total (n = 185) | CAD (n = 143) | No CAD (n = 42) | |
|---|---|---|---|
| Age (years) | 67.0 ± 10.7 | 68.6 ± 10.2 | 61.3 ± 10.2 |
| Gender | |||
| Female/Male | 72/113 | 50/93 | 22/20 |
| Blood pressure (mmHg) | |||
| Systolic | 140 ± 21 | 141 ± 22 | 135 ± 19 |
| Diastolic | 78 ± 13 | 78 ± 13 | 80 ± 12 |
| Heart rate (bpm) | 79 ± 19 | 81 ± 21 | 73 ± 13 |
One hundred and forty‐three out of 185 patients exhibited CAD by angiography, whereas 42 had a normal coronary arteriogram. Of the 143 patients with CAD, 35 revealed single‐vessel disease, 37 two‐vessel disease, and 71 three‐vessel disease. Total occlusion of at least one coronary artery was found in 56 patients. Ten patients had a history of CABG‐surgery, 32 underwent prior percutaneous coronary intervention (PCI), and 18 had previous myocardial infarction.
Fifty‐nine patients suffered from diabetes mellitus (IDDM: 5, NIDDM: 54), 130 from arterial hypertension, and 68 from hyperlipidemia. Twenty‐nine of the patients were current smokers, 75 ex‐smokers. One hundred and thirty‐one of the patients were obese (BMI greater than 25 10 ).
Seventy‐three out of the 143 patients with CAD underwent immediate coronary intervention (68 patients received at least one stent; in 5 patients only PTCA was performed). In 49 patients, a GPIIb/IIIa‐blocker was administered. Due to progressive pump failure in 3 patients, an intra‐aortic balloon pump was inserted. Twenty‐nine patients were referred for urgent CABG‐surgery.
Revascularization was postponed in the remaining 41 patients. The majority was referred for provocative cardiac stress testing which then guided further management or intervention.
The specificity, sensitivity, as well as the negative and positive predictive values of the four diagnostic methods are shown in Table 2.
Table 2.
Specificity (Spec), Sensitivity (Sens) as well as Negative (NPV) and Positive Predictive Value (PPV) of the Four Diagnostic Methods for the Prediction of Coronary Artery Disease in Patients With Acute Chest Pain Without Pretest Probability
| MCG | ECG n = 160b | Trop I n = 185 | Echo n = 184c | |||
|---|---|---|---|---|---|---|
| R1 (n = 185) | R2 (n = 183a) | AUT (n = 185) | ||||
| Spec | 92.8% | 76.2% | 82.5% | 91.1% | 90.5% | 76.2% |
| Sens | 95.1% | 88.7% | 86.4% | 33.9% | 42.7% | 51.0% |
| NPV | 84.8% | 66.7% | 63.5% | 27.4% | 31.7% | 31.4% |
| PPV | 97.8% | 92.6% | 94.5% | 93.3% | 93.8% | 87.9% |
aThe raw data of two patients could not be used because of a disk error; bThirteen patients had left bundle branch block (LBBB), and 12 right bundle branch block (RBBB), so that the ECG could not be evaluated; cIn 1 patient, ECHO was missing.
R1 = reader 1; R2 = reader 2; AUT = automated analysis.
The visual assessment by the experienced reader (R1) was superior to the visual assessment by the unexperienced reader (R2) and also superior to the automatic computer analysis (AUT) concerning all four parameters (specificity, sensitivity, negative and positive predictive values). The specificity and positive predictive value of MCG (R1) were comparable with those of ECG and troponin‐I (all three greater than 90%). The ECHO specificity was 76.2%, its positive predictive value was 87.9%; the sensitivity and negative predictive values were twice as high as the ECG, troponin‐I, or ECHO (Table 2).
In terms of the interobserver variability, reader R1 met a true positive (in 134 patients) and a true negative (in 39 patients) result in 94.5% of all patients, R2 in 85.8% (true positive: 125 patients; true negative: 32 patients), and AUT in 85.2% (true positive: 121 patients; true negative: 35 patients), respectively. The interobserver variability was estimated using the contingency coefficient (CCinterobserver). CCinterobserver comparing R1 and R2 visual analysis was 0.76 (the maximum CC value of four‐step distinctive feature is 0.886). The CC values of AUT versus visual analyses were 0.79 and 0.78, for R1 and R2 analysis, respectively.
DISCUSSION
This prospective study with 264 patients demonstrates that in a subset of 185 patients with sufficient signal to noise ratio (74.6% of all patients tested with MCG), MCG is a very promising, non‐invasive, non‐contact, and radiation‐free method for the prediction of CAD in high‐risk patients with acute chest pain.
In this study, the probability of an experienced MCG reader correctly identifying patients presenting with CAD was 97.8%, while the probability of that same reader correctly identifying patients without CAD was 84.8%. Even by an inexperienced reader, the MCG allows the identification of CAD with a probability of 92.6% and correctly excluded CAD with a probability of 66.7%. The distinct value of the admission MCG is that it is twofold higher in terms of negative predictive value when compared with well‐established methods like the ECG, troponin‐I, and ECHO at admission. The limitations of ECG, troponin‐I, and ECHO in the group of patients with non‐ST‐elevation acute coronary syndrome (NSTE‐ACS) are well known. 9 , 10 , 11 Because ECG, troponin‐I, and ECHO are frequently normal in many patients with ACS upon admission and become positive only when tested again many hours later (according to the guidelines of the German Society of Cardiology control examinations are recommended 6–12 hours later 12 ), the false negative findings of the admission ECG, troponin‐I, and ECHO values, as demonstrated in this study, result in poor negative predictive values of 27.4, 31.7, and 31.4%, respectively. These data are consistent with prior published reports. 1 , 2 , 5 , 7 Our data, therefore, indicate the marked advantage of MCG over ECG, troponin‐I, and ECHO in this clinical setting at admission.
One has to keep in mind when analyzing this patient population that there are no patients included with ST‐segment elevation indicative of myocardial infarction, since these will go immediately to the cardiac catheterization laboratory for rapid revascularization or referral for CABG. It is understood that these patients do not require additional diagnostic testing and therefore the use of M0G in this patient population would be redundant. In addition, one has to remember that the evaluation is blinded and proceeds without any pretest probability.
The values resulting from the analysis by R1 were markedly higher than those by R2 and AUT, while the values analyzed by R2 and AUT were similar. Simultaneously, contingency coefficients of all three analyses—R1, R2, AUT—were similar. This demonstrates that the ischemia criteria programmed in the software version “CMI 42_24_17b” mirror quite well the visual assessment of an inexperienced reader. However, the visual assessment by an experienced reader, having evaluated more than 1000 magnetocardiograms, correctly predicted the coronary angiographic findings. Careful postanalysis reassessment showed that the main reason for false positive AUT results was the incorrect positioning of Tbeg. The majority of false negative AUT cases was due to incorrect identification of the early phase of the T wave. The computer program defines Tbeg as the time‐point when one‐third of the magnetic value of Tmax is reached. This definition was required to clearly differentiate between the true cardiac signal and noise. This means that the higher the magnetic field is at the time‐point Tmax, the more likely the Tbeg AUT is shifted right, and therefore, the AUT analysis may miss the ischemia‐sensitive phase of early repolarization. The experienced reader can make a visual assessment of the recorded traces and manually adjust the time‐point Tbeg to the appropriate position taking into account the MCG signal to noise ratio of the raw data.
A further reason for false negative magnetocardiographic results lies in the technical configuration of the magnetocardiographic system used in this study, e.g. that the positioning of the magnetic sensors is guided by the anatomical structure of the patient's chest wall. Due to anatomical variation of the heart's size and location, weak electrical disturbances produced by limited regional ischemia can be missed because the signals from such a myocardial site may not be “caught” by the magnetocardiographic sensors (see Fig. 4). The Hoyerswerda criteria used in this study are based on the rapid changes of dipole strength, pole distance, and dipole angle. In case the minus or plus pole is located outside the magnetocardiographic sensor measuring area, the analysis leads at times to an underestimation of the magnitude of the Hoyerswerda parameters resulting in false negative findings, leading ultimately to a lower negative predictive value.
Since 25 of 185 patients had a bundle branch block (13 with LBBB, 12 with RBBB), a condition, in which ECG is normally nondiagnostic 13 , 14 and as ECHO yielded false positive results in a significant number of patients, these tests were not helpful for a correct diagnosis. In contrast, MCG predicted CAD in 24 of these patients correctly (by the experienced reader). It seems possible, therefore, to judge whether myocardial ischemia exists with bundle branch block using the magnetocardiogram in the time interval from Tbeg to Tmax, because in this sensitive repolarization phase there appear very obvious inhomogeneities in the magnetic field. These lead to distinct changes in the dipole behavior which can be distinguished from the dipole behavior of bundle branch block patients without ischemia. 15
Since the extent of myocardial ischemia can vary significantly during an episode of ACS, the ECG‐, MCG‐, and the troponin‐I tests were performed in close time frame while the patient lay on the MCG table (it means directly after admission). The sensitivity of the admission troponin‐I of 42.7% evaluated in this study is poor, since it is well acknowledged that a single test for troponins on arrival of the patient in the hospital is not sufficient, as in 10–15% of patients troponin deviations can be detected in subsequent hours. 3 Despite poor negative predictive value of ECHO in this study, the assessment of left ventricular systolic function or other underlying conditions such as aortic stenosis by ECHO, is an important prognostic variable in these patients. So, for example, in one female patient in our study, in whom MCG, ECG as well as troponin‐I were “false positive,” ECHO revealed a relevant aortic stenosis with a mean systolic pressure gradient of >100 mmHg. ECHO explained that in this patient, myocardial ischemia was caused by aortic stenosis and not by CAD.
In this study, coronary angiography within 36 hours was used as the diagnostic “gold standard,” because underlying CAD is the major cause of plaque rupture leading to ACS with the consequence of myocardial ischemia. The correct confirmation or ruling out of this is a main medical care issue in patients presenting with acute chest pain. Coronary angiography provides unique information on the presence and severity of CAD and is absolutely essential if revascularization measures by PCI or CABG are discussed. Furthermore, in acute chest pain patients, the highest risk is associated with the occurrence of filling defects indicating intra‐coronary thrombus. 3 Mizuno et al. found intra‐coronary thrombi in 80% of patients with ACS using angioscopic and intravascular ultrasound methods. 16 Of course, it is possible that the diagnosis of CAD on angiography in our study is due to patients' prior event, and the positive MCG in this case may be false‐positive in CABG patients. We therefore did not count stenoses or occlusions of vessels as positive if the bypass grafts to the corresponding vessels were intact (or if a stented vessel showed no re‐stenosis). Furthermore, all patients, in whom the responsible cardiologist did not perform the coronary angiography within 36 hours because the patient became symptom‐free under medical treatment including heparin, aspirin, betablocker, nitrate, and calcium channel blocker, and the repeated ECG and troponin‐I remained normal, were not included into the registry. Choosing 50% stenosis in coronary angiography as a “gold” standard threshold for the diagnosis is somewhat arbitrary and is the result of a controversially discussed topic in invasive cardiology. Stress‐induced myocardial ischemia occurs more in patients with high grade stenosis than in low grade stenosis. On the other hand, in ACS patients, one finds in 15–20% no high‐grade stenoses. 17
LIMITATIONS OF THE STUDY
This analysis of 264 patients should be viewed as preliminary. One cannot exclude the possibility that the results could change when a larger number of cases are studied. In addition, these data were derived from a population of high‐risk patients in whom the prevalence of CAD was extremely high. It is also possible that our cohort is not the typical of the average emergency department patient population in which the vast majority of patients presenting with chest pain or its equivalent do not possess obstructive CAD.
Ferromagnetic materials in the thorax or electronic devices like implanted defibrillators, pacemakers, wire clips, and sternal metal sutures from aortocoronary bypass operations can lead to large disturbances of the magnetic field. In these patients, a magnetocardiographic examination is not possible. On the other hand, in general endovascular coronary stents did not pose a problem.
With the unshielded MCG system used in this study, the experienced reader had to exclude 63 out of 264 (23.9%) data sets from final evaluation because of the poor signal to noise ratio (see Fig. 5). The AUT analysis was performed in all 264 patients because the currently available software unfortunately does not assess the quality of the signal to noise ratio of the raw data before starting the automated analysis. Thirty‐six out of these 63 patients had no CAD in the angiogram. Interestingly, the AUT analysis revealed a false positive result in 35 out of these 36 patients due to noise‐related fast changes of the magnetic dipoles. Therefore, the AUT analysis without visual “overreading” of the raw data should be avoided. However, further modification of filters and post‐processing algorithms may allow for improved extraction of biological signal, enhancing the clinical applicability of this technology.
Figure 5.
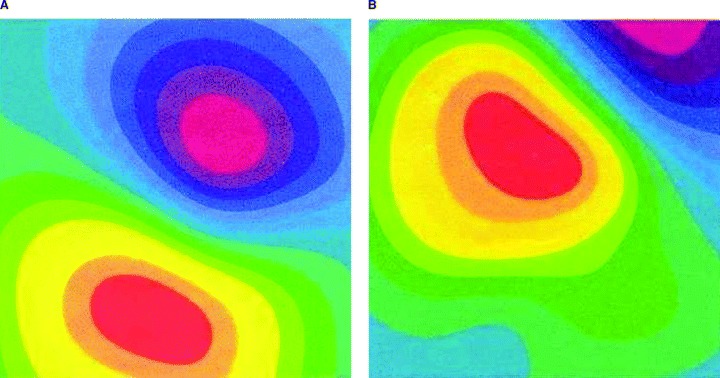
Example for possible problem arising if sensor positioning is guided by chest wall anatomy. The cardiac magnetic field is correctly covered by magnetocardiographic sensors (left, a). The cardiac magnetic field is partially outside the magnetocardiographic area (right, b).
CONCLUSION AND PERSPECTIVES
With the help of admission MCG, it was possible to predict, in a subset of 185 patients (25.4% had to be excluded due to poor signal to noise ratio) with 97.8% probability, the presence of CAD in patients with acute chest pain. Likewise, with 84.8% probability, it was possible to exclude CAD. Admission MCG also appears to be suited for the prediction of CAD in patients with bundle branch block.
The high predictive values of the admission MCG could make it possible to more accurately and in a very early stage select patients who should proceed quickly to invasive coronary angiography. Therefore, in the future we will test whether patients with acute chest and a nondiagnostic ECG, if admission MCG is normal, can be transferred early from the intensive care unit to intermediate care beds for further noninvasive testing.
The results of the study, however, are applicable only to a highly selected population comprising patients in whom immediate coronary angiography can be performed based on their clinical course in the hospital.
Acknowledgments
Acknowledgments: The authors thank CardioMag Imaging Inc. for their support. CMI had no involvement in the collection, analysis, and interpretation of data; in the writing of the report; and in the decision to submit the article for publication.
REFERENCES
- 1. Gibler BE. Diagnosis of acute coronary syndromes in the emergency department In: Topol E. (ed.): Acute Coronary Syndromes. New York , Marcel Dekker, 2000, pp. 193–231. [Google Scholar]
- 2. Gibler BE, Lewis LM, Erb RE, et al Early detection of acute myocardial infarction in patients presenting with chest pain and nondiagnostic ECGs: Serial CK‐MB sampling in emergency department. Ann Emerg Med 1990;9: 1359–1366. [DOI] [PubMed] [Google Scholar]
- 3. Bertrand ME, Simoons ML, Fox KAA, et al Management of acute coronary syndromes: Acute coronary syndromes without persistent ST‐segment elevation. Eur Heart J 2000;21: 1–32. [DOI] [PubMed] [Google Scholar]
- 4. Sternickel K, Tralshawala N, Bakharev A, et al Unshielded measurements of cardiac electric activity using magneto‐cardiography. Int J Bioelectromagnetism 2002;4: 189–195. [Google Scholar]
- 5. Scanlon PJ, Faxon DP, Audet AM, et al ACC/AHA guidelines for coronary angiography. J Am Coll Cardiol 1999;33: 1756–1824. [DOI] [PubMed] [Google Scholar]
- 6. Tsukada K, Miyashita T, Kandori A, et al An iso‐integral mapping technique using magnetocardiogram and its possible use for diagnosis of ischemic heart disease. Int J Card Imaging 2000;16: 55–66. [DOI] [PubMed] [Google Scholar]
- 7. Griner H. Selection and interpretation of diagnostic tests and procedures. Ann Int Med 1981;94: 553–600. [PubMed] [Google Scholar]
- 8. Physical status: The use and interpretation of anthropometry. Report of a WHO expert committee. WHO Tech Rep Ser 1995;854: 1–452. [PubMed] [Google Scholar]
- 9. Dellborg M, Andersen K. Key factors in the identification of the high‐risk patients with unstable coronary artery disease: Clinical findings, resting 12‐lead electrocardiogram, and continuous electrocardiographic monitoring. Am J Cardiol 1997;80: 35–39. [DOI] [PubMed] [Google Scholar]
- 10. Larsson H, Areskog M, Areskog NH, et al The diagnostic and prognostic importance of ambulatory ST recording compared to a predischarge exercise test after an episode of unstable angina or non‐Q wave myocardial infarction. Eur Heart J 1995;16: 888–893. [DOI] [PubMed] [Google Scholar]
- 11. Lindahl B, Andren B, Ohlsson J, et al Risk stratification in unstable coronary artery disease. Additive value of troponin T determinations and pre‐discharge exercise test. FRISC Study Group. Eur Heart J 1997;18: 762–770. [DOI] [PubMed] [Google Scholar]
- 12. Hamm CW. Leitlinien: Akutes Koronarsyndrom (ACS). Z Kardiol 2004;93: 72–90. [DOI] [PubMed] [Google Scholar]
- 13. ESC/ACCC . Myocardial infarction redefined—A consensus document of the Joint European Society of Cardiology/American College of Cardiology. Committee for the redefinition of myocardial infarction. J Am Coll Cardiol 2000;36: 959–969. [DOI] [PubMed] [Google Scholar]
- 14. Zimetbaum PJ, Josephson ME. Use of electrocardiogram in acute myocardial infarction. N Engl J Med 2003;348: 933–940. [DOI] [PubMed] [Google Scholar]
- 15. Park J‐W, Reichert U, Gerk U, et al Early diagnosis of ischemic heart disease in a left bundle branch block patient with acute chest pain using magnetocardiography In: Kimchi A. (ed.): Heart Disease. Pathogenesis, Diagnosis and Treatment. Bologna , Medimond, 2003, pp. 131–135. [Google Scholar]
- 16. Mizuno K, Satomura K, Miyamoto A, et al Angioscopic evaluation of coronary artery thrombi in acute coronary syndromes. N Engl J Med 1992;326: 287–291. [DOI] [PubMed] [Google Scholar]
- 17. Diver DJ, Bier JD, Ferreira PE, et al Clinical and arteriographic characterization of patients with unstable angina without critical coronary arterial narrowing (from the TIMI‐IIIA trial). Am J Cardiol 1994;74: 531–637. [DOI] [PubMed] [Google Scholar]


