

Abstract
Background: Time‐domain microvolt T‐wave alternans (TWA) has been described as a noninvasive marker of sudden cardiac death in adults. The incidence of TWA in pediatric populations has not been defined well. The aim of the study was to determine peculiarities of TWA in children.
Methods: We examined 68 healthy patients—newborns (20) and children in age group of 7–17 years (48)—and 85 pediatric patients: ventricular premature beats—65; dilated cardiomyopathy (DCMP)—2; long QT syndrome (LQTS)—10; Brugada syndrome (BrS)—5, catecholaminergic ventricular tachycardia (CVT)—3. All underwent Holter monitoring (HM) with definition of the peak value of TWA by modified moving average method.
Results: In healthy newborns, TWA was 32 ± 8 (12–55) μV (HR 123–156 bmp). In healthy children (7–17 years) it was 30 ± 11 (10–l 55) μV, (HR 64–132 bmp) without any differences between boys and girls. In all group of patients, TWA were significantly higher (P < 0.05) than in healthy. Circadian peak of TWA was found (90%) in a second part of day and at sleep (8%). Among them 60% (LQTS, BrS, and DCPM) had TWA > 55 μV.
Conclusion: Time‐domain TWA during HM in children was independent of age, gender, and heart rate. In 94% healthy children, values of TWA do not exceed 55 μV but 20–50% children with cardiac pathology had TWA more than 55 μV. Night circadian type of TWA in diseases with risk of life‐threatening arrhythmias associated with TWA was more than 55 μV.
Ann Noninvasive Electrocardiol 2010;15(2):138–144
Keywords: microvolt T‐wave alternans, Holter monitoring, healthy children, Brugada syndrome, long QT syndrome, catecholaminergic ventricular tachycardia
T‐wave alternation is the change of amplitude, morphology, and polarity of the T wave in several subsequent electrocardiographic complexes. Visible or so‐called macroscopic T‐wave alternation for the first time has been described about 100 years ago by Hering 1 and Lewis. 2 Later, it was reported as visible T‐wave alternation in adult patients with various cardiac diseases—myocardial ischemia, 3 vasospastic angina, 4 electrolyte abnormalities, 5 dilated cardiomyopathies, 6 life‐threatening arrhythmias, 7 , 8 and long QT syndrome. 9 In a pediatric population, visible T‐wave alternation has been described in children with inherited long QT syndrome. 9 , 10 , 11
Visible T‐wave alternation assessment is very subjective approach with numerous limitations and a method of automated evaluation of microvolt T‐wave alternation during exercise testing or atrial pacing (Conventional Spectral based method or Cambridge Heart method) was developed later and the presence of it was associated with the high‐risk of ventricular tachycardia. 12 , 13 Unfortunately, routine clinical application of spectral method is limited. Since exercise testing or atrial pacing is difficult to perform in some group of patients (severe heart failure, early period after myocardial infarction, age limitation for stress test, or atrial pacing), special expensive electrodes to lower noise must be used. Recently, time‐domain method analyses of microvolt T‐wave alternation was proposed by Verrier et al. 14 who possibly used the commercially available modified moving average (MMA) method. The use of MMA for ambulatory microvolt T‐wave alternation testing is currently limited in pediatric population because of the absence of normal limits and established diagnostic criteria. The aim of our study was to determine normal limits of the microvolt T‐wave alternation detected by MMA method in healthy children and its peculiarities in patients (children) with cardiovascular diseases.
Patients
This study comprised 80 (42 boys and 38 girls) apparently healthy children in age group of 0–17 (8.2 ± 6.1), 20 (14 boys and 6 girls) healthy newborns at 1st, 2nd, and 4th day after birth, and 60 (28 boys and 32 girls) children and adolescents in age group of 7–17 (10 ± 4.1). The inclusion criteria for healthy newborns were: normal pregnancy and delivery, healthy mother aged 18–28; gestational age of a baby at birth 38–40 weeks; body mass at birth ≥ 2700 grams; Apgar scale ≥ 8, absence of cardiovascular pathology at physical examination, and rest 12‐lead ECG. The healthy children in 7–17 age group were selected for study from consecutive pediatric prophylactic medical examination based on the absence of cardiovascular pathology at routine clinical evaluations, including physical examination, blood pressure measurements, and 12‐lead ECG showing no cardiac disease.
Eighty‐five children, in 7–17 (11.8 ± 4.5) age group, were also examined for cardiovascular pathology—65 with ventricular premature beats (VPB) without structural or congenital heart diseases, two with dilated cardiomyopathy (DCMP), 10 with inherited long QT syndrome (LQTS), five with Brugada syndrome (BrS), and three with catecholaminergic polymorphic ventricular tachycardia (CPVT).
The study protocol was approved by the ethics committee of Clinical Children Hospital #38 of Federal Medical‐Biological Agency of Russia. Informed consent was given by parents of all healthy children.
Holter ECG Monitoring and Measurement of Microvolt T‐Wave Alternans
All participants underwent 24‐hour Holter ECG monitoring (HM) performed using digital recorders Seer MC, GE Medical systems (GE Healthcare Inc., Milwaukee, WI, USA) in three leads (V5, V1, and aVF). The sampling rate was 128 Hz. Analysis of the microvolt T‐wave alternans (TWA) was performed by time‐domain MMA using software Mars PC system, version 7.5 with definition of the peak value of TWA. TWA was analyzed in modified leads V5, V1, and AVF from routine 24‐hour HM. The maximal TWA voltage at a heart rate less than 160 bpm was derived automatically in three leads. After that, manual editing was performed if the data were not available for analyses due to noise or artifacts. The system displayed maximal time‐domain TWA magnitude on the screen and the highest values of TWA in the three leads was chosen for assessment.
Statistics
We completed data statistical analysis with nonparametric methods using Statistica for Windows (StatSoft, Tulsa, OK, USA), version 7. Normally distributed data were expressed as mean ± standard deviation (m ± SD) and 5–95‰. Student's t‐test and Wilcoxon matched‐pairs test were used for comparison where appropriate. Correlation was expressed as Pearson's correlation coefficient. A P value lower than 0.05 was considered significant.
RESULTS
Twelve healthy children in 7–17 age group were excluded from the analysis because in the figures of peak TWA odd and even beat templates do not line up in T‐P segment or P‐wave, or QRS complex, so we considered that as artifact. In healthy newborns, the values of TWA were 32 ± 8 μV, from 12 to 55 μV (5 and 95‰, accordingly), and they registered the heart rate between 123 bpm and 156 bpm. The values of TWA in healthy group of 7–17 years of age were revealed in heart rate between 64 bpm and 132 bpm (P < 0.05 from newborns) and were established as 30 ± 11 μV, from 10 to 55 μV (5–95 ‰). The highest maximal values of TWA were revealed in modified lead V5 in 58 (86%) children, lead V1 in 6 (9%), and lead aVF in 4 (5%) children.
There were no differences between boy and girl in the TWA values. The mean average TWA in all groups of children with cardiovascular diseases was significantly higher than in healthy children (Table 1).
Table 1.
The Value of Microvolt TWA in Healthy Children and Pediatric Patients with Cardiovascular Pathology
| Subjects | N | Age M ± SD | TWA (μV) M ± SD | 5–95‰ (μV) | >55 μV n (%) | P From Healthy |
|---|---|---|---|---|---|---|
| Healthy | 48 | 10 ± 4.1 | 30 ± 11 | 10–55 | 3 (6) | — |
| VPB | 65 | 12.1 ± 4.3 | 45 ± 23 | 15–98 | 14 (21) | P < 0.005 |
| DCMP | 2 | 12 | 68 ± 43 | 37–99 | 1 (50) | P < 0.0001 |
| LQTS | 10 | 11.6 ± 3.9 | 48 ± 20 | 19–80 | 4 (40) | P < 0.0001 |
| BrS | 5 | 11.5 ± 7 | 39 ± 28 | 10–86 | 1 (20) | P < 0.005 |
| CPVT | 3 | 12.3 ± 3.2 | 49 ± 11 | 39–60 | 1 (33) | P < 0.05 |
VPB = ventricular premature beats; DCMP = dilated cardiomyopathy; LQTS = long QT syndrome; BrS = Brugada syndrome; CPVT = catecholaminergic polymorphic ventricular tachycardia.
We did not find any difference in heart rate when TWA was registered in children with cardiovascular pathology and healthy (56–137 vs. 64–132 bpm, respectively). There was a strong correlation between the longest QT interval and the peak value of TWA, r = 0.46; P < 0.05 (Fig. 1).
Figure 1.
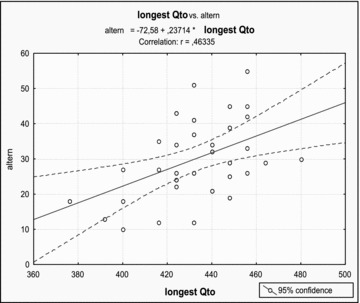
Relationship between the peak value of TWA and the longest QT interval during Holter monitoring in 48 healthy children in 7–17 years of age. Correlation 0.46, P < 0.05.
We also analyzed two additional criteria—circadian pattern of TWA and location of maximal voltage of TWA on JT segment (from the J point to the end of the T wave). Comparing the time of registration between the circadian peak TWA values in 94% healthy children and 92% patients with cardiovascular diseases, we found it was mostly present during a wakeful state previously at second part of day period (Fig. 2).
Figure 2.
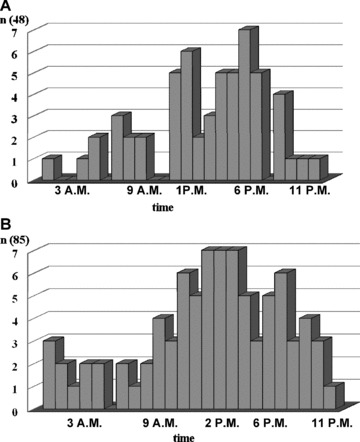
(A) Circadian rhythm of the peak value of time domain TWA in 48 healthy children in 7–17 years of age (circadian peak of TWA at 6 PM). (B) Circadian rhythm of the peak value of TWA in 85 children with cardiovascular diseases (circadian peak of TWA at 2–4 PM).
Heart rate for night circadian type of peak value of TWA ranged from 64 to 108 bpm. In three (6%) healthy children and seven (8%) patients with cardiovascular pathology the circadian peak, TWA was registered during sleep (Table 2). Among them, 40% (two healthy children and three patients with VPB) had maximal TWA values less than 55 μV and 60%—one healthy children, two LQTS patients with LQT3 mutation, one with DCPM, and one patient with BrS (Fig. 3)—had TWA more than 55 μV.
Table 2.
Characteristics of Children with Night Circadian Type of TWA
| Subjects | Diagnosis | Age | Sex | Circadian Peak of TWA | TWA (μV) | RR TWA (msec) |
|---|---|---|---|---|---|---|
| 1 | Healthy | 12 | M | 05:29 | 26 | 681 |
| 2 | Healthy | 10 | M | 01:14 | 98 | 857 |
| 3 | Healthy | 9 | M | 04:36 | 24 | 937 |
| 4 | VPB | 7 | M | 03:52 | 49 | 821 |
| 5 | VPB | 15 | M | 02:07 | 41 | 909 |
| 6 | VPB | 17 | M | 03:24 | 41 | 857 |
| 7 | LQTS (LQT3) | 8 | M | 05:43 | 73 | 1052 |
| 8 | LQTS (LQT3) | 13 | M | 03:56 | 80 | 625 |
| 9 | DCMP | 12 | F | 01:03 | 99 | 869 |
| 10 | BrS | 17 | M | 05:28 | 86 | 1000 |
VPB = ventricular premature beats; LQTS (LQT3) = long QT syndrome (3rd genotype); DCMP = dilated cardiomyopathy; BrS = Brugada syndrome.
Figure 3.
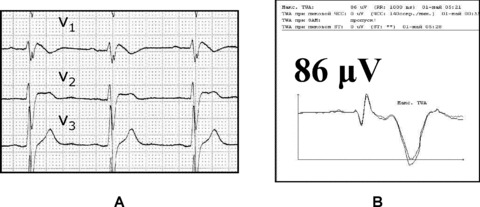
Night circadian peak of TWA in Brugada syndrome (17‐year‐old patient). (A) ECG pattern of Brugada syndrome; (B) maximal peak value of TWA 86 μV at 5:28 AM in modified lead V1.
Location of maximal voltage TWA on T wave (Fig. 4) was mostly found at the ascending part of the T wave (92% of cases, type A, Fig. 4A) and in limited cases on the top of the T wave (4%, type B, Fig. 4B), on the ST segment (3%, type C, Fig. 4C), and at the descending part of the T wave (1% of cases, type D, Fig. 4D).
Figure 4.
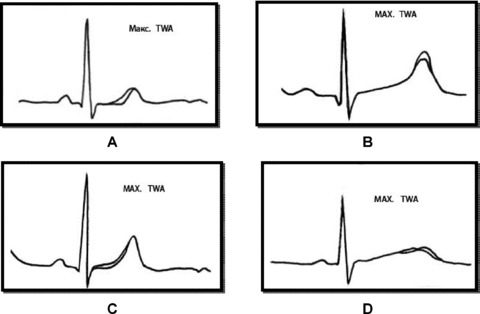
The types of pattern location of point of maximal voltage of TWA on JT segment in children in modified lead V5. (A) segment ST + ascending part of T wave (92%); (B) the peak of the T wave (4%); (C) segment ST (3%); (D) descending part of T wave (1%).
DISCUSSION
Early TWA has been described as a noninvasive marker of life‐threatening ventricular arrhythmia in some adult cardiac populations. The incidence and potential significance of TWA in pediatric populations has not been defined well. In a study by Cheung et al. 15 TWA was evaluated by spectral method during bicycle exercise test in 100 apparently healthy children in an age group similar to our study (from 8 to 17 years old). There was no significant difference between age, gender, endurance, maximum heart rate, QRS duration, QT, or QTc interval in children with and without sustained TWA that was present in 11% of normal children, but was absent at heart rates below 120 bpm and rare (1.2%) below 60% of predicted maximum heart rate. Alexander et al. 16 studied spectral TWA in 304 pediatric patients with heart disease and symptoms (congenital heart disease, myopathy, potential myocardial ischemia, syncope, or history of cardiac arrest) by a treadmill exercise test. Abnormal TWA was registered in 24 (7%) patients including 19 with high risk for serious events (three of them had cardiac arrest). Authors concluded that pathologic values of sustained TWA is associated with high risk of serious events in pediatric patients while the absence of TWA has relatively high negative predictive value, but it does not completely exclude the potential for serious sustained ventricular arrhythmias. Both studies were performed by spectral‐based method. We have not found date about results of TWA assessment by time‐domain MMA algorithm in children.
A several retrospective 17 , 18 , 19 and prospective 20 , 21 studies were performed by MMA method in adult population. In the study by Sakaki et al. 21 authors used a cutoff point of TWA higher 65 μV that was significantly associated with cardiac mortality in adult population. In this study, the mean values of TWA in patients with and without the primary end‐point (cardiac arrest) were 72 ± 20 and 52 ± 15 μV, respectively. But the cutoff value of 65 μV was higher than of other previous study, 17 which was assessed by time‐domain MMA method (46.6 and 53 μV in V1 and V5, respectively). For our results, time‐domain TWA on 24‐hour HM did not exceed 55 μV in both the age groups of healthy children (newborns and children and adolescents of 7–17 years of age). Nieminen et al. 20 obtained 39 ± 19 μV as the mean value of TWA by MMA method in surviving adult patients during exercise test. It was very similar to our mean value of TWA in the group of healthy children. This result and absence of difference in age and gender in our healthy group allow us to speculate that value of time‐domain TWA may be a universal marker of electrical heart condition. We obtained close relation of TWA to longest QT interval during HM (Fig. 1), probably because both parameters reflected electrical instability of heart.
In our observation, the magnitude of time‐domain TWA was significantly higher in all groups of cardiac disorder compared to with healthy children and the highest in the nonischemic DCMP patients (68 ± 43 μV). Previous studies on adult patients also revealed that the magnitude of time‐domain TWA in patients with nonischemic DCMP and left ventricular dysfunction was higher than in patients with ischemic left ventricular dysfunction. 21
It is well known that children with LQTS have very high risk of sudden cardiac death. Diagnosing congenital LQTS is difficult due to variable penetrance and genetic heterogeneity. Accurate diagnosis is made difficult by limitations of the ECG as a diagnostic tool, because the QT intervals of affected and unaffected individuals overlap substantially. In a study by Kaufman et al. 22 49 family persons from 101 genotyped members of a family with LQTS, including 26 carriers of the KCNH2 (HERG) mutation, underwent history, ECG analysis, 24‐hour HM with QT, and heart rate variability analysis exercise testing with QT analysis and spectral TWA. QTc was not helpful as a discriminator in carrier children less than 13 years of age. Among genetically affected family members, 18% had abnormal TWA during exercise test. None of the genetically unaffected members had abnormal TWA. Microvolt TWA had high specificity (100%) but was an insensitive (18%) marker for LQTS carrier.
There were a few data about circadian rhythm of TWA. Analysis of circadian dispersion of maximal TWA values in our groups showed that most cases of TWA develop during second part of diurnal period. Eight percent of children from 133 healthy and sick children demonstrated night circadian peak of TWA (Table 2). Forty percent of them were patients with inherited diseases with high risk of sudden cardiac death—DCMP, LQTS (LQT3 genotype), and BrS which had value of TWA more than 55 μV. It is known that BrS and LQT3 are syndromes with risk of fatal events predominantly during the night/sleep period. 23 , 24
We have revealed different patterns of maximal voltage TWA on T wave. Typical was localization on the ascending part of the T wave, but in few cases there were other localizations (Fig. 4). Some authors mentioned that different parts of the T wave on ECG reflect transmural, transseptal, and apico‐basal heterogeneities of final repolarization of the action potential within ventricular myocardium that may be responsible for pattern and inscription of the T wave. 25 , 26 , 27 Full repolarization of the epicardial action potential is coincident with peak of the T wave, and repolarization of the M cells coincides with the end of the T wave and determines the QT interval prolongation. The interval between the peak and end of the T wave (Tpeak‐Tend) has been suggested to provide an index or marker of transmural dispersion of repolarization, which may be useful for assessment of patients with risk of life‐threatening arrhythmias. 28 , 29 Based on our results, we can speculate that definition type of the maximal voltage TWA on T wave during HM may be perspective for clinical assessment condition of heterogeneities ventricular repolarization especially in patients with inherited arrhythmias and channelopathies.
Study Limitations
We have no possibility to compare our results to previous studies that assessed by time‐domain method TWA during HM in children and to other noninvasive markers, including spectral TWA. Only a few children with inherited channelopathies molecular genotype identification have been available. The number of patients in some group of this study is relatively small and some of them have been taking antiarrhythmic drugs. We had short period of the follow‐up, which did not make possible to determine the outcomes in the our clinical groups and to determine the cutoff of points for TWA in the children.
Conclusion
-
1
Assessment of the time‐domain TWA during 24‐hour Holter ECG monitoring would be useful for screening in pediatric patients at any age.
-
2
Values of the time‐domain TWA during 24‐hour Holter ECG monitoring in healthy children independent of age, gender and level of heart rate.
-
3
In healthy children, the peak values of the time‐domain TWA during 24‐h Holter ECG monitoring do not exceed 55 μV in 94% but for children with cardiovascular pathology TWA more than 55 μV revealed in 20–50%.
-
4
Night circadian type of TWA in children with inherited diseases with risk of life‐threatening arrhythmias was associated with values of the time domain TWA more than 55 μV.
REFERENCES
- 1. Hearing H. Das Wesen des Herzalternans. Beat‐to‐beat T wave changes in experimental animal administration of glycolic acid. Munchen Med Wochenshr 1909;4:1417–1421. [Google Scholar]
- 2. Lewis T. Notes upon alternation of the heart. QJ Med 1910;4:141–144. [Google Scholar]
- 3. Nearing BD, Huang AH, Verrier RL. Dynamic tracking of cardiac vulnerability by complex demodulation of the T wave. Science 1991;252:437–440. [DOI] [PubMed] [Google Scholar]
- 4. Kleinfeld MJ, Rozanski JJ. Alternans of the ST segment in Prinzmetal's angina. Circulation 1977;55:574–577. [DOI] [PubMed] [Google Scholar]
- 5. Smith JM, Clancy EA, Valeri CR, et al Electrical alternans and cardiac electrical instability. Circulation 1988;77:110–121. [DOI] [PubMed] [Google Scholar]
- 6. Grimm W, Glaveris C, Hoffmann J, et al Noninvasive arrhythmia risk stratification in idiopathic dilated cardiomyopathy: Design and first results of the Marburg Cardiomyopathy Study. Pacing Clin Electrophysiol 1998;21:2551–2556. [DOI] [PubMed] [Google Scholar]
- 7. Rosenbaum DS, Jackson LE, Smith JM, et al Electrical alternans and vulnerability to ventricular arrhythmias. N Engl J Med 1994;330:235–241. [DOI] [PubMed] [Google Scholar]
- 8. Raeder EA, Rosenbaum DS, Bhasin R, et al Alternating morphology of QRST complex preceding sudden death. N Engl J Med 1992;326:271–272. [DOI] [PubMed] [Google Scholar]
- 9. Schwartz PJ, Malliani A. Electrical alternation of the T‐wave: Clinical and experimental evidence of its relationship with the sympathetic nervous system and with the long Q‐T syndrome. Am Heart J 1975;89:45–50. [DOI] [PubMed] [Google Scholar]
- 10. Makarov LM, Belokon NA, Laan MI, et al Holter monitoring in the long QT syndrome of children and adolescents. Cor Vasa 1990;32:474–483. [PubMed] [Google Scholar]
- 11. Rosenbaum MB, Acunzo RS. Pseudo 2:1 atrioventricular block and T wave alternans in the long QT syndromes. J Am Coll Cardiol 1991;18:1363–1366. [DOI] [PubMed] [Google Scholar]
- 12. Smith JM, Clancy EA, Valeri CR, et al Electrical alternans and cardiac electrical instability. Circulation 1988;77:110–121. [DOI] [PubMed] [Google Scholar]
- 13. Rosenbaum DS, Jackson LE, Smith JM, et al Electrical alternans and vulnerability to ventricular arrhythmias. N Engl J Med 1994;330:235–241. [DOI] [PubMed] [Google Scholar]
- 14. Verrier RL, Nearing BD, La Rovere MT, et al Ambulatory electrocardiogram‐based tracking of T wave alternans in postmyocardial infarction patients to assess risk of cardiac arrest or arrhythmic events. J Cardiovasc Electrophysiol 2003;14:705–711. [DOI] [PubMed] [Google Scholar]
- 15. Cheung MM, Davis AM, Cohen RJ, et al T wave alternans threshold in normal children. J Cardiovasc Electrophysiol 2001;12:424–427. [DOI] [PubMed] [Google Scholar]
- 16. Alexander M, Cecchin F, Huang KP, et al Microvolt t‐wave alternans with exercise in pediatrics and congenital heart disease: Limitations and predictive value. Pacing Clin Electrophysiol 2006;29:733–741. [DOI] [PubMed] [Google Scholar]
- 17. Verrier RL, Nearing BD, La Rovere MT, et al ATRAMI Investigators. Ambulatoryelectrocardiogram‐based tracking of T wave alternans in postmyocardialinfarction patients to assess risk of cardiac arrest or arrhythmic death. J Cardiovasc Electrophysiol 2003;14:705–711. [DOI] [PubMed] [Google Scholar]
- 18. Exner DV, Kavanagh KM, Slawnych MP, et al REFINE Investigators. Noninvasiverisk assessment early after a myocardial infarction: The REFINE study. J Am Coll Cardiol 2007;50:2275–2284. [DOI] [PubMed] [Google Scholar]
- 19. Stein PK, Sanghavi D, Domitrovich PP, et al Ambulatory ECG‐based T‐wave alternans predicts sudden cardiac death in high‐risk post‐MI patients with left ventricular dysfunction in the EPHESUS study. J Cardiovasc Electrophysiol 2008;19:1037–1042. [DOI] [PubMed] [Google Scholar]
- 20. Nieminen T, Lehtimäki T, Viik J, et al T‐wave alternans predicts mortality in a population undergoing a clinically indicated exercise test. Eur Heart J 2007;28:2332–2337. [DOI] [PubMed] [Google Scholar]
- 21. Sakaki K, Ikeda T, Miwa Y, et al Time‐domain T‐wave alternans measured from Holter electrocardiograms predicts cardiac mortality in patients with left ventricular dysfunction: A prospective study. Heart Rhythm 2009;6:332–337. [DOI] [PubMed] [Google Scholar]
- 22. Vincent GM, Timothy KW, Leppert M, et al The spectrum of symptoms and QT intervals in carriers of the gene for the long‐QT syndrome. N Engl J Med 1992;327:846–852. [DOI] [PubMed] [Google Scholar]
- 23. Matsuo K, Kurita T, Inagaki M, et al The circadian pattern of the development of ventricular fibrillation in patients with Brugada syndrome. Eur Heart J 1999;20:465–470. [DOI] [PubMed] [Google Scholar]
- 24. Van Den Berg MP, Haaksma J, Veeger NJ, et al Diurnal variation of ventricular repolarization in a large family with LQT3‐Brugada syndrome characterized by nocturnal sudden death. Heart Rhythm 2006;3:290–295. [DOI] [PubMed] [Google Scholar]
- 25. Antzelevitch C, Sicouri S, Litovsky SH, et al Heterogeneity within the ventricular wall. Electrophysiology and pharmacology of epicardial, endocardial, and M cells. Circ Res 1991;69:1427–1449. [DOI] [PubMed] [Google Scholar]
- 26. Yan GX, Antzelevitch C. Cellular basis for the normal T wave and the electrocardiographic manifestations of the long QT syndrome. Circulation 1998;98:1928–1936. [DOI] [PubMed] [Google Scholar]
- 27. Janse MJ, Sosunov EA, Coronel R, et al Repolarization gradients in the canine left ventricle before and after induction of short‐term cardiac memory. Circulation 2005;112:1711–1718. [DOI] [PubMed] [Google Scholar]
- 28. Antzelevitch C. The M cell. Invited Editorial Comment. J Cardiovasc Pharmacol Ther 1997;2:73–76. [DOI] [PubMed] [Google Scholar]
- 29. Cohen IS, Giles WR, Noble D. Cellular basis for the T wave of the electrocardiogram. Nature 1976;262:657–661. [DOI] [PubMed] [Google Scholar]