Abstract
Background: Continuous 12‐lead ECG monitoring (Holter) in early‐phase pharmaceutical studies is today widely used as an ideal platform to extract discrete ECGs for analysis. The extraction process is typically performed manually by trained readers using commercial Holter processing systems.
Methods: Antares, a novel method for automatic 12‐lead extraction from continuous Holter recordings applying minimal noise criteria and heart‐rate stability conditions is presented. A set of 12‐lead Holter recordings from healthy subjects administered with sotalol is used to compare ECG extractions at fixed time points with ECG extractions generated by Antares optimizing noise and heart rate inside 5 minute windows centered around each expected time point of interest.
Results: Global, low‐ and high‐frequency noise content of extracted ECGs was significantly reduced via optimized approach by Antares. Heart rate was also slightly reduced (from 69 ± 13 to 64 ± 13 bpm, P < 0.05). Similarly, the corrected QT interval from optimized extractions was significantly reduced (QTcB from 414 ± 32 to 402 ± 30 ms, P < 0.05). Using only baseline data, and after adjusting for intersubject variability, the standard deviation (SD) of QT intervals was highly reduced with optimized extraction (SD of QTcF from 11 ± 8 to 7 ± 2 ms, P < 0.05).
Conclusions: Extraction of discrete 12‐lead ECG strips from continuous Holter generates less noisy and more stable ECGs leading to more robust QTc data, thereby potentially facilitating the assessment of ECG effects on clinical trials.
Keywords: automated Holter ECG extractions, ECG quality in clinical trials, ECG optimization in thorough QT studies
Continuous recording and storage of 12‐lead ECGs presents a series of advantages in pharmaceutical clinical trials, particularly in phase I and the so‐called thorough QT study used to assess the risk of a drug‐induced QT effect during the early phase of development of new drug candidates. 1 With acquisition of many ECGs in clinical trials of this type, mistakes with data collection using conventional ECG chart machines are not uncommon. Continuous recording also facilitates the investigation of alternative analysis approaches or the exploration of new biomarkers, which in certain cases can bring scientific value. 2
The most important advantage of using Holter recorders is the possibility to optimize the process of selecting which portion of continuous ECG recording will be analyzed, particularly in studies aimed at characterizing the effect of new drug candidates on the QT/QTc interval. While the noise content of the ECG signal can also be controlled with standard resting ECG machines, the crucial need to focus on the segments with the stable heart rate make the continuous Holter the ideal platform to collect, process, and analyze ECG data during early‐phase pharmaceutical development. 2 , 3 , 4
A fundamental concern with Holter technology remains ECG data quality, mainly in terms of frequency response of the recording devices but also with respect to the resolution of the recorded digital signals. Recent advancements in this area have been impressive and today several manufactures offer high resolution 12‐lead Holter recorders.
The individual segments of Holter recordings (strips) are typically extracted by trained readers by manual selection after visual inspection of the ECG signal using a commercial Holter processing system. Being a very strenuous and lengthy, this operation is likely to be poorly reproducible and prone to mistakes and creates a need for computer applications capable of performing an automatic ECG extraction according to standard criteria that can be customized and/or optimized as needed. In this article we describe the key aspects of the generic automatic Holter extraction and compare it with a novel method based on noise optimization while ensuring heart‐rate stability.
METHODS
The method presented is a computer program called Antares which can generate automatic Holter extractions either using a graphic interface or through an external programmable library. Antares is directly interfaced with several 12‐lead ECG Holter systems and also with public domain ECG standards, such as the ISHNE format. 5
The philosophy of Antares is schematically depicted in Figure 1. Around each of the protocol‐based time points (nominal time point), an optimum window (OW), centered around the exact position of the time point, is first considered. The OW is a key parameter as it determines the exploring time window where optimized extractions should be found. The larger the OW, the easier will be to detect good quality and stable ECG strips, but also the higher the possibility to select extractions away from the nominal time point. The best choice for the OW size may depend on the compound being studied: with slow response compounds a longer OW may be preferable, whereas with drugs with fast kinetics, where there is the need to obtain data as close as possible to the nominal time points, the window length should be reduced.
Figure 1.
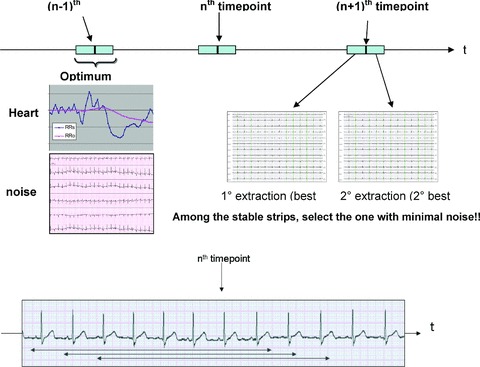
Schematic description of Antares.
Inside the OW, a set of potential (candidate) extractions are then defined. Each annotated cardiac complex determines the beginning of a new candidate extraction (candidates can thus overlap, see bottom of Fig. 1) with the further requirement that all cardiac complexes inside the candidate must be of sinus origin. The total number of candidate extractions within the OW will thus depend on several factors, such as the heart rate inside the OW, the length of the OW, and the presence of arrhythmic beats and artifact complexes. Each individual candidate will finally be flagged with two independent scores, a quantitative assessment of ECG signal noise content of the candidate, and a parameter assessing the stability of heart rate during the time period preceding (and including) the candidate. The candidate that will be selected is the one with smallest noise score among those that meet the heart‐stability criteria. The process is repeated when more than one extraction is requested around each time point, but multiple extractions will not overlap with each other. In addition, a time gap between multiple extractions can be imposed if there is a need to avoid the extracted ECGs being too close in time.
While more sophisticated definition of noise and heart‐rate stability may emerge with more knowledge in the field, the so‐called hysteresis phenomenon of QT interval has been extensively described. 3 , 6 , 7 In Antares, the heart‐rate stability is assessed by comparing the average RR interval computed as the average over the preceding 60‐second duration of the candidate strip (RRs and RRo, wherein the ‘s’ and ‘o’ denote the strip and the observation period, respectively). During acceleration and deceleration phases of the heart rhythm within the candidate, RRs will change at a faster rate than RRo (being computed over a shorter period) and thus the flagging of candidate extractions with large deviations between RRs and RRo as unstable is warranted. Figure 2 shows how the RRs and RRo are used in real life: in the plot the x‐axis is the (2 minutes in this example) OW centered around a prescheduled time point at 12:43:00. On the y‐axis, the RRs and RRo values corresponding to each 10‐second candidate found inside the OW are plotted. Note that the RRo curve is smooth, reflecting the longer period over which the average RR is being computed, whereas the RRs curve reflects sudden transitions of the heart rate, particularly in the example of Figure 2 where it underwent a big acceleration about 12:42:40. At the prescheduled time point, the difference between RRs and RRo is indeed large (about 100 ms) and the associated candidate is flagged as unstable. The best selected candidate is the one at 12:42:28, that is, about 30 seconds before the expected time point, before the beginning of the acceleration. The selection based on heart rate has an important implication corrected QT interval used for the analysis; in the presented example the Bazett's QTc was 10 ms longer when computed at the prescheduled time point than when derived in the ECG from the optimized candidate ECG strip selected by Antares.
Figure 2.

Trend display of RRs and RRo intervals within the optimum window from a representative example (see text for more description of RRs and RRo intervals).
The following nonexhaustive list of parameters provides an example of the Antares extraction output, and can be customized to different extraction scenarios applied to clinical trial protocols:
-
•
Duration of candidate ECG strips to be extracted: extraction of 10‐second strips is most commonly used as the default used in pharmaceutical studies but longer durations may fit other types of ECG data analyses.
-
•
Resolution of time points: this is the distance between the time points prescheduled in the protocol, and thus what determines the location of the center of the OW. In some studies, time points are equally distributed at fixed times of the day. More frequently, the time point follow the dynamic of the compound and may be given relatively to a dosing time.
-
•
Length of the OW: as previously described, this is a key parameter and indicates the time window to be applied around each nominal time point to find the “best” extraction.
-
•
Number of ECGs extraction to be taken at each time point: to decrease the biological variability and measurement error during the intensive QTc assessment on clinical trials, it is typical to extract more than one ECG at each nominal time point and pay attention to careful standardization of experimental conditions during ECG acquisition (e.g. fully supine quiet rest for 10–15 minutes prior to the prescheduled time point). This is of crucial importance for reliability of ECG data submitted to the conclusive assessment of drug‐induced changes. 8
RESULTS
To quantify the usefulness of automatic optimized extraction we report the results of an internal pilot study from a sotalol database based on digital 12‐lead Holter (Mortara H12 recorder) that has been widely used and previously described. 9 , 10 , 11 This database is representative of the conditions typically present in a robust phase 1 study used for QTc assessment, where (due, e.g. to sinus arrhythmia) there is a potential benefit from optimized extraction. Although the study was based on a three day protocol (baseline, 160 and 320 mg intake on sotalol), we focused on the baseline Holters and those with 160 mg sotalol. A total of 78 Holter recordings (39 baseline/160 mg sotalol pairs) were considered. From each recording, 11 nominal time points relative to dosing time (which was consistently fixed at approximately 8.00 AM) were considered: 1, 1.5, 2, 2.5, 3, 3.5, 4, 4.5, 5, 6, 8 h, thus leading to 858 nominal time points in the 78 Holter recordings. For 37 of the 858 nominal time points the raw data was not available as the Holter recorder stopped before the end of the recording and thus a total of 821 effective time points were used.
Fixed (nonoptimized) 10‐second ECG strips were first extracted at the exact nominal time point considered; the optimized extraction by Antares was then applied using a 5‐minute OW. A single extraction per nominal time point was considered. Both fixed and optimized ECG extractions were subsequently automatically processed using AMPS on‐screen measuring system CalECG, which automatically computed the heart rate (based on the RR intervals from the 10‐second ECG) and the global QT interval from the vector magnitude derived from representative beats. 12 , 13 The same ECG strips were also processed using FDAECGSuite, another AMPS tool that computes quantitative scores based on noise. 13 The description of the noise computation by the FDAECGSuite is beyond the scope of this article; we will simply point out that both the global (all frequencies), low‐frequency (LF) and high‐frequency (HF) noises are independently estimated on each ECG using standard signal processing techniques based on QRS subtraction, low‐ and high‐pass filtering with Butterworth filters and computation of root mean square value on the residual signal. The FDAECGSuite was also used to review the automated analysis from CalECG to verify for algorithm errors; out of 1642 (821 × 2) ECGs 10 were judged to be wrongly annotated (7 from the fixed extraction set and 3 from the optimized) and were discarded for subsequent QT analysis.
The level of noise from the fixed (nonoptimized) and from the associated optimized extractions were compared using Student's paired t‐test. The same was done with the heart rate and with the QT/QTc intervals. Results are given in Table 1. Global, HF and LF noises were all significantly reduced after optimum selection by Antares (global noise: 76 ± 75 vs 52 ± 38 μV, respectively for fixed and optimized extractions). The heart rate was also reduced after optimized extraction (69 ± 13 vs 64 ± 11 bpm, respectively for fixed and optimized extractions). The QT interval is slightly but significantly longer with nonoptimized extraction, whereas both the Bazett's QTcB and Fridericia's QTcF are largely reduced after optimization (QTcB: 414 ± 32 vs 402 ± 30 ms; QTcF: 407 ± 28 vs 399 ± 26 ms).
Table 1.
Comparison of Select Quantitative and Qualitative ECG Parameters between Optimized and Fixed‐Time Point Extractions
| Parameter | Fixed | Optimized | Δ (F−O) |
|---|---|---|---|
| Global noise (μV) | 76 ± 75 | 52 ± 38 | 24 ± 77* |
| HF noise (μV) | 0.86 ± 0.31 | 0.82 ± 0.22 | 0.03 ± 0.32* |
| LF noise (μV) | 93 ± 77 | 67 ± 41 | 26 ± 80* |
| HR (bpm) | 69 ± 13 | 64 ± 11 | 5.1 ± 8.8* |
| QT (ms) | 392 ± 39 | 394 ± 39 | −2 ± 10* |
| QTcB (ms) | 414 ± 32 | 402 ± 30 | 12 ± 17* |
| QTcF (ms) | 407 ± 28 | 399 ± 26 | 8 ± 13* |
*P < 0.05 with Student's paired t‐test.
Results reported in Table 1 have been obtained pooling all the ECGs, and thus include both the intersubject and on–off drug variability thus explaining the large standard deviations (SDs) of QT intervals. We have repeated the same comparisons only using the baseline recordings and computing the SDs of QT data from the ECGs of each subject. The average values of SD of QTcB and QTcF were, respectively, 16 ± 10 and 11 ± 8 ms in the nonoptimized ECGs versus 11 ± 3 and 7 ± 2 in the optimized extractions (P < 0.05), thus showing that once having adjusted for intervariability and drug status, the variability of QT is also reduced after optimized extractions.
In Figure 3, the global noise histograms of the two populations are displayed. The histogram of the optimized ECG strips (left panel) is clearly shifted toward the left‐hand side (less noise). The range for the two distributions is respectively 22–336 and 20–141 μV. Figure 4 is an example of nonoptimized (global noise 315 μV) versus optimized (global noise 61 μV) extraction from one representative case with high noise content score. Figure 5 is another example from a prescheduled time point with strong heart‐rate fluctuations: the two ECGs are only 2 minutes apart, but the heart rate in particular the QT intervals are strongly different. The RR and QT intervals in the selected strip (the ECG on the right‐hand side) were respectively 178 and 32 ms longer than those at the nominal time point (the ECG on the left‐hand side), resulting in a Bazett's QTc interval which is 13 ms shorter. In Figure 6, the values of global noise are plotted against the heart rate for the corresponding extracted ECGs. The optimized extraction produced a narrower cloud of points with a strikingly higher incidence of outliers; in addition the noise dependency of heart rate is clearly reduced after optimization (slope of the regression changed from 0.98 to 0.74).
Figure 3.
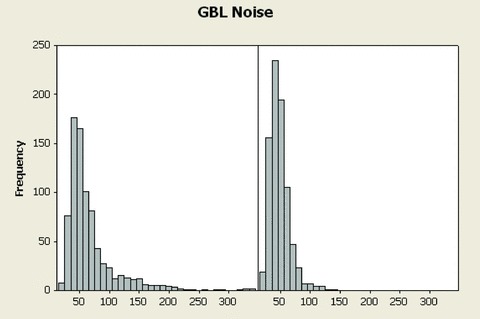
Histograms of global (all frequencies) noise from the 821 ECGs using the fixed time point method (left panel) and using Antares (right panel). The distribution of global noise is overly shifted to the right‐hand side after optimized extraction by Antares.
Figure 4.
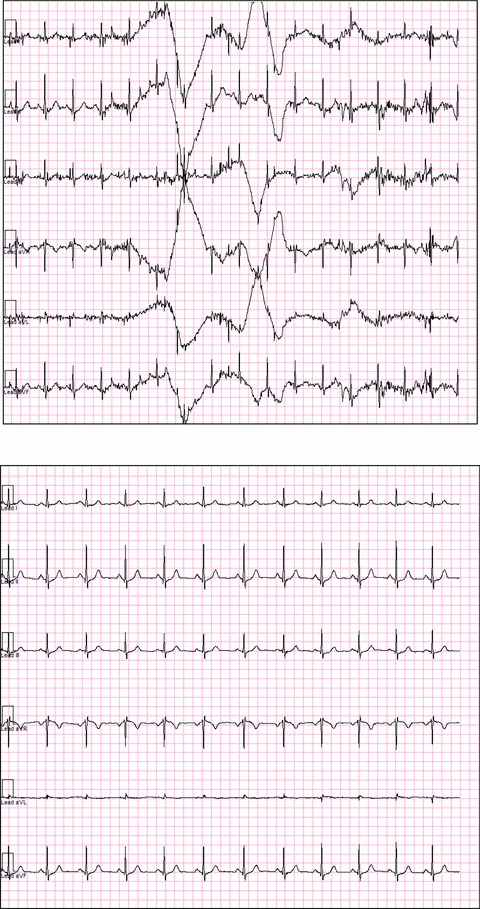
Example of ECG extraction using a fixed time point (upper plot) and using Antares (bottom plot) in a representative example with presence of noise. Only limb leads are displayed.
Figure 5.
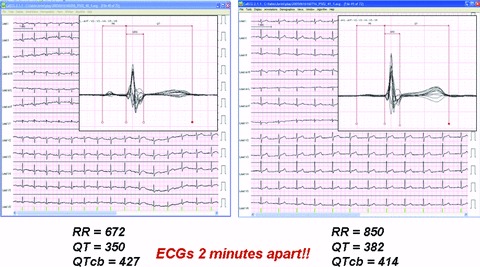
Example of ECGs extraction using a fixed time point (left‐hand side) and using Antares (right‐hand side) in a representative example with the presence of heart‐rate fluctuations. The superimposed (butterfly) display of the median beats is also displayed and the QT/RR parameters computed by CalECG are shown.
Figure 6.
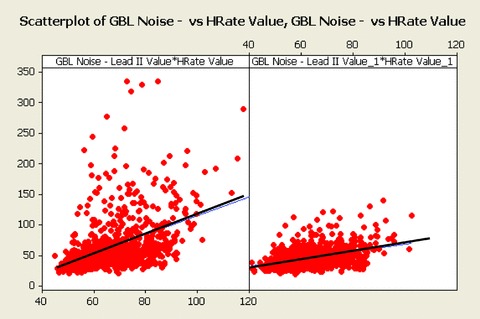
Scatterplots of global (all frequencies) noise versus heart rate, using the fixed time point method (left panel) and using Antares optimized extractions (right panel). The heart dependency of noise is reduced after optimized extraction by Antares.
DISCUSSION AND CONCLUSIONS
We presented the rationale behind the need for an automated method to extract discrete ECG strips from continuous Holter recordings and demonstrated the usefulness of the novel Antares approach for this purpose.
Global, LF and HF noise content of extracted ECGs was significantly reduced via optimized approach by Antares. Heart rate was also reduced after optimized extraction showing that if the heart‐rate stability is not considered during extraction, the selected ECG strips would produce a slightly faster rate from the same data. The QTc interval from optimized extractions was also significantly reduced as a consequence of the reduced heart rate rather than a direct effect on the QT interval. After adjusting for intersubject variability and drug status, the variability of QT is also reduced after optimized extractions.
While the correlation between noise and heart rate still persists after optimized extraction, it is significantly reduced as compared to the conventional approach.
The significantly reduced heart rate observed when using optimized extractions is somewhat surprising and partially unexpected. This could be related to the different dynamics of heart‐rate accelerations, which are more frequent and which occur more rapidly, thus determining a higher incidence of heart‐rate instability associated with accelerations. This result requires further evaluation but, if confirmed, would suggest that the risk of a bias toward faster heart rates and, for most correction formulae, longer QTc assessment anytime a fixed nonoptimized extraction is used for processing and analysis of Holter data.
In our robust QTc study in healthy volunteers, the optimized Holter extraction by Antares produced qualitatively better (cleaner) data with more stable heart rate. If systematically used on continuous Holter ECG data from pharmaceutical studies, may contribute to greater quality of QTc assessment in clinical trials.
Pending confirmation in larger cohorts enrolled into prospective clinical studies with drug candidates inducing a range of QTc prolongations, our findings about the higher quality of optimized extractions should lead to an overall reduced variability of ECG data and more reproducible testing of cardiac drug safety in clinical trials.
Conflicts of Interest: F. Badilini is Chief Scientist of AMPS LLC, a commercial company that owns Antares software.
Acknowledgments
Acknowledgment: The authors are thankful to Pierre Maison‐Blanche M.D. from Lariboisiere Hospital, Paris for his helpful advice and support.
REFERENCES
- 1. International Conference on Harmonization of Technical Requirements for Registration of Pharmaceuticals for Human Use (ICH) . E14 Guidance on Clinical Evaluation of QT/QTc Interval Prolongation and Proarrhythic Potential for Non‐antiarrythmic Drugs. Available at: http://www.fda.gov/cder/guidance/6922fnl.pdf, 2005.
- 2. Sarapa N. Digital 12‐lead Holter in the assessment of drug effects on cardiac repolarization. J Electrocardiol 2006;38:293. [DOI] [PubMed] [Google Scholar]
- 3. Badilini F, Maison‐Blanche P, Childers R, et al QT interval analysis on ambulatory recordings: A selective beat averaging approach. Med Bio EngComp 1999;37:71–79. [DOI] [PubMed] [Google Scholar]
- 4. Extramiana F, Maison‐Blanche P, Haggui A, et al Control of rapid heart rate changes for electrocardiographic analysis: Implications for thorough QT studies. Clin Cardiol 2006;29:534–539. [DOI] [PMC free article] [PubMed] [Google Scholar]
- 5. Badilini F. The ISHNE Holter sandard output file format. Ann Noninvasive Electrocardiol 1998;3:263–266. [Google Scholar]
- 6. Franz MR, Swerdlow CD, Liem LB, et al Cycle length dependence of human action potential duration in vivo: Effects of single extrastimuli, sudden sustained rate acceleration and deceleration, and different steady state frequency. J Clin Invest 1988;82:972–979. [DOI] [PMC free article] [PubMed] [Google Scholar]
- 7. Pueyo E, Smetana P, Caminal P, et al Characterization of QT interval adaptation to RR interval changes and its use as a risk‐stratifier of arrhythmic mortality in amiodarone‐treated survivors of acute myocardial infarction. IEEE Trans Biomed Eng 2004;51:1511–1520. [DOI] [PubMed] [Google Scholar]
- 8. Sun H, Chen P, Hunt J, Malinowski H. Frequency of QT recording and reliability of QT prolongation assessment. Clin Pharm Ther 2004;75:48. [Google Scholar]
- 9. Sarapa N, Morganroth J, Couderc JP, et al Electrocardiographic identification of drug‐induced QT prolongation: Assessment by different recording and measurement methods. Ann Noninvasive Electrocardiol 2004;9:48–57. [DOI] [PMC free article] [PubMed] [Google Scholar]
- 10. Couderc JP, Zareba W, Moss A, et al Identification of sotalol‐induced changes in repolarization with T‐wave area based repolarization duration parameters. J Electrocardiol 2003;36S:115–120. [DOI] [PubMed] [Google Scholar]
- 11. Extramiana F, Badilini F, Sarapa N, et al Contrasting time and rate based approaches for the assessment of drug‐induced QT changes. J Clin Pharmacol 2007;47:1129–1137. [DOI] [PubMed] [Google Scholar]
- 12. Kligfield P, Badilini F, Brown B, et al The ISCE Genome Pilot challenge: A 2004 progress report. J Electrocardiol 2004;37S:144–148. [DOI] [PubMed] [Google Scholar]
- 13. AMPS LLC official web page. Available at: http://www.amps-llc.com/.


