

Abstract
Background: QT dispersion (QTd) contains prognostic information in several patient groups. The variable increases in several conditions with ischemia. Originally, it was thought to reflect the local repolarization inhomogeneity. Even though this explanation has been questioned lately, it continues to be put forward. In order to elucidate a possible local mechanism, we investigated the relation between QT dispersion, an ECG parameter reflecting the local dispersion, and angiographical measures in a population with unstable coronary artery disease.
Methods: The 276 patients were recruited from the FRISC II trial. As the QTd parameter we used the mean value of automatically measured QTd during 27 hours after admission (QTdMean). As a local repolarization measure we used the maximal difference in QT between two adjacent ECG leads (QTdiffMean). The computations were performed on all available ECG leads and on a restricted set without the V1–V2 combination. Previously published angiographic scoring tools were adapted for rating and localizing the coronary pathology by two approaches and applied on 174 patients undergoing angiography.
Results: QTdMean was significantly higher than that reported in previous material with unselected chest pain patients (55 vs 40 ms). QTdiffMean correlated strongly with QTdMean. No differences in QTdMean were detected between patients with different angiographical scores. No relation could be shown between the region with dominating coronary pathology as expressed by the scoring tools and the localization of QTdiffMean.
Conclusions: QTd in ischemia seems to be increased by a mechanism unrelated to localization and severity of coronary disease.
Keywords: QT dispersion, repolarization, coronary artery disease, coronary angiography
QT dispersion (QTd) is an easily accessible parameter obtained from surface ECG that contains prognostic information in several patient groups. QTd is known to increase in several conditions with ischemia, such as during spontaneous episodes of angina, 1 during and immediately after inflation of a PTCA‐balloon, 2 and after incremental atrial pacing in patients with coronary triple‐vessel disease. 3 QTd is decreased by PTCA 4 and increased by restenosis. 5 QTd increases during the initial course of acute myocardial infarction 6 , 7 whereas successful thrombolysis decreases QTd. 8 The variable has been thought to reflect the local repolarization inhomogeneity, 9 , 10 , 11 , 12 and ischemia is one possible cause of the inhomogeneity. The repolarization inhomogeneity will result in a difference in the QT duration between adjacent areas of the myocardium if QTd is caused by local factors. Lately, the local explanation of QTd has been questioned. 13 , 14 , 15 Projections of the t‐wave vector onto the scalar ECG leads result in varying QT durations and can thus generate QTd. 16 , 17 , 18 , 19 , 20 , 21 This hypothesis has not, however, still been generally accepted and the local explanation continues to be put forward. 7 , 22 , 23 The main objective of the present study was to relate QT dispersion to the extent and localization of coronary pathology in a population of ischemic patients. We investigated the relation of automatically measured QTd to a derived localized ECG parameter that reflects the dispersion and to angiographical measures of coronary artery disease in a population with unstable coronary artery disease. Previously published angiographic scoring tools were adapted for rating and localization of coronary pathology.
METHODS
Patients
The present study was carried out as a substudy of the Fragmin and Fast Revascularization during InStability in Coronary artery disease (FRISC II) trial, a prospective randomized trial involving 58 Scandinavian centers that has been reported in detail elsewhere. 24 , 25 Patients were included if they had symptoms suggestive of an acute coronary syndrome and signs of ischemia (ST‐segment depression or t‐wave inversion) on the ECG or positive biochemical markers for myocardial damage. The main trial had a factorial design with parallel groups. Patients were allocated to one of four treatment groups: Invasive strategy + 3 months subcutaneous dalteparin, invasive strategy + 3 months placebo, noninvasive strategy + 3 months subcutaneous dalteparin, noninvasive strategy + 3 months placebo. In the invasive strategy the aim was to perform coronary angiography, and revascularization within 7 days from admission if appropriate. Patients following the noninvasive strategy underwent coronary angiography only if refractory or recurrent symptoms occurred or if they showed signs of severe ischemia at a predischarge exercise test. The 276 patients, object to current analysis, were recruited into the FRISC II trial at the seven trial centers equipped for continuous recording of 12‐lead ECG. They were in sinus rhythm and exhibited no conduction disturbance. A total of 174 patients underwent coronary angiography, either as a part of the invasive strategy or due to a clinical indication in the noninvasive group. See Figure 1 for the details of the current study profile. Based on our findings, we also analyzed subgroups selected for disease mainly confined to one region and clinically more aggressive coronary artery disease. Written consent was obtained from all patients and the protocol was approved by all local ethics committees.
Figure 1.

Study profile.
ECG Recordings
Sampling of the ECG signal started at the coronary care unit immediately on admission. Each minute, a signal from the 12 conventional scalar ECG leads was collected for 10 seconds at 240 samples per second by a commercial system (TRAM 200SL patient monitors connected to ST‐Guard system, GE Medical Systems, Information Technologies, Milwaukee, WI, USA). The signal was digitized by a 16‐bit A/D converter and a median ECG complex was computed.
The method only used the ECG complexes with dominating morphology within the 10‐second window, thus excluding complexes with grossly aberrant morphology. The QT was computed by a commercial algorithm 26 (QT‐Guard, GE Medical Systems) that has previously been evaluated. 27 , 28 The program defined a simultaneous Q‐onset for all leads and a T‐end for each lead as the intercept of the baseline and a straight line computed by a least‐squares fitting through seven points around the maximum slope of the T wave after a final T‐peak. QT in each lead was computed by the commercial program as T‐end–Q‐onset and QTd as QTmax−QTmin across all available ECG leads. The program also registered the number of leads excluded due to noisy signal, extremely low t‐wave amplitude or undetermined t‐wave shape. The parameters from all recordings in each patient were exported to a custom software package.
QTd Measurements
The ECG recordings with valid registrations from at least 10 leads were considered satisfactory and used for subsequent processing. The custom software computed the mean QTd during the registration time (QTdMean). Local differences in QT between adjacent ECG leads were quantified by an approach similar to the one used by Benn et al. 29 : For each satisfactory ECG recording, the variable QTdiff was computed as the maximal difference in QT between two adjacent ECG leads (precordials and extremity leads ordered in Cabrera sequence). The software then computed QTdiffMean as the mean value of QTdiff for all satisfactory recordings during the observation time. QTdiff in each recording was localized to one of three electrocardiographic regions: anterior when the maximal difference was found in V1–V2, V2–V3, V3–V4, or I‐aVR; lateral (V4–V5, V5–V6 or aVL‐I), and inferior (aVR‐II, II‐aVF, or aVF‐III) (see Figs. 2 and 3). In each patient, the most common localization of QTdiff was taken as the localization of QTdiffMean. The computations were repeated after exclusion of the lead V1 and the V1–V2 lead combination (for justification of this approach see discussion).
Figure 2.
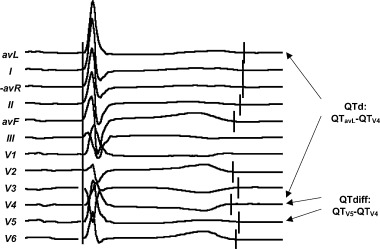
Computation of QTd and QTdiff from an ECG recording.
Figure 3.

Division of the coronary tree into three angiographical regions and classification of the ECG leads into three electrocardiographic regions.
Coronary Angiograms
The angiogram was prospectively analyzed by the operator for stenoses. A predefined classification scheme based on a subdivision of the coronary artery tree into fifteen segments 30 was used. The operator's analysis was used for computing the degree of stenotic changes in the coronary artery tree and localizing the pathology to one of three angiographical regions (Fig. 1). Two different strategies were used in parallel.
-
1
A simple CASS score 31 was computed by evaluating LAD (3 segments), LCX including the sulcus branch (2 segments), and RCA (three segments). We assigned a regional CASS score of 1 to an artery with at least one stenosis of >70% whereas an artery with no stenoses or stenoses ≤70% received a regional CASS score of 0. Left main coronary artery stenosis >70% was treated as a combination of LAD and LCX stenoses. By adding the regional scores, the CASS score with a possible range of 0–3 was obtained. This approach did not take into account the stenoses in the seven segments covering the peripheral vessels.
-
2
A hemodynamically weighted stenosis score (HW score) was computed by the following procedure: Each of the 15 segments was assigned an anatomical coefficient 0.5–5 after Gensini 32 (Table 1) and a stenosis coefficient 0–4 (slightly modified after previously published scoring designs: 30 , 33 0 for normal vessel, 1 for <50% stenosis, 2 for 50–70% stenosis, 3 for >70%–<100% stenosis, and 4 for occlusion). For each arterial segment the anatomical coefficient was multiplied by the stenosis coefficient for a segmental product. By adding the segmental products separately for each region, a regional HW score was computed. The three regional scores were added together for a global HW score with a theoretical maximal value of 82.
Table 1.
Anatomical Coefficients Modified After Gensini 32 and the 15 Coronary Artery Segments After Austen et al., 30 Subdivided into Regions
| Coefficient | Anterior Region | Lateral Region | Inferior Region |
|---|---|---|---|
| 5 | LM (2.5) | LM (2.5) | |
| 2.5 | LADprox | LCXprox | |
| 1.5 | LADmid | ||
| 1 | LADdist, D1 | LCXdist, OM1 | RCA (3 segments), PDA |
| 0.5 | D2 | OM2 |
The left main coronary artery (LM) is assigned a coefficient of 5 that is divided between the anterior and lateral regions.
For both strategies the region with the highest regional score was considered as the region of dominating coronary pathology.
Statistical Analysis
The data were analyzed in SPSS, release 9 (SPSS Inc., Chicago, IL). Values are given as median (interquartile range) unless stated otherwise. Two‐tailed Mann‐Whitney test was used for testing of differences in continuous variables between two groups; for more than two groups the Kruskal‐Wallis test was used. Kappa statistics was used for estimating agreement between categories. Kappa expresses the agreement with values ranging from +1 (perfect agreement) via 0 (no agreement above that expected by chance) to −1 (complete disagreement). Spearman's rho was used for evaluating correlation between variables. A P‐level of <0.05 was considered as significant.
RESULTS
General Findings
The baseline characteristics and outcome for the patients included in the present material were similar to those in the main FRISC II study population 24 , 25 (Table 2). In the entire studied population of 276 patients, the median number of ECG recordings per patient was 1514 (1294–1980), recorded during a median time of 27 hours (23–36). In median, 824 (213–1344) ECG recordings/patient were satisfactory. For the 174 patients who underwent angiography, the median number of ECG recordings per patient was 1512 (1293–2038), recorded during a median time of 27 hours (23–37). In median, 810 (212–1295) ECG recordings/patient were satisfactory.
Table 2.
Basal Characteristics and Outcome for the Investigated Patients
| Patients with QTd‐Data | Patients with QTd‐Data and Coronary Angiogram | |
|---|---|---|
| N | 276 | 174 |
| Age | 66 (59–73) | 64 (58–71) |
| Men | 199 (72%) | 122 (70%) |
| Previous AMI | 72 (26%) | 41 (24%) |
| Diabetes mellitus | 39 (14%) | 26 (15%) |
| Hypertension | 87 (32%) | 62 (36%) |
| Hyperlipidemia | 40 (14%) | 27 (16%) |
| Ejection fraction < 45% (by echo) | 37 (13%) | 18 (10%) |
| Death during follow‐up | 8 (3%) | 4 (2%) |
| Death or AMI follow‐up | 33 (12%) | 29 (17%) |
QTd Measurements
The median QTdMean for the 276 patients was 56 ms (40–70 ms). When the V1 lead was excluded, the resulting restricted median QTdMean was 49 ms (33–66 ms). After dichotomizing the population with respect to known risk factors, no significant difference in QTdMean was found between the groups (Table 3).
Table 3.
QTd in 276 Patients Dichotomized with Respect to Risk Factors
| No | Yes | ||||
|---|---|---|---|---|---|
| n | Median QTdMean | n | Median QTdMean | P (Mann‐Whitney) | |
| Previous AMI | 204 | 56.2 | 72 | 51.4 | 0.32 |
| Diabetes mellitus | 237 | 54.2 | 39 | 56.2 | 0.35 |
| Hypertension | 189 | 54.9 | 87 | 54.9 | >0.5 |
| Hyperlipidemia | 236 | 55.2 | 40 | 49.9 | 0.11 |
| Ejection fraction < 45%a | 226 | 56.1 | 37 | 56.2 | >0.5 |
| Troponin‐T ≥ 0.1 ug/L b | 119 | 50.8 | 152 | 56.8 | 0.09 |
a Not available in 13 cases. b Not available in five cases.
The median value of each patient's mean QTmin was 370 ms (352–392); the corresponding median of mean QTmax was 426 ms (404–450). QTdMean exhibited a significant correlation with mean QTmax (Spearman's ρ= 0.50, P < 0.001) but not with mean QTmin (ρ=−0.08, P = 0.16).
The QTdiffMean was in median 42 ms (27–58). It correlated strongly with QTdMean (Spearman's ρ= 0.93, P < 0.001). The restricted QTdiffMean after exclusion of the V1–V2 lead combination was in median 33 ms (19–48 ms). It correlated with the restricted QTdMean with ρ= 0.91 (P < 0.001). According to the criteria above, the QTdiffMean was localized anteriorly in 181 cases, laterally in 61, and inferiorly in 34 cases. The most common localization of QTdiffMean was V1–V2, being responsible for the maximal local difference of QT in 95 cases. The restricted QTdiffMean was localized anteriorly in 92, laterally in 88, and inferiorly in 96 cases.
Angiography
Angiography in the 174 patients was performed in median 5 days (3–8) after the inclusion and recording of the ECG. The CASS score was 0 in 26 patients (14.9%), 1 in 84 patients (48.3%), 2 in 42 patients (24.1%), and 3 in 22 patients (12.6%). The HW score was in median 14.5 (6.5–25.5). The CASS score and HW score were significantly higher in groups with previous acute myocardial infarction, ejection fraction <45%, and troponin‐T values ≥ 0.1 ug/L (Table 4).
Table 4.
Coronary Stenosis Scores in Groups Dichotomized with Respect to Risk Factors
| CASS score (proportion of patients with score < 2) | HW‐score (median) | |||||
|---|---|---|---|---|---|---|
| No | Yes | P (Mann‐Whitney) | No | Yes | P (Mann‐Whitney) | |
| Previous AMI | 71% | 37% | <0.001 | 12 | 25 | <0.001 |
| EF < 45% | 66% | 33% | 0.01 | 14 | 22.75 | 0.02 |
| Troponin‐T ≥ 0.1 ug/L | 66% | 60% | 0.03 | 16 | 12.5 | 0.03 |
| Hyperlipidemia | 66% | 48% | 0.27 | 14 | 16.5 | >0.5 |
| Diabetes mellitus | 64% | 58% | 0.46 | 14.5 | 14.5 | >0.5 |
| Hypertension | 67% | 56% | 0.38 | 14 | 15.25 | 0.39 |
| Male sex | 60% | 65% | >0.5 | 14.25 | 15.5 | >0.5 |
| QTDmean ≥ 40 ms | 63% | 63% | >0.5 | 15.5 | 13.5 | >0.5 |
No significant differences in QTdMean were detected between the patients grouped according to their CASS score (P = 0.34, Kruskal‐Wallis test). QTdMean showed no correlation with the HW‐score (Spearman's ρ=−0.08, P = 0.29). No significant difference in the CASS score or the HW score was seen between two groups dichotomized at QTdMean 40 ms (the median value in a material with unselected chest pain 34 ).
By the angiographic scoring outlined above, the HW score located the region of dominating coronary pathology anteriorly in 110 cases, laterally in 35 cases, and inferiorly in 29 cases. No significant relation could be shown between the region with dominating coronary pathology and the localization of QTdiffMean, computed either with or without the V1–V2 lead combination (κ=−0.018, P > 0.5 and κ=−0.067, P = 0.24, respectively) (see Table 5). Similar results were obtained for the comparison of localization of QTdiffMean with localization of the coronary pathology by the CASS score (κ=−0.057, P = 0.27 and κ= 0.08, P > 0.5 for QTdiffMean computed with and without V1–V2, respectively).
Table 5.
Localization of QTdiffMean Versus Region of Dominating Coronary Pathology
| Localization of QTdiffMeana | Localization of QTdiffMean (V1–V2 excluded)b | ||||||||
|---|---|---|---|---|---|---|---|---|---|
| Anterior | Lateral | Inferior | Total | Anterior | Lateral | Inferior | Total | ||
| Region of dominating coronary pathology by HW score | Anterior | 66 | 26 | 18 | 110 | 32 | 35 | 43 | 110 |
| Lateral | 27 | 6 | 2 | 35 | 12 | 13 | 10 | 35 | |
| Inferior | 16 | 10 | 3 | 29 | 10 | 10 | 9 | 29 | |
| Total | 109 | 42 | 23 | 174 | 54 | 58 | 62 | 174 | |
a κ=−0.067, P = 0.24. bκ=−0.018, P > 0.5.
Subgroup Analysis
A subpopulation with the coronary pathology mainly confined to one region was selected by examining the patients with CASS score of 1 (84 patients). No significant relation could be shown between the region with dominating coronary pathology and the localization of QTdiffMean in this group. A subpopulation with a clinically more aggressive coronary artery disease was selected by focusing on the 68 patients initially randomized to the noninvasive strategy but undergoing coronary angiography due to clinical indication. No significant relation could be shown between the region with dominating coronary pathology and the localization of QTdiffMean in this group. After dichotomization with respect to the risk factors (from Table 3), the median QTdMean was significantly greater for the 32 patients with troponin‐T ≥ 0.1 ug/L when compared to the 34 patients with troponin‐T < 0.1 ug/L (64 vs 48 ms and 59 vs 39 ms, P = 0.011 and P = 0.018, Mann‐Whitney, for calculations with and without V1–V2, respectively; two patients missing).
DISCUSSION
We have shown that the differences in QT underlying the QT dispersion for a given patient are not equally distributed across the measured leads. Instead, a localized difference in QT between adjacent leads stands for about three fourths of the QT dispersion. This would in itself be consistent with local factors causing QTd. Our attempt to connect the localized electrocardiographical measure to the angiographical localization was, however, unsuccessful. This is in line with the unsuccessful attempt of Shimizu et al. to relate QT dispersion to scintigraphically quantified regional cardiac sympathetic nerve activity. 23 The findings make a local mechanism less probable as an explanation for QTd. The distribution of the QT durations over the ECG leads is known to be asymmetrical with V1 diverging from the others. It exhibits most frequently the shortest QT interval and smallest t‐wave amplitude, making it more liable to measurement error. 20 , 35 We therefore performed the computations on all available ECG leads in each satisfactory recording, as well as on a restricted set where the V1‐lead and the V1–V2 combination were excluded. Our observation that the QT dispersion relates moderately to the longest but not to the shortest QT in an individual patient is in accordance with previously published data. 7 , 36 The automatically measured QTdMean has in a previous study by our group been related to the outcome in patients with unselected chest pain. 34 In comparison, the current material exhibited a significantly higher QTdMean (median 55 vs 40 ms, P < 0.001). It was comparable to the mentioned material with unselected chest pain in median age (66 vs 67 years), prevalence of diabetes (14% vs 16%), hypertension (32% vs 37%), and previous myocardial infarctions (26% vs 28%) whereas the mortality in the current material was somewhat lower (3% vs 4%). The large difference in QTdMean does not thus seem to relate to the current patients being generally sicker. However, the present study included only patients with ischemic heart disease, with a great majority exhibiting ST depression on admission, whereas about half of the patients in the previous study did not have acute ischemic heart disease. Furthermore, the dichotomized QTdMean lost its prognostic power when it was adjusted for ST‐T changes on admission ECG.
LIMITATIONS
It is exceedingly difficult to construct a scoring scheme that adequately quantifies the severity and anatomical localization of coronary pathology. Two different algorithms were, therefore, used. Our approach will still be crude and for an individual patient error‐prone due to the large normal anatomical variability. The relation between a repolarization abnormality of the myocardium and stenotic changes or measures of flow in the supplying coronary arteries is complex. The ischemic area is not always identical with an anatomical extrapolation from the angiogram. The definition of the regions based on the schematic coronary angiogram may significantly differ from the definition of the regions as seen from the ECG. Thus, a local mechanism may still be active although it may not directly correspond to the coronary pathology as we quantify it. Averaging a large number of automatically analyzed ECG recordings is a powerful approach but it also means that any possible time‐related information will remain uncovered. We have previously addressed this issue. 34 The current analysis was performed in a retrospective manner, although the data collection was done prospectively in a large study and consecutive eligible patients were analyzed.
In conclusion, it seems that QT dispersion in ischemia is increased by a mechanism unrelated to localization and severity of coronary disease as reflected in risk factors (Table 3) and viewed by angiography (Table 5). From our, and others’ work it seems that the measure is an indicator of future risk. The clinical value of the measure for stratification of broad populations will, however, remain restricted. The limitations are inherent in its properties and will probably not be removed by the development of better measurement methods.
REFERENCES
- 1. Dilaveris P, Andrikopuolos G, Metaxas G, et al. Effects of ischemia on QT dispersion during spontaneous anginal episodes. J Electrocardiol 1999;32: 199–206. [PubMed] [Google Scholar]
- 2. Michelucci A, Padeletti L, Frati M, et al. Effects of ischemia and reperfusion on QT dispersion during coronary angioplasty. Pacing Clin Electrophysiol 1996;19: 1905–1908. [DOI] [PubMed] [Google Scholar]
- 3. Stierle U, Giannitsis E, Sheikhzadeh A, et al. Relation between QT dispersion and the extent of myocardial ischemia in patients with three‐vessel coronary artery disease. Am J Cardiol 1998;81: 564–568. [DOI] [PubMed] [Google Scholar]
- 4. Yunus A, Gillis AM, Traboulsi M, et al. Effect of coronary angioplasty on precordial QT dispersion. Am J Cardiol 1997;79: 1339–1342. [DOI] [PubMed] [Google Scholar]
- 5. Koide Y, Yotsukura M, Tajino K, et al. Use of QT dispersion measured on treadmill exercise electrocardiograms for detecting restenosis after percutaneous transluminal coronary angioplasty. Clin Cardiol 1999;22: 639–648. [DOI] [PMC free article] [PubMed] [Google Scholar]
- 6. Glancy JM, Garratt CJ, De Bono DP. Dynamics of QT dispersion during myocardial infarction and ischaemia. Int J Cardiol 1996;57: 55–60. [DOI] [PubMed] [Google Scholar]
- 7. Chauhan VS, Tang AS. Dynamic changes of QT interval and QT dispersion in non‐Q‐wave and Q‐wave myocardial infarction. J Electrocardiol 2001;34: 109–117. [DOI] [PubMed] [Google Scholar]
- 8. Moreno FL, Villanueva T, Karagounis LA, et al. Reduction in QT interval dispersion by successful thrombolytic therapy in acute myocardial infarction. TEAM‐2 Study Investigators. Circulation 1994;90: 94–100. [DOI] [PubMed] [Google Scholar]
- 9. Mirvis DM. Spatial variation of QT intervals in normal persons and patients with acute myocardial infarction. J Am Coll Cardiol 1985;5: 625–631. [DOI] [PubMed] [Google Scholar]
- 10. Franz MR, Zabel M. Electrophysiological basis of QT dispersion measurements. Prog Cardiovasc Dis 2000;42: 311–324. [DOI] [PubMed] [Google Scholar]
- 11. Zabel M, Portnoy S, Franz MR. Electrocardiographic indexes of dispersion of ventricular repolarization: An isolated heart validation study. J Am Coll Cardiol 1995;25: 746–752. [DOI] [PubMed] [Google Scholar]
- 12. Zabel M, Lichtlen PR, Haverich A, et al. Comparison of ECG variables of dispersion of ventricular repolarization with direct myocardial repolarization measurements in the human heart. J Cardiovasc Electrophysiol 1998;9: 1279–1284. [DOI] [PubMed] [Google Scholar]
- 13. Punske BB, Lux RL, MacLeod RS, et al. Mechanisms of the spatial distribution of QT intervals on the epicardial and body surfaces. J Cardiovasc Electrophysiol 1999;10: 1605–1618. [DOI] [PubMed] [Google Scholar]
- 14. Lux RL, Fuller MS, MacLeod RS, et al. QT interval dispersion: Dispersion of ventricular repolarization or dispersion of QT interval? J Electrocardiol 1998;30(Suppl.):176–180. [DOI] [PubMed] [Google Scholar]
- 15. Malik M, Acar B, Gang Y, et al. QT dispersion does not represent electrocardiographic interlead heterogeneity of ventricular repolarization. J Cardiovasc Electrophysiol 2000;11: 835–843. [DOI] [PubMed] [Google Scholar]
- 16. Kors JA, Van Herpen G, Van Bemmel JH. QT dispersion as an attribute of T‐loop morphology. Circulation 1999;99: 1458–1463. [DOI] [PubMed] [Google Scholar]
- 17. Rautaharju PM. QT and dispersion of ventricular repolarization: The greatest fallacy in electrocardiography in the 1990s. Circulation 1999;99: 2477–2478. [PubMed] [Google Scholar]
- 18. Coumel P, Maison‐Blanche P, Badilini F. Dispersion of ventricular repolarization: Reality? Illusion? Significance? Circulation 1998;97: 2491–2493. [DOI] [PubMed] [Google Scholar]
- 19. Macfarlane PW, McLaughlin SC, Rodger JC. Influence of lead selection and population on automated measurement of QT dispersion. Circulation 1998;98: 2160–2167. [DOI] [PubMed] [Google Scholar]
- 20. Lee KW, Kligfield P, Okin PM, et al. Determinants of precordial QT dispersion in normal subjects. J Electrocardiol 1998;31(Suppl.):128–133. [DOI] [PubMed] [Google Scholar]
- 21. Lee KW, Kligfield P, Dower GE, et al. QT dispersion, T‐wave projection, and heterogeneity of repolarization in patients with coronary artery disease. Am J Cardiol 2001;87: 148–151. [DOI] [PubMed] [Google Scholar]
- 22. Zabel M, Franz MR. The electrophysiological basis of QT dispersion: Global or local repolarization? Circulation 2000;101: E235–E236. [DOI] [PubMed] [Google Scholar]
- 23. Shimizu M, Ino H, Okeie K, et al. Increased QT dispersion does not reflect the increased regional variation of cardiac sympathetic nervous activity in hypertrophic cardiomyopathy. Am Heart J 2001;142: 358–362. [DOI] [PubMed] [Google Scholar]
- 24. FRISC II Investigators . Invasive compared with non‐invasive treatment in unstable coronary‐artery disease: FRISC II prospective randomised multicentre study. Lancet 1999;354: 708–715. [PubMed] [Google Scholar]
- 25. FRISC II Investigators . Long‐term low‐molecular‐mass heparin in unstable coronary‐artery disease: FRISC II prospective randomised multicentre study. FRagmin and Fast Revascularisation during InStability in Coronary artery disease. Lancet 1999;354: 701–707. [PubMed] [Google Scholar]
- 26. Xue Q, Reddy S. Algorithms for computerized QT analysis. J Electrocardiol 1998;30(Suppl.):181–186. [DOI] [PubMed] [Google Scholar]
- 27. Savelieva I, Yi G, Guo X, et al. Agreement and reproducibility of automatic versus manual measurement of QT interval and QT dispersion. Am J Cardiol 1998;81: 471–477. [DOI] [PubMed] [Google Scholar]
- 28. Gang Y, Guo XH, Crook R, et al. Computerised measurements of QT dispersion in healthy subjects. Heart 1998;80: 459–466. [DOI] [PMC free article] [PubMed] [Google Scholar]
- 29. Benn M, Hansen PS, Pedersen AK. QT dispersion in patients with arrhythmogenic right ventricular dysplasia. Eur Heart J 1999;20: 764–770. [DOI] [PubMed] [Google Scholar]
- 30. Austen WG, Edwards JE, Frye RL, et al. A reporting system on patients evaluated for coronary artery disease. Report of the Ad Hoc Committee for Grading of Coronary Artery Disease, Council on Cardiovascular Surgery, American Heart Association. Circulation 1975;51: 5–40. [DOI] [PubMed] [Google Scholar]
- 31. Principal Investigators of CASS . The National Heart, Lung, and Blood Institute Coronary Artery Surgery Study (CASS). Circulation 1981;63: 1–39.7002358 [Google Scholar]
- 32. Gensini GG. A more meaningful scoring system for determining the severity of coronary heart disease. Am J Cardiol 1983;51: 606. [DOI] [PubMed] [Google Scholar]
- 33. Sullivan DR, Marwick TH, Freedman SB. A new method of scoring coronary angiograms to reflect extent of coronary atherosclerosis and improve correlation with major risk factors. Am Heart J 1990;119: 1262–1267. [DOI] [PubMed] [Google Scholar]
- 34. Kesek M, Jernberg T, Lindahl B, et al. QT dispersion measured by an automatic continuous method early in patients admitted for chest pain. Int J Cardiol 2002; In press. [DOI] [PubMed] [Google Scholar]
- 35. Glancy JM, Garratt CJ, Woods KL, et al. Use of lead adjustment formulas for QT dispersion after myocardial infarction. Br Heart J 1995;74: 676–679. [DOI] [PMC free article] [PubMed] [Google Scholar]
- 36. Krahn AD, Nguyen‐Ho P, Klein GJ, et al. QT dispersion: An electrocardiographic derivative of QT prolongation. Am Heart J 2001;141: 111–116. [DOI] [PubMed] [Google Scholar]