

Abstract
Ventricular repolarization properties are dependent on cardiac cycle length. The aim of this article is to emphasize the importance of taking into account heart rate influences on QT duration but also on current and future T‐wave morphology parameters. The relationship between QT interval duration and RR interval is a fundamental property of the myocardium that is impaired by the presence of channelopathies such as the LQTS or SQTS, but also by the presence of a cardiomyopathy. Assessing this property is also important when the individual QT/RR relationship is used for individual QT correction in the setting of evaluation of drugs' effect on QT duration. T‐wave descriptors such as the relative weight of the terminal part of the T‐wave, the amplitude of T‐wave apex and Principal Component Analysis parameters are also dependent on heart rate. Assessing ventricular repolarisation ECG parameters at different heart rates avoids the need for difficult rate‐correction and helps to better understand and characterize ventricular repolarisation properties.
Keywords: ECG, ventricular repolarization, heart rate
As the expression of transmembrane ionic currents' gating properties, ventricular repolarization properties are fundamentally dependent on cardiac cycle length. This rate dependency has been long recognized and documented in both experimental and clinical settings. 1 , 2
Many efforts have been deployed attempting to normalize QT duration (the clinical counterpart of ventricular repolarization duration) to permit comparisons between or within subjects. The “universal” (i.e., valid for any individual) and population‐specific correction formulae have been however discredited. 3 , 4 , 5 , 6 , 7 , 8 Since the relationship between heart rate (HR) and QT duration has been shown to be highly individual, the current best strategy for HR correction is to use a subject‐specific correction formula. 8 Nevertheless, even this best available approach may be biased by physiologic or drug‐induced changes in the individual QT/RR relationship and is thus inherently associated with an imprecision in the HR‐correction process. 9
Another approach, based on comparisons at identical HR, was proposed to avoid the need for any HR‐correction formula. 10 , 11 , 12 , 13 The Holter‐based so‐called rate bin approach had been originally developed by our group to better characterize the relationship between HR and QT durations. 14 , 15 , 16 The rate binning is now a fully automatic method from Holter recordings intended to classify individual cardiac complexes of sinus origin according to the value of the preceding RR interval (RR‐1). Cardiac complexes with identical HR are subsequently averaged (i.e., included in the RR bin). The rate binning method has been detailed elsewhere 17 , 18 (Fig. 1).
Figure 1.
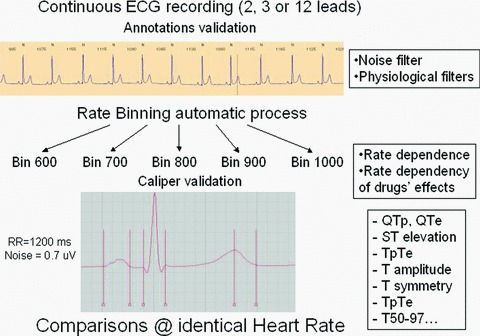
The binning method: Averaging by rate may be used for comparison of any repolarization biomarker at identical HR thus avoiding the need for HR correction.
The aim of this article is to underline the added value of the rate binning approach in evaluating HR influences on QT duration evaluation, but also on current and future T‐wave morphology parameters in the setting of drug‐induced QT changes and channelopathies.
QT DURATION
The rate bin method may serve as the first step to define the QT rate dependence from Holter recordings. This methode has been successfully applied to demonstrate ventricular repolarization malfunction observed in the long QT syndrome (LQTS), short QT syndrome as well as after myocardial infarction 15 , 19 , 20 , 21 , 22 (Fig. 2). This method has also proved useful for the evaluation of drug‐induced QT changes. In a previous study, the direct Holter‐based rate bin QT interval measurement method was applied to assess drug effects on the QT interval. Using a positive control arm, the study showed that the Holter bin method is able to detect a 5‐ms drug‐induced QT interval change, thus demonstrating its sensitivity. 12 This approach is thus reliable and not hampered by the intrinsic discrepancies associated with the subject‐specific approach, although it may be associated with a loss of the time track of QT changes. 9 , 12 Furthermore, the rate binning approach shows two important advantages.
Figure 2.
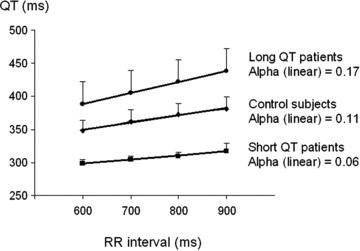
QT rate dependence in healthy subjects, asymptomatic long QT patients, and short QT patients. Adapted from Extramiana et al. 22 and personal data.
First, assessing QT changes at different HRs allows us to evidence th rate dependency of the QT changing process. For instance, the rate bin method is able to emphasize the influence of HR on drug's effect. Previous studies have shown that strong but also weak IKr blockers (i.e., sotalol and moxifloxacin, respectively) induce a more pronounced QT prolongation at slow compared to fast HRs. 9 , 12 , 23 This phenomenon known as the “reverse rate‐dependent effect” has been long recognized with class III antiarrhythmic drugs. 24 , Figure 3 shows a typical example of the reverse rate‐dependent effect observed with the weak IKr blocker moxifloxacin.
Figure 3.
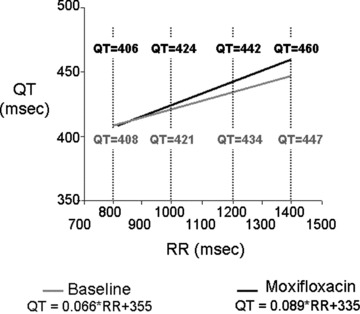
QT–RR relationship using the linear model under baseline condition (gray line) and after moxifloxacin (black line). The values of the QT interval duration at RR = 800, 1000, 1200, and 1400 ms are indicated above the curves on moxifloxacin and below the curves under baseline condition (with permission from Extramiana et al. 23 ).
Second, the rate binning method is flexible and the binning process may be adjusted by adding additional averaging filters. For instance, a noise filter can be set to reject noisy QRS‐T complexes and the minimal number of QRS‐T complexes defining a template may also be selected to improve the signal‐to‐noise ratio. More critically, it is also possible to implement selective filters to better take into account fundamental ventricular repolarization kinetics properties, as for instance, the hysteresis phenomenon. Following an abrupt change in HR, the QT adaptation is not immediate but achieved within a 3‐minute time frame although most QT adaptation occurs over the first minute. 2 , 25 , 26 As a consequence, QT interval measurement performed just after a sudden HR change would lead to a potential instability in the estimation of QT duration (i.e., an underestimation after HR deceleration and overestimation after HR acceleration) when compared to stable HR conditions. Using the rate binning method, it is possible to select QRS‐T complexes not only on their preceding RR interval but also according to HR stability during a predefined preceding period, thus excluding abrupt RR interval changes from the analysis. Such tools may be of interest since we have shown in a previous study that the exclusion of rapid HR changes slightly influences the results of the magnitude of drug‐induced QT changes in healthy subjects. 27 , Figure 4 shows that, when applying our stability filter, the percentage of rejected beats was correlated with the HR variability parameter PNN50. Oppositely, focusing on abrupt RR interval changes could allow clinicians to track postpause QT prolongation. 28
Figure 4.
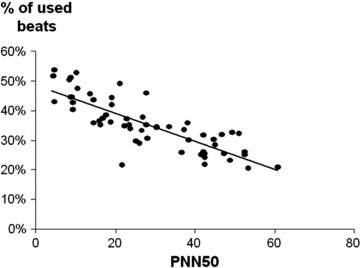
Percentage of QRS‐T complexes not excluded by using the stability filter according to the PNN50.
An intrinsic limitation of the bin method in the setting of QT duration changes evaluation is represented by the impossibility of QT comparisons when there are no overlapped RR intervals. This might be the case with drugs that dramatically change HR, although it is very unlikely provided that the QT comparison might be performed at any HR (i.e., not necessarily at RR = 1000 ms). Another, more significant drawback is that the averaging process leads to a complete loss of the time course of drug effect. Consequently, the largest time‐matched mean difference between the drug and placebo cannot be assessed.
Nevertheless, the rate bin method may be a useful tool for QT duration evaluations when a precise temporal assessment is not required.
T‐WAVE MORPHOLOGY
Although current guidelines on the proarrhythmic potential of a drug as well as LQTS diagnosis are based on QT prolongation, 29 , 30 there is a poor understanding of the relation between QT prolongation and clinical risk of proarrhythmia. We lack predictive biomarkers to improve our approach of the pathway leading to torsades de pointes. 31 , 32 Thus, there is a growing interest for other parameters than the crude QT interval duration. 33
However, morphology parameters have also shown to be rate dependent and their clinical use may also warrant rate correction. Moreover, the impairment of the rate dependence of the relative weight of the terminal part of the T wave may be a feature associated with symptoms in the type 1 LQTS (Fig. 5). 22 T‐wave amplitude, as well, shows a noticeable rate dependency in healthy subjects (unpublished data, Fig. 6). In addition, channel blocking drugs and LQTS are also associated with rate‐dependent changes in T‐wave morphology parameters. 34 , 35
Figure 5.
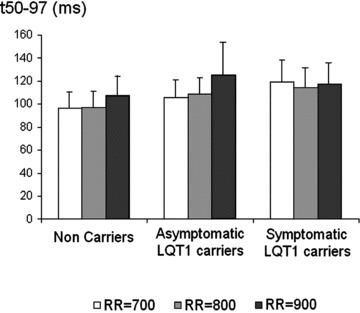
The lack of shortening of the time to accumulate the last 50% of T‐wave area (t50–97) with HR acceleration is associated with the presence of symptoms in the type 1 long QT syndrome (adapted from Extramiana et al. 22 ).
Figure 6.
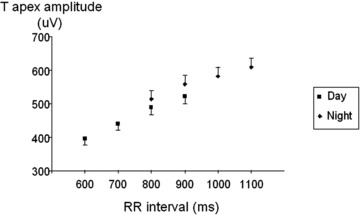
Diurnal and nocturnal rate dependence of T apex amplitude in healthy subjects (personal data, n = 62 mean ± SEM).
Similarly, in the Brugada syndrome, ST segment elevation displays a rate dependency in accordance with prediction from Ito kinetics and experimental models of Brugada syndrome ECG morphology (Fig. 7). 36 Again this feature could be demonstrated using the rate binning approach.
Figure 7.
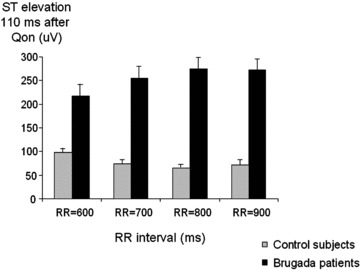
Rate dependency of ST segment elevation in Brugada patients and control subjects (adapted from Extramiana et al. 36 ).
More recent descriptors of ventricular repolarization such as those obtained from principal component analysis have also been shown to be rate dependent. 37 , 38 Unless a binning approach is performed, these new biomarkers would imply the development of rate correction formula before being usable in clinical practice.
INFLUENCE OF T‐WAVE MORPHOLOGY ON QT DURATION ASSESSMENT
The standard approach to determine the end of the T wave was based on the tangent method, which estimates the end of the T wave as the point of intersection between the calculated baseline and the tangent to the maximum down slope of the T wave. 39 This so‐called tangent method improved the reproducibility in QT duration assessment but it is sensitive to the amplitude and morphology of the T wave. 40 It is noteworthy that the slope of the tangent line is statistically significantly shallower after repeated dosing on moxifloxacin compared to placebo thus leading to a potential overestimation of QT duration (data presented by BioMedicalSystems at the DIA meeting held in Washington, DC on April 2007). Oppositely, steeper down slopes such as observed in the short QT syndrome may be associated with shorter QT duration assessment.
In addition, since both T‐wave morphology and amplitude are dependent on HR, HR will introduce an additional confounding factor in T‐offset assessment.
The development of computerized electrocardiography has given the opportunity to use more sophisticated algorithms such as those based on T‐wave down slope, its first or second derivative or a fixed percentage of T‐wave area. 36 , 41 Whatever the method used, computerized parameters would remain somewhat dependent on T‐wave morphology and/or amplitude.
By making comparisons at identical HR, the rate binning would at least compensate for such a rate‐dependent effect.
CONCLUSIONS
Because ventricular repolarization properties are dependent on the cycle length, it seems intuitive to assess ECG derived ventricular repolarization parameter at different HRs. The rate binning approach is fully automatic, easy to implement from long‐term ECG recordings. This method avoids the need for complex rate corrections for the crude QT interval but also for any current or future ECG biomarkers. It is also a quantitative ECG tool that helps to better understand ventricular repolarization properties in both drugs/repolarization interaction and channelopathies/cardiomyopathies settings.
Conflicts of Interest: None.
REFERENCES
- 1. Bazett HC. An analysis of the time relationship of electrocardiograms. Heart 1920;7:353–370. [Google Scholar]
- 2. Franz MR, Swerdlow CD, Liem LB, et al Cycle length dependence of human action potential duration in vivo: Effects of single extrastimuli, sudden sustained rate acceleration and deceleration, and different steady state frequency. J Clin Invest 1988;82:972–979. [DOI] [PMC free article] [PubMed] [Google Scholar]
- 3. Funck‐Brentano C, Jaillon P. Rate‐corrected QT interval: Techniques and limitations. Am J Cardiol 1993;72:17B–22B. [DOI] [PubMed] [Google Scholar]
- 4. Malik M. Problems of heart rate correction in assessment of drug‐induced QT interval prolongation. J Cardiovasc Electrophysiol 2001;12:411–420. [DOI] [PubMed] [Google Scholar]
- 5. Franz MR. Time for yet another QT correction algorithm? Bazett and beyond. J Am Coll Cardiol 1994;23:1554–1556. [DOI] [PubMed] [Google Scholar]
- 6. Haverkamp W, Breithardt G, Camm AJ, et al The potential for QT prolongation and proarrhythmia by non‐antiarrhythmic drugs: Clinical and regulatory implications. Report on a policy conference of the European Society of Cardiology. Eur Heart J 2000;21:1216–1231. [DOI] [PubMed] [Google Scholar]
- 7. Hnatkova K, Malik M. “Optimum” formulae for heart rate correction of the QT interval. PACE 1999;22:1683–1687. [DOI] [PubMed] [Google Scholar]
- 8. Malik M, Farbom P, Batchvarov V, et al Relation between QT and RR intervals is highly individual among healthy subjects: Implications for heart rate correction of the QT interval. Heart 2002;87:220–228. [DOI] [PMC free article] [PubMed] [Google Scholar]
- 9. Extramiana F, Badilini F, Sarapa N, et al Contrasting time and rate based approaches for the assessment of drug‐induced QT changes. J Clin Pharmacol 2007;47:1129–1137. [DOI] [PubMed] [Google Scholar]
- 10. Browne KF, Prystowsky E, Heger JJ, et al Prolongation of the QT interval in man during sleep. Am J Cardiol 1983;52:55–59. [DOI] [PubMed] [Google Scholar]
- 11. Rautaharju PM, Zhang ZM. Linearly scaled, rate‐invariant normal limits for QT interval: Eight decades of incorrect application of power functions. J Cardiovasc Electrophysiol 2002;13:1211–1218. [DOI] [PubMed] [Google Scholar]
- 12. Extramiana F, Maison‐Blanche P, Cabanis MJ, et al Clinical assessment of drug‐induced QT prolongation when associated with heart rate changes. Clin Pharmacol Ther 2005;77:247–258. [DOI] [PubMed] [Google Scholar]
- 13. Indik JH, Pearson EC, Fried K, et al Bazett and Fridericia QT correction formulae interfere with measurement of drug‐induced changes in QT interval. Heart Rhythm 2006;3:1003–1007. [DOI] [PubMed] [Google Scholar]
- 14. Extramiana F, Maison‐Blanche P, Badilini F, et al Circadian modulation of QT rate dependence in healthy volunteers. J Electrocardiol 1999;32:33–43. [DOI] [PubMed] [Google Scholar]
- 15. Extramiana F, Neyroud N, Huikuri HV, et al QT interval and arrhythmic risk assessment after myocardial infarction. Am J Cardiol 1999;83:266–269. [DOI] [PubMed] [Google Scholar]
- 16. Extramiana F, Maison‐Blanche P, Tavernier R, et al Cardiac effects of chronic oral beta‐blockade: Lack of agreement between heart rate and QT interval changes. Ann Noninvasive Electrocardiol 2002;7:379–388. [DOI] [PMC free article] [PubMed] [Google Scholar]
- 17. Badilini F, Maison‐Blanche P, Childers R, et al QT interval analysis on ambulatory electrocardiogram recordings: A selective beat averaging approach. Med Biol Eng Comput 1999;37:71–79. [DOI] [PubMed] [Google Scholar]
- 18. Badilini F, Maison‐Blanche P. Holter monitoring for QT: The RR bin method in depth In Morganroth J, Gussak I. (eds.): Cardiac Safety of Noncardiac Drugs. Practical Guidelines for Clinical Research and Drug Development. New Jersey , Humana Press Totowa, 2004. [Google Scholar]
- 19. Merri M, Moss AJ, Benhorin J, et al Relation between ventricular repolarization duration and cardiac cycle length during 24‐hour Holter recordings. Findings in normal patients and patients with long QT syndrome. Circulation 1992;85:1816–1821. [DOI] [PubMed] [Google Scholar]
- 20. Emori T, Ohe T, Aihara N, et al Dynamic relationship between the Q‐aT interval and heart rate in patients with long QT syndrome during 24‐hour Holter ECG monitoring. Pacing Clin Electrophysiol 1995;18:1909–1918. [DOI] [PubMed] [Google Scholar]
- 21. Neyroud N, Maison‐Blanche P, Denjoy I, et al Diagnostic performance of QT interval variables from 24‐h electrocardiography in the long QT syndrome. Eur Heart J 1998;19:158–165. [DOI] [PubMed] [Google Scholar]
- 22. Extramiana F, Denjoy I, Badilini F, et al Heart rate influences on repolarization duration and morphology in symptomatic and asymptomatic KCNQ1 mutation carriers. Am J Cardiol 2005;95:406–409. [DOI] [PubMed] [Google Scholar]
- 23. Extramiana F, Maison‐Blanche P, Badilini F, et al Individual QT/RR relationship: Average stability over time does not rule out an individual residual variability. Implication for the assessment of drug effect on the QT interval. Ann Noninvasive Electrocardiol 2005;10:169–178. [DOI] [PMC free article] [PubMed] [Google Scholar]
- 24. Hondeghem LM, Snyders DJ. Class III antiarrhythmic agents have a lot of potential but a long way to go. Reduced effectiveness and dangers of reverse use dependence. Circulation 1990;81:686–690. [DOI] [PubMed] [Google Scholar]
- 25. Seed WA, Noble MI, Oldershaw P, et al Relation of human cardiac action potential duration to the interval between beats: Implications for the validity of rate corrected QT interval (QTc). Br Heart J 1987;57:32–37. [DOI] [PMC free article] [PubMed] [Google Scholar]
- 26. Lau CP, Freedman AR, Fleming S, et al Hysterisis of ventricular paced QT interval in response to abrupt changes in pacing rate. Cardiovasc Res 1988;22:67–72. [DOI] [PubMed] [Google Scholar]
- 27. Extramiana F, Maison‐Blanche P, Haggui A, et al Control of rapid heart rate changes for ECG analysis: Implications for thorough QT studies. Clin Cardiol 2006;29:534–539. [DOI] [PMC free article] [PubMed] [Google Scholar]
- 28. Viskin S, Alla SR, Barron HV, et al Mode of onset of torsade de pointes in congenital long QT syndrome. J Am Coll Cardiol 1996;28:1262–1268. [DOI] [PubMed] [Google Scholar]
- 29. International Conference on Harmonization (ICH) . E14 Clinical Evaluation of QT/QTc Interval Prolongation and Proarrhythmic Potential for Non‐Antiarrhythmic Drugs. Available at: http://www.fda.gov/cder/guidance/6922fnl.pdf. [PubMed]
- 30. Schwartz PJ, Moss AJ, Vincent GM, et al Diagnostic criteria for the long QT syndrome: An update. Circulation 1993;88:782–784. [DOI] [PubMed] [Google Scholar]
- 31. Vos MA, Van Opstal JM, Leunissen JD, et al Electrophysiologic parameters and predisposing factors in the generation of drug‐induced Torsade de Pointes arrhythmias. Pharmacol Ther 2001;92:109–122. [DOI] [PubMed] [Google Scholar]
- 32. Redfern WS, Carlsson L, Davis AS, et al Relationships between preclinical cardiac electrophysiology, clinical QT interval prolongation and torsade de pointes for a broad range of drugs: Evidence for a provisional safety margin in drug development. Cardiovasc Res 2003;58:32–45. [DOI] [PubMed] [Google Scholar]
- 33. Benhorin J, Merri M, Alberti M, et al Long QT syndrome. New electrocardiographic characteristics. Circulation 1990;82:521–527. [DOI] [PubMed] [Google Scholar]
- 34. Smetana P, Pueyo E, Hnatkova K, et al Effect of amiodarone on the descending limb of the T wave. Am J Cardiol 2003;92:742–746. [DOI] [PubMed] [Google Scholar]
- 35. Vaglio M, Couderc JP, McNitt S, et al A quantitative assessment of T‐wave morphology in LQT1, LQT2, and healthy individuals based on Holter recording technology. Heart Rhythm 2008;5:11–18. [DOI] [PubMed] [Google Scholar]
- 36. Extramiana F, Seitz J, Maison‐Blanche P, et al Quantitative assessment of ST segment elevation in Brugada patients. Heart Rhythm 2006;3:1175–1181. [DOI] [PubMed] [Google Scholar]
- 37. Smetana P, Batchvarov VN, Hnatkova K, et al Ventricular gradient and nondipolar repolarization components increase at higher heart rate. Am J Physiol Heart Circ Physiol 2004;286:H131–H136. [DOI] [PubMed] [Google Scholar]
- 38. Extramiana F, Haggui A, Maison‐Blanche P, et al Principal Component Analysis of the T wave is reproducible and is not dependent on T‐offset position. Ann Noninvasive Electrocardiol 2007;12:354–363. [DOI] [PMC free article] [PubMed] [Google Scholar]
- 39. Lepeschkin E, Surawicz B. The measurement of the Q‐T interval of the electrocardiogram. Circulation 1952;6:378–388. [DOI] [PubMed] [Google Scholar]
- 40. Xue Q, Reddy S. Algorithms for computerized QT analysis. J Electrocardiol 1998;30:181–186. [DOI] [PubMed] [Google Scholar]
- 41. Badilini F, Sarapa N. Implications of methodological differences in digital electrocardiogram interval measurement. J Electrocardiol 2006;39:S152–S156. [DOI] [PubMed] [Google Scholar]