

Abstract
Background: Several ECG‐based approaches have been shown to add value when risk‐stratifying patients with congestive heart failure, but little attention has been paid to the prognostic value of abnormal atrial depolarization in this context. The aim of this study was to noninvasively analyze the atrial depolarization phase to identify markers associated with increased risk of mortality, deterioration of heart failure, and development of atrial fibrillation (AF) in a high‐risk population with advanced congestive heart failure and a history of acute myocardial infarction.
Methods: Patients included in the Multicenter Automatic Defibrillator Implantation Trial II (MADIT II) with sinus rhythm at baseline were studied (n = 802). Unfiltered and band‐pass filtered signal‐averaged P waves were analyzed to determine orthogonal P‐wave morphology (prespecified types 1, 2, and 3/atypical), P‐wave duration, and RMS20. The association between P‐wave parameters and data on the clinical course and cardiac events during a mean follow‐up of 20 months was analyzed.
Results: P‐wave duration was 139 ± 23 ms and the RMS20 was 1.9 ± 1.1 μV. None of these parameters was significantly associated with poor cardiac outcome or AF development. After adjustment for clinical covariates, abnormal P‐wave morphology was found to be independently predictive of nonsudden cardiac death (HR 2.66; 95% CI 1.41–5.04, P = 0.0027) and AF development (HR 1.75; 95% CI 1.10–2.79, P = 0.019).
Conclusion: Abnormalities in P‐wave morphology recorded from orthogonal leads in surface ECG are independently predictive of increased risk of nonsudden cardiac death and AF development in MADIT II patients.
Ann Noninvasive Electrocardiol 2010;15(1):63–72
Keywords: atrial electrophysiology, ischemic heart disease, ICD, atrial fibrillation, ECG
Although risk stratification and prediction of clinical outcome in patients with congestive heart failure (CHF) are traditionally based on a combination of demographical, clinical, electrophysiological, functional, and biochemical factors, 1 the ECG alone may serve as an important source of prognostic information. Several approaches from straightforward QRS width estimation or identification of subjects with cardiac arrhythmias, such as atrial fibrillation (AF) to more sophisticated computer‐based analyses, for example, estimations of T‐wave alternans and heart rate variability have been shown to add value when risk stratifying CHF patients. 2 However, little attention has been paid to the prognostic value of abnormal atrial depolarization in this context. Despite known associations between abnormal P‐wave morphologies and left atrial enlargement and overload in patients with CHF, prospective studies evaluating the possible link between P‐wave morphologies and the risk of death are lacking. Two reports published in the 1970s demonstrated the prognostic value of abnormal left atrial activation with respect to long‐term follow‐up, in patients surviving acute myocardial infarction. 3 , 4
A noninvasive ECG analysis tool that allows detailed description of P‐wave morphology has been developed that includes signal averaging of P waves and automatic classification of P‐wave morphology (PSA‐ECG). 5 Using this technique, we have identified P‐wave morphologies associated with a history of AF 6 as well as age‐related P‐wave changes in healthy individuals. 7 In a recent study, we demonstrated a significant link between different P‐wave morphologies and different patterns of interatrial conduction in patients with paroxysmal AF without structural heart disease. 8
The objective of this study was to analyze noninvasively the atrial depolarization phase to identify markers associated with increased risk of mortality, deterioration of heart failure, and development of AF in a high‐risk population with advanced CHF and a history of acute myocardial infarction who participated in the Multicenter Automatic Defibrillator Implantation Trial II (MADIT II). 9
METHODS
Study Population and Clinical Characteristics
The design and results of MADIT II have been reported elsewhere. 9 Briefly, the study included 1232 patients with documented ischemic heart disease (myocardial infarction over 1 month prior to enrolment) and ejection fraction ≤30%. Patients were randomized to ICD or conventional treatment in a 3:2 fashion. Patients were followed for a mean of 20 months. Exclusion criteria included existing ICD indications, New York Heart Association (NYHA) class IV (within the past 3 months), myocardial infarction within the past month, coronary revascularization within the past 3 months, and other advanced comorbidities. There were no requirements regarding baseline ECG rhythm in MADIT II, but for analyses purposes only patients in sinus rhythm were included in this study. Clinical and demographic data collected at enrolment included information regarding age, gender, race, body mass index, history of myocardial infarction, date of most recent myocardial infarction, hypertension, smoking, diabetes, prior revascularization procedures, and NYHA class. Data regarding medication, ejection fraction, blood pressure, and blood urea nitrogen (BUN) were also obtained at enrolment.
Study End Points
The primary end point of MADIT II was all‐cause mortality. 9 Secondary end points for this analysis included cardiac death, sudden and nonsudden (categorized as described by Greenberg et al.), 10 hospitalization for CHF, the combined end point of CHF hospitalization and all‐cause mortality, ICD efficacy, and finally the probability of AF development. Detection of AF during follow‐up was based on clinical evaluation supported by identification of AF on 12‐lead ECG.
Data Acquisition and Analysis
A 10‐minute high‐resolution (1 kHz) bipolar ECG recording (SpaceLab‐Burdick 6632 recorder, SpaceLab‐Burdick, Milton, WI, USA) was obtained at enrolment of the MADIT II patients. Data analysis was performed using custom‐made software running on MATLAB R2007a for Mac OS X (The MathWorks, Inc., Natick, MA, USA). Unfiltered, signal‐averaged P waves were analyzed to determine P‐wave morphology. 5 , 11 Following high‐pass (0.5 Hz) and band‐stop (50 Hz) filtering, the QRS complexes were automatically identified and grouped according to similarity (a cross‐correlation coefficient, ρ > 0.9). P waves were extracted using 250‐ms wide signal windows preceding each QRS complex. The signal windows were then shifted in time to estimate the maximal correlation in each lead. P waves with a cross‐correlation coefficient of ρ > 0.9 (analyzed separately in all leads) were grouped together and averaged. The actual P waves were defined by manual setting of the onset and end. The method used is described in detail elsewhere. 5 , 11
Using the previously extracted signal windows of similar morphology, additional band‐pass filtered signal‐averaged P‐wave analysis was performed. The vector magnitude (√(X2+ Y2+ Z2)) was calculated and band‐pass filtered using a bidirectional four‐pole Butterworth filter with 40 Hz high‐pass cutoff. Signal noise was measured as the root mean square (RMS) value of a 40‐ms interval in the TP segment of the filtered signal, 12 and P waves were added to the average until a noise level below 0.1 μV was obtained. If the noise level could not be obtained, the recording was discarded from this analysis. Onset and end of the band‐pass filtered vector magnitude was defined as the midpoint of 5‐ms segments where the RMS level exceeded the noise level plus three standard deviations. 12 If no point was found that fulfilled this criterion at the P‐wave end, the interval with the lowest RMS value in the PQ segment was used as end. P‐wave duration and the RMS value of terminal 20 ms of the P wave (RMS20) were analyzed.
Definitions
The P‐wave morphology was classified into one of three predefined classes (type 1: positive leads X and Y and negative lead Z; type 2: positive leads X and Y and biphasic lead Z(−/+); and type 3: positive lead X and biphasic signals in leads Y(+/−) and Z(−/+)) using an automatic algorithm. 5 P‐wave morphologies, compatible with block or delayed conduction in one or more of the interatrial conduction routes (i.e., type 2, type 3 or atypical), 8 are collectively denoted “abnormal P wave morphology” in the manuscript.
Statistics
Data are expressed as the mean ± standard deviation. The Mann‐Whitney U or Kruskall‐Wallis test was used to analyze unpaired data. The chi‐square test was used when analyzing nominal data. Kaplan‐Meier curves with log‐rank statistics were used to analyze time to end point events. Cox proportional hazards analyses were used to determine hazard ratios associated with abnormal P‐wave morphology. The estimated hazard ratios refer to the increased risk in each P‐wave morphology‐type step (i.e., from type 1 to 2 and from type 2 to 3/atypical). These analyses were adjusted for relevant baseline risk factors. All tests were two‐sided and P < 0.05 was considered statistically significant.
Results
Data Availability
At enrolment 912 (74%) of the 1232 patients were found to be in sinus rhythm, excluding patients with pacemaker rhythm and AF. Of the 912 patients in sinus rhythm 802 (88%) were found to have baseline ECG recordings of sufficient quality for further analysis. The results presented are based on this patient subset.
Clinical Characteristics and P‐Wave Morphology Distribution at Enrolment
Patient characteristics and P‐wave parameters at baseline are summarized in Table 1. Notably, only a small minority of the studied patients was on treatment with antiarrhythmic drugs. The measured P‐wave duration was prolonged compared to standard reference values regardless of measurement methodology (145 ± 19 ms and 139 ± 23 ms unfiltered and band‐pass filtered duration). Figure 1 illustrates the distribution of P‐wave morphology types in the entire population and typical morphological examples. A majority (60%) of the patients were exhibiting type 2 P‐wave morphology whereas only a 16% and 2% of the patients exhibited type 1 and type 3, respectively. Twenty‐two percent of the studied subjects had an atypical P‐wave morphology. Because of the low number of observed type 3 morphologies, these were analyzed together with the atypical P‐wave morphology for the subsequent analyses, after making sure that no relevant differences in baseline parameters existed between these groups (data not shown).
Table 1.
Clinical Characteristics in Study Population
| MADIT II Patients in SR at Baseline (n = 802) | ||
|---|---|---|
| Age | [Years] | 63 ± 10 |
| Male | [%] | 82 |
| History of atrial arr | [%] | 18 |
| Hypertension | [%] | 54 |
| Diabetes | [%] | 34 |
| BMI | [kg/m2] | 28 ± 5 |
| Systolic BP | [mmHg] | 122 ± 18 |
| Diastolic BP | [mmHg] | 71 ± 11 |
| BUN | [mg/dL] | 22 ± 11 |
| NYHA (I/II/III/IV) | [%] | (37/36/24/4) |
| LVEF | [%] | 23 ± 5 |
| Digitalis | [%] | 70 |
| Beta‐blocker | [%] | 64 |
| CCB | [%] | 13 |
| Sotalol | [%] | 1 |
| Class I AA | [%] | 3 |
| Amiodarone | [%] | 6 |
| Heart rate | [bpm] | 69 ± 14 |
| PWD unfiltered | [ms] | 145 ± 19 |
| PWD filtered | [ms] | 139 ± 23 |
| RMS20 | [μV] | 1.9 ± 1.1 |
| Type (1/2/3/atypical) | [%] | (16/60/2/22) |
AA = antiarrhythmic; Arr = arrhythmia; BMI = body mass index; BP = blood pressure; BUN = blood urea nitrogen; CCB = calcium channel blockers; LVEF = left ventricular ejection fraction; NYHA = New York Heart Association; PWD = P‐wave duration; SR = sinus rhythm.
Figure 1.
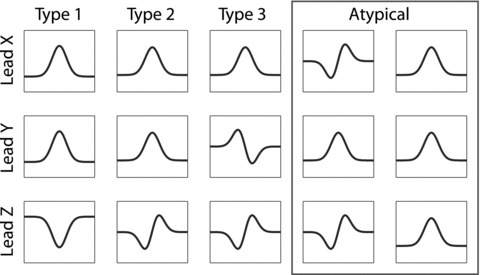
Schematic illustration of the three P‐wave morphology classes. Type 1 is characterized by a right‐to‐left (positive lead X), superior‐to‐inferior (positive lead Y) and posterior‐to‐anterior activation pattern (negative lead Z). Type 2 is also characterized by positive signals in lead X and Y, but the biphasic signal in lead Z indicates a more complex activation pattern (posterior‐to‐anterior‐to‐posterior). Type 3 P‐wave morphology also exhibits a positive signal in lead X, and a biphasic signal in lead Z, as does type 2, but the signal in lead Y reflects the retrograde activation of the left atrium (superior‐to‐inferior‐to‐superior). The two morphologies within the red rectangle are illustrations of two distinct patterns seen among the atypical P waves. The meaning of these patterns are yet to be elucidated.
Comparison of Baseline Clinical Characteristics and ECG Parameters Based on P‐Wave Morphology Classification
Table 2 summarizes the baseline clinical characteristics and ECG parameters based on P‐wave morphology classification. Overall, several baseline characteristics show evidence of a progressive worsening or increase from type 1 to type 2 and type 3/atypical (e.g., age, ejection fraction, heart rate, and QTc). Patients with type 3/atypical P‐wave morphology were less likely to be treated with beta‐blocking agents than other patients (P < 0.01). Neither P‐wave duration nor RMS20 was significantly different among the P‐wave morphology classifications.
Table 2.
Relation between P‐Wave Morphology and Clinical Characteristics
| Type 1 (n = 123) | Type 2 (n = 465) | Type 3/Atypical (n = 185) | P = | ||
|---|---|---|---|---|---|
| Age | [Years] | 61 ± 11 | 62 ± 10 | 64 ± 10 | 0.01 |
| Male | [%] | 84 | 82 | 84 | 0.78 |
| Hx of atrial arr | [%] | 13 | 17 | 19 | 0.38 |
| Hypertension | [%] | 48 | 54 | 55 | 0.42 |
| Diabetes | [%] | 27 | 36 | 34 | 0.19 |
| BMI | [kg/m2] | 28 ± 5 | 29 ± 5 | 28 ± 5 | 0.03 |
| Systolic BP | [mmHg] | 119 ± 17 | 123 ± 19 | 121 ± 18 | 0.03 |
| Diastolic BP | [mmHg] | 70 ± 10 | 71 ± 11 | 72 ± 11 | 0.37 |
| NYHA (I/II/III/IV) | [%] | (36/41/20/4) | (39/35/21/4) | (33/34/30/3) | 0.26 |
| LVEF | [%] | 25 ± 5 | 23 ± 5 | 22 ± 6 | <0.01 |
| Digitalis | [%] | 49 | 56 | 53 | 0.36 |
| Beta‐blocker | [%] | 65 | 68 | 52 | <0.01 |
| CCB | [%] | 10 | 14 | 12 | 0.52 |
| Sotalol | [%] | 0 | 1 | 1 | 0.68 |
| Class I AA | [%] | 1 | 3 | 5 | 0.11 |
| Amiodarone | [%] | 7 | 5 | 6 | 0.84 |
| Heart rate | [bpm] | 70 ± 15 | 71 ± 15 | 76 ± 16 | <0.01 |
| PWD unfiltered | [ms] | 145 ± 19 | 146 ± 16 | 146 ± 16 | 0.65 |
| PWD filtered | [ms] | 140 ± 19 | 138 ± 25 | 142 ± 17 | 0.42 |
| RMS20 | [μV] | 1.8 ± 1.2 | 1.9 ± 1.1 | 2.0 ± 1.1 | 0.19 |
| PQ interval | [ms] | 192 ± 30 | 195 ± 37 | 195 ± 35 | 0.97 |
| QRS duration | [ms] | 114 ± 30 | 114 ± 28 | 121 ± 31 | 0.02 |
| QT interval | [ms] | 414 ± 47 | 417 ± 55 | 412 ± 57 | 0.41 |
| QTc | [ms] | 436 ± 43 | 438 ± 42 | 441 ± 43 | <0.01 |
The Kruskall‐Wallis test was used to analyze unpaired data. The chi‐square test was used when analyzing nominal data. Bold P‐values indicate P < 0.05. AA = antiarrhythmic; Arr = arrhythmia; BMI = body mass index; BP = blood pressure; BUN = blood urea nitrogen; CCB = calcium channel blocker; Hx = history; LVEF = left ventricular ejection fraction; NYHA = New York Heart Association; PWD = P‐wave duration; SR = sinus rhythm.
P‐Wave Morphology and Development of AF
Abnormal P‐wave morphology was associated with an increased risk of AF development in the univariate model (P = 0.035). Figure 2 shows the Kaplan‐Meier analyses for P‐wave morphology type as an indicator of AF development risk. After adjusting for age, QRS duration, and treatment arm, the hazard ratio was found to be 1.75 (95% CI 1.10–2.79, P = 0.019). Table 3 shows the factors included in the Cox regression model for prediction of AF development and their corresponding hazard ratios. None of the other P‐wave parameters (i.e., P‐wave duration, RMS20) was found to be predictive of AF development, neither in univariate nor in multivariate analyses.
Figure 2.
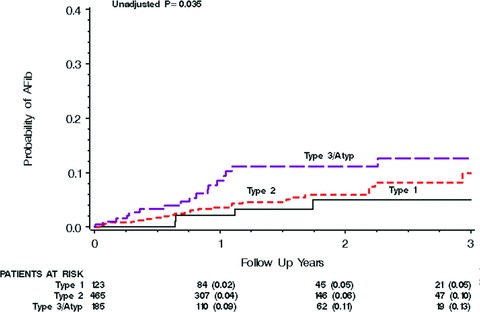
The Kaplan‐Meier graph for P‐wave morphology as a predictor of AF development. As illustrated by the curves there is a progressive and proportional increase in risk of AF development from type 1 to type 2 to type 3/atypical.
Table 3.
Cox Regression Analysis (Time to Atrial Fibrillation)
| Variables in the Equation | P Value | HR | 95% CI for HR | |
|---|---|---|---|---|
| Age | <0.01 | 1.74 | 1.27 | 2.38 |
| P‐wave morphology | 0.02 | 1.75 | 1.10 | 2.79 |
| Treatment arm | 0.85 | 0.95 | 0.53 | 1.69 |
| (ICD: conventional) | ||||
| QRS >120 ms | <0.01 | 2.67 | 1.44 | 4.93 |
The estimated hazard ratios refer to the increased risk of atrial fibrillation with increasing age (measured in 10‐year intervals), each P‐wave morphology type step (i.e., from type 1 to 2 and from type 2 to 3/atypical) and finally with ICD treatment and QRS duration exceeding 120 ms. CI = confidence interval; HR = hazard ratio.
Death and Heart Failure in Relation to P‐Wave Morphology
Abnormal P‐wave morphology was associated with an increased risk of cardiac death (P = 0.04) and nonsudden cardiac death (P = 0.001). The corresponding Kaplan‐Meier curves are shown in Figures 3B–C. Borderline significance was observed for increased risk associated with abnormal P‐wave morphology of all‐cause mortality (P = 0.077, Fig. 3A), CHF hospitalization (P = 0.098, Fig. 3E) and of the combined end point of CHF hospitalization or death (any cause) (P = 0.051, Fig. 3F), while the outcome analysis of sudden cardiac death was highly insignificant (P = 0.469, Fig. 3D).
Figure 3.
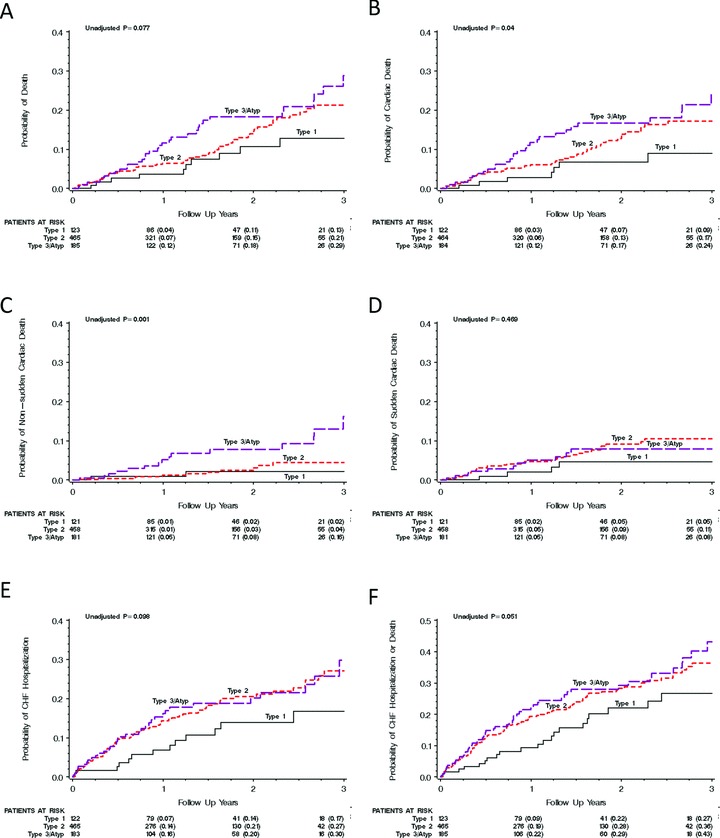
The Kaplan‐Meier graphs show the univariate association between the different P‐wave morphologies and all‐cause mortality (A); cardiac death (B); nonsudden cardiac death (C); sudden cardiac death (D); CHF hospitalization (E); and the combined end point of CHF hospitalization and cardiac death (F). Notably, for all analyzed variables (with sudden cardiac death as the one exception) the increase in risk seems to be highest for the type 3 or atypical P‐wave morphologies and lowest for the type 1 P‐wave morphology.
After adjustment for relevant covariates (i.e., ICD treatment, NYHA class, age at inclusion, QRS duration, increased BUN, and ejection fraction), abnormal P‐wave morphology was shown to be an independent predictor of nonsudden cardiac death (hazard ratio 2.66 [95% CI 1.41–5.04, P = 0.0027]). However, only trends were seen regarding the association of P‐wave morphology with cardiac death (hazard ratio 1.40 [95% CI 0.996–1.98, P = 0.052]), all‐cause mortality (hazard ratio 1.29 [95% CI 0.94–1.90, P = 0.12]), CHF hospitalization (hazard ratio 1.21 [95% CI 0.92–1.59, P = 0.18]), and CHF hospitalization or all‐cause mortality (hazard ratio 1.18 [95% CI 0.93–1.48, P = 0.17]). Abnormal P‐wave morphology was not shown to be predictive of sudden cardiac death in the multivariate regression model (hazard ratio 1.02 [95% CI 0.65–1.61, P = 0.93]). No association between P‐wave morphology and ICD efficacy was found (interaction P value 0.373 [univariate analysis] and 0.521 [multivariate analysis])
DISCUSSION
Noninvasive ECG analysis using PSA‐ECG in the MADIT II population demonstrated additional value of P‐wave morphology analysis for risk stratification of high‐risk patients with CHF, a history of myocardial infarction, markedly reduced left ventricular ejection fraction, and prolonged P‐wave duration. Abnormal P‐wave morphology patterns were shown to be independently predictive of risk for nonsudden cardiac death and the development of AF. Neither P‐wave duration nor RMS20 showed any value in the stratification of risk for these parameters in the MADIT II patients.
ECG‐Based Risk Stratification in Patients with Ischemic Heart Disease and CHF
Patients with advanced CHF and a history of myocardial infarction represent a high‐risk group in regard to the risk of sudden death. In spite of several known risk factors (e.g., AF development, QRS duration exceeding 120 ms, and the presence of frequent ventricular premature beats), 13 , 14 , 15 , 16 further risk stratification of patients with already known high‐risk of sudden cardiac death remains a major clinical challenge.
The interest in P‐wave morphology in this setting dates back to mid 1960s when Morris et al. introduced the concept of P‐wave negative terminal force (PTF) seen as a pronounced, negative deflection in the terminal portion of the P wave in right precordial leads in patients with known mitral or aortic valve disease. 17 In a registry‐based analysis of discharge ECGs of 641 patients who survived the acute phase of myocardial infarction, abnormal PTF (PTF > 0.03 mVs), observed in 11% of the patients, was associated with a nearly two‐fold increase in 5‐year mortality. 4 In another, smaller study, abnormal PTF was found to be the main predictor of poor prognosis at 4‐year follow‐up. 3 To the best of our knowledge, no other studies have evaluated the impact of P‐wave morphology on mortality in any other patient population since.
The PSA‐ECG method enables not only analysis of conventional parameters used for characterization of atrial depolarization (e.g., P‐wave duration and RMS20) but also automatic classification of P‐wave morphology in orthogonal leads that reflects the vector of atrial depolarization. 8 , 11 Our finding of an association between types 2 and 3 P‐wave morphology and clinical outcome in ischemic patients with CHF is in agreement with the historical data. Abnormal PTF in V1 is likely to represent the same electrocardiographic entity as a biphasic P‐wave morphology in lead Z with extreme, positive terminal deflection, that is, a subset of the type 2 P waves. However, there are several important differences; the automatic classification algorithm used in the PSA‐ECG analysis calculates the relative size of the positive and negative deflections of P wave and is therefore independent on the absolute values of P‐wave amplitude, which are likely to be affected by extracardiac factors. Moreover, the analysis enables characterization of the entire patient cohort, not limiting the applicability of the findings to the small minority of patients with the most prominent P‐wave abnormalities.
Substrate of Variable P‐Wave Morphology: Structural, Electrical, or Both?
The pathophysiological processes underlying the different P‐wave morphologies are still a matter of debate. Abnormal PTF was initially interpreted as a sign of left atrial overload. 3 , 4 , 17 Subsequent studies using echocardiography reported moderate specificity and poor sensitivity of abnormal PTF for detecting left atrial enlargement. 18 , 19 , 20 In a recent report using cardiovascular magnetic resonance, abnormal PTF was shown to be a highly specific but insensitive ECG sign of left atrial enlargement. 21 In a pathology study, abnormal PTF was shown to correlate with left atrial hypertrophy but was also observed in 22% subjects without atrial hypertrophy and 12% structurally normal hearts. 22
Interatrial conduction disturbance was suggested as possible cause of abnormal PTF in 1977. 23 This notion was later confirmed using invasive electrophysiological studies in patients with sick sinus syndrome and paroxysmal AF. 24 The high prevalence of biphasic P waves in right precordial leads in healthy subjects 7 , 25 gives further support to the hypothesis that primary electrical disturbance, at least in part, explains this electrocardiographic phenomenon. Using electroanatomical mapping, our group has reported a significant association between the different P‐wave morphologies and the pattern of left atrial activation during sinus rhythm suggesting that variations in anatomical structure or function of interatrial routes may explain differences in P‐wave morphologies, at least in patients without structural heart disease. 8 However, the structural changes in atrial myocardium associated with increasing age or advanced comorbidity, with secondary left atrial overload and dilatation, inevitably deteriorate the atrial conductive properties and may cause abnormal atrial activation reflected in prolonged P waves or changes in P‐wave morphology. Although no data on left atrial size were systematically collected in the MADIT II, the markedly reduced left ventricular ejection fraction in this patient cohort suggests that left atrial enlargement is likely to have contributed to the abnormal P‐wave morphology observed in many of the patients.
P‐Wave Morphology Distribution and Clinical Correlates in the MADIT II Population
Patients with CHF and a history of myocardial infarction meeting the MADIT II inclusion criteria comprise a population that has not yet been systematically studied with respect to electrocardiographic signs of abnormal atrial activation. In our earlier studies of P‐wave morphology, we have identified positive P waves in leads X and Y, combined with a negative P wave in lead Z (type 1) as a common findings in younger healthy subjects, while biphasic P waves in lead Z (type 2) dominate in elderly, and in patients with a history of AF or structural heart disease, such as hypertrophic cardiomyopathy. 6 , 7 , 26 The high prevalence of type 2 P waves in the MADIT II population is therefore not surprising. On the other hand, the high proportion of patients exhibiting atypical P‐wave morphologies in the studied population have not been reported earlier and may be due to advanced underlying cardiac conditions. Interestingly, progressive, though numerically modest, worsening of clinical characteristics (i.e., age, left ventricular ejection fraction, and heart rate) was observed when patients exhibiting type 1 P waves were compared with type 2 and type 3/atypical (Table 2) thus further supporting the theory that type 1 P waves reflect the “healthiest” cardiac substrate while type 2 and type 3/atypical may be seen as markers of more advanced disease and higher risk. Notably, no differences in P‐wave duration or RMS20 were identified between the different P‐wave morphologies.
P‐Wave Morphology and Clinical Outcome in MADIT II
In this study, P‐wave morphology was shown to be associated with several measures of clinical outcome, with sudden cardiac death being the major exception. The associations between P‐wave morphology and nonsudden cardiac death and P‐wave morphology and AF development were present even though the statistical model was adjusted for known outcome predictors (including AF development) and factors not evenly distributed between the different P‐wave morphologies.
Abnormal P‐wave morphology was found to be an independent predictor of AF development. Atrial conduction disturbances promote reentry, which in turn may facilitate the development of AF. 27 The association between the invasive or noninvasive evidence of atrial conduction delay in patients with a history of AF has been reported earlier. 28 , 29 However, there is a paucity of human data that would confirm that the conduction disturbance in patients with AF is a cause of AF rather than a consequence of the AF‐related electrical remodeling. Our findings of an association between the P‐wave morphology at baseline and AF development during follow‐up supports the primary role of disturbed atrial conduction for AF initiation. Interestingly, P‐wave duration, which in several earlier studies has been shown to be associated with a history of AF 28 , 29 was prolonged in all patients regardless of future AF development.
In this study, the value of analyzing the P‐wave morphology in patients with previous myocardial infarction and CHF is demonstrated. Certain P‐wave morphologies (types 2 and 3/atypical) were shown to be independently predictive of increased risk of nonsudden cardiac death and AF development. Neither P‐wave duration nor RMS20 showed any value in the stratification of risk for these parameters in the MADIT II patients.
Acknowledgments
Acknowledgments: This study was supported by governmental funding of clinical research within the Swedish NHS, Franke and Margareta Bergqvist foundation for the promotion of cancer research and The Royal Physiographic Society in Lund, Sweden. MADIT II was supported by an unrestricted grant from the Guidant Corporation to the University of Rochester Medical Center. There are no conflicts of interest to report.
REFERENCES
- 1. Hunt SA, Abraham WT, Chin MH, et al ACC/AHA 2005 Guideline update for the diagnosis and management of chronic heart failure in the adult: A report of the American College of Cardiology/American Heart Association Task Force on practice guidelines (Writing Committee to update the 2001 guidelines for the evaluation and management of heart failure): Developed in collaboration with the American College of Chest Physicians and the International Society for Heart and Lung Transplantation: Endorsed by the Heart Rhythm Society. Circulation 2005;112:e154–e235. [DOI] [PubMed] [Google Scholar]
- 2. Cowburn PJ, Cleland JG, Coats AJ, et al Risk stratification in chronic heart failure. Eur Heart J 1998;19:696–710. [DOI] [PubMed] [Google Scholar]
- 3. Kentala E, Pyorala K, Heikkila J, et al Factors related to long‐term prognosis following acute myocardial infarction. Importance of left ventricular function. Scand J Rehabil Med 1975;7:118–124. [PubMed] [Google Scholar]
- 4. Pohjola S, Siltanen P, Romo M. The prognostic value of the P wave morphology in the discharge ECG in a 5‐year follow‐up study after myocardial infarction. Am Heart J 1979;98:32–38. [DOI] [PubMed] [Google Scholar]
- 5. Holmqvist F, Havmoller R, Platonov P, et al Signal‐averaged P wave analysis for delineation of interatrial conduction – Further validation of the method. BMC Cardiovasc Disord 2007;7:29. [DOI] [PMC free article] [PubMed] [Google Scholar]
- 6. Platonov PG, Carlson J, Ingemansson MP, et al Detection of inter‐atrial conduction defects with unfiltered signal‐averaged P‐wave ECG in patients with lone atrial fibrillation. Europace 2000;2:32–41. [DOI] [PubMed] [Google Scholar]
- 7. Havmoller R, Carlson J, Holmqvist F, et al Age‐related changes in P wave morphology in healthy subjects. BMC Cardiovasc Disord 2007;7:22. [DOI] [PMC free article] [PubMed] [Google Scholar]
- 8. Holmqvist F, Husser D, Tapanainen JM, et al Interatrial conduction can be accurately determined using standard 12‐lead electrocardiography: Validation of P‐wave morphology using electroanatomic mapping in man. Heart Rhythm 2008;5:413–418. [DOI] [PubMed] [Google Scholar]
- 9. Moss AJ, Zareba W, Hall WJ, et al Prophylactic implantation of a defibrillator in patients with myocardial infarction and reduced ejection fraction. N Engl J Med 2002;346:877–883. [DOI] [PubMed] [Google Scholar]
- 10. Greenberg H, Case RB, Moss AJ, et al Analysis of mortality events in the Multicenter Automatic Defibrillator Implantation Trial (MADIT‐II). J Am Coll Cardiol 2004;43:1459–1465. [DOI] [PubMed] [Google Scholar]
- 11. Carlson J, Havmoller R, Herreros A, et al Can orthogonal lead indicators of propensity to atrial fibrillation be accurately assessed from the 12‐lead ECG? Europace 2005;7(Suppl. 2):39–48. [DOI] [PubMed] [Google Scholar]
- 12. Breithardt G, Cain ME, El‐Sherif N, et al Standards for analysis of ventricular late potentials using high‐resolution or signal‐averaged electrocardiography. A statement by a Task Force Committee of the European Society of Cardiology, the American Heart Association, and the American College of Cardiology. Circulation 1991;83:1481–1488. [DOI] [PubMed] [Google Scholar]
- 13. Berkowitsch A, Zareba W, Neumann T, et al Risk stratification using heart rate turbulence and ventricular arrhythmia in MADIT II: Usefulness and limitations of a 10‐minute Holter recording. Ann Noninvasive Electrocardiol 2004;9:270–279. [DOI] [PMC free article] [PubMed] [Google Scholar]
- 14. Goldenberg I, Vyas AK, Hall WJ, et al Risk stratification for primary implantation of a cardioverter‐defibrillator in patients with ischemic left ventricular dysfunction. J Am Coll Cardiol 2008;51:288–296. [DOI] [PubMed] [Google Scholar]
- 15. Zareba W, Moss AJ. Noninvasive risk stratification in postinfarction patients with severe left ventricular dysfunction and methodology of the MADIT II noninvasive electrocardiology substudy. J Electrocardiol 2003;36(Suppl.):101–108. [DOI] [PubMed] [Google Scholar]
- 16. Zareba W, Steinberg JS, McNitt S, et al Implantable cardioverter‐defibrillator therapy and risk of congestive heart failure or death in MADIT II patients with atrial fibrillation. Heart Rhythm 2006;3:631–637. [DOI] [PubMed] [Google Scholar]
- 17. Morris JJ, Jr , Estes EH, Jr , Whalen RE, et al P‐wave analysis in valvular heart disease. Circulation 1964;29:242–252. [DOI] [PubMed] [Google Scholar]
- 18. Hopkins CB, Barrett O, Jr . Electrocardiographic diagnosis of left atrial enlargement. Role of the P terminal force in lead V1. J Electrocardiol 1989;22:359–363. [DOI] [PubMed] [Google Scholar]
- 19. Van Dam I, Roelandt J, Robles de Medina EO. Left atrial enlargement: An electrocardiographic misnomer? An electrocardiographic‐echocardiographic study. Eur Heart J 1986;7:115–117. [DOI] [PubMed] [Google Scholar]
- 20. Munuswamy K, Alpert MA, Martin RH, et al Sensitivity and specificity of commonly used electrocardiographic criteria for left atrial enlargement determined by M‐mode echocardiography. Am J Cardiol 1984;53:829–832. [DOI] [PubMed] [Google Scholar]
- 21. Tsao CW, Josephson ME, Hauser TH, et al Accuracy of electrocardiographic criteria for atrial enlargement: Validation with cardiovascular magnetic resonance. J Cardiovasc Magn Reson 2008;10:7. [DOI] [PMC free article] [PubMed] [Google Scholar]
- 22. Romhilt DW, Bove KE, Conradi S, et al Morphologic significance of left atrial involvement. Am Heart J 1972;83:322–327. [DOI] [PubMed] [Google Scholar]
- 23. Josephson ME, Kastor JA, Morganroth J. Electrocardiographic left atrial enlargement. Electrophysiologic, echocardiographic and hemodynamic correlates. Am J Cardiol 1977;39:967–971. [DOI] [PubMed] [Google Scholar]
- 24. Liu Z, Hayano M, Hirata T, et al Abnormalities of electrocardiographic P wave morphology and their relation to electrophysiological parameters of the atrium in patients with sick sinus syndrome. Pacing Clin Electrophysiol 1998;21:79–86. [DOI] [PubMed] [Google Scholar]
- 25. Forfang K, Erikssen J. Significance of P wave terminal force in presumably healthy middle‐aged men. Am Heart J 1978;96:739–743. [DOI] [PubMed] [Google Scholar]
- 26. Holmqvist F, Platonov PG, Carlson J, et al Variable interatrial conduction illustrated in a hypertrophic cardiomyopathy population. Ann Noninvasive Electrocardiol 2007;12:227–236. [DOI] [PMC free article] [PubMed] [Google Scholar]
- 27. Konings KT, Kirchhof CJ, Smeets JR, et al High‐density mapping of electrically induced atrial fibrillation in humans. Circulation 1994;89:1665–1680. [DOI] [PubMed] [Google Scholar]
- 28. Fukunami M, Yamada T, Ohmori M, et al Detection of patients at risk for paroxysmal atrial fibrillation during sinus rhythm by P wave‐triggered signal‐averaged electrocardiogram. Circulation 1991;83:162–169. [DOI] [PubMed] [Google Scholar]
- 29. Steinberg JS, Zelenkofske S, Wong SC, et al Value of the P‐wave signal‐averaged ECG for predicting atrial fibrillation after cardiac surgery. Circulation 1993;88:2618–2622. [DOI] [PubMed] [Google Scholar]
Associated Data
This section collects any data citations, data availability statements, or supplementary materials included in this article.
Data Availability Statement
At enrolment 912 (74%) of the 1232 patients were found to be in sinus rhythm, excluding patients with pacemaker rhythm and AF. Of the 912 patients in sinus rhythm 802 (88%) were found to have baseline ECG recordings of sufficient quality for further analysis. The results presented are based on this patient subset.