

Abstract
Introduction: Data on human atrial repolarization are scarce since the QRS complex normally obscures its ECG trace. In the present study, consecutive patients with third‐degree AV block were studied to better describe the human Ta wave.
Methods and Results: Forty patients (mean age 75 years, 17 men) were included. All anti‐arrhythmic drugs were discontinued before ECG recording. Standard 12‐lead ECGs were recorded, transformed to orthogonal leads and studied using signal‐averaged P wave analysis. The average P wave duration was 124 ± 16 ms. The PTa duration was 449 ± 55 ms (corrected PTa 512 ± 60 ms) and the Ta duration (P wave end to Ta wave end) was 323 ± 56 ms. The polarity of the Ta wave was opposite to that of the P wave in all leads. The Ta peaks were located at 196 ± 55 ms in Lead Y, 216 ± 50 ms in Lead X, and 335 ± 92 in Lead Z. No correlation was found between P wave duration and Ta duration, or between Ta peak amplitude and Ta duration. The morphology of the Ta wave was similar regardless of the interatrial conduction.
Conclusions: The Ta wave has the opposite polarity, and the duration is generally two to three times that, of the P wave. Although the Ta peak may occasionally be located in the PQ interval during normal AV conduction, it is unlikely that enough information can be obtained from analysis of this segment to differentiate normal from abnormal atrial repolarization. Hence, an algorithm for QRST cancellation during sinus rhythm is needed to further improve analysis.
Keywords: atrium, repolarization, ECG, third‐degree AV block, signal averaging
The ECG trace of the atrial repolarization wave (the Ta wave) is under normal circumstances usually obscured by the much larger QRST complex. Consequently, studies describing the Ta wave under these conditions are uncommon. 1 , 2 However, during third‐degree AV block the situation is fundamentally different, as the Ta wave and the QRST complexes are uncoupled. Sprague and White first described the Ta complex, using patients with third‐degree AV block as a model, as early as 1925. 3 They noted that the Ta wave was negative, i.e., its direction was opposite to that of the P wave, and that the duration was typically between 0.32 and 0.42 seconds. Findings in subsequent studies are in agreement with this initial description of the Ta wave. 4 , 5 , 6 , 7 The method used for visualization of the Ta wave is, however, with the exception of the recent preliminary study by Koskinen et al., 7 rather crude; the Ta analysis being carried out on standard ECG recordings 3 , 4 , 6 or low‐resolution vectorcardiograms. 5 Koskinen et al. used a different approach employing magnetocardiographic mapping of the patients. 7 Despite the small number of subjects investigated (n = 6), and the preliminary nature of the data, their results confirmed the earlier ECG findings.
Theoretically, the analysis of atrial repolarization may reveal important information regarding arrhythmic propensity, as does QT analysis in the case of ventricular arrhythmia. 8 , 9 The electrophysiological changes during atrial fibrillation, for example, are described in great detail in numerous studies. 10 , 11 , 12 Its key feature is progressive shortening of the atrial refractory period when arrhythmia is sustained. 10 , 11 This is likely to influence the atrial repolarization also during periods of sinus rhythm. So far, only one preliminary investigation, in a very small group of patients (n = 10), has been presented. 1 In that study, analysis of the short Ta segment, visible during normal AV conduction, did not reveal any differences between patients with a history of atrial fibrillation and those without. 1
Signal‐averaged P wave analysis offers a means of describing the P wave during sinus rhythm in detail. 13 , 14 , 15 , 16 , 17 Different P wave morphologies have been identified, are thought to reflect differences in interatrial conduction. 13 , 14 , 16 , 17 In the present study, this technique was applied to recordings from patients with third‐degree AV block in order to further characterize the atrial repolarization on the ECG and to relate the findings to interatrial conduction.
METHODS
Patient Population
Consecutive patients awaiting implantation of a permanent pacemaker system due to third‐degree AV block were studied. Exclusion criteria were atrial fibrillation at the time of ECG recording, age below 18 years and insufficient ECG data.
A total of 40 patients (17 men) were studied, aged from 21 to 94 (mean 75) years. Three‐quarters of the patients (n = 30, 75%) did not have any underlying heart disease. The remainder had ischemic heart disease (Canadian Cardiovascular Society class I) (n = 5, 13%), or aortic valve disease (n = 5, 13%). No patients were receiving regular treatment with anti‐arrhythmic drugs of Vaughan Williams classes I or III, while nine and three were on class II and IV drugs, respectively. None of these patients had taken any antiarrhythmic medication for at least five elimination half‐lives before the recordings were made. The study complied with the Declaration of Helsinki and was approved by the local ethics committee.
Data Acquisition and Analysis
Standard 12‐lead ECGs, of 10 seconds duration 15 were acquired prior to pacemaker implantation. The digital signal (sampling frequency 500 Hz, sampling resolution 5 μV) was written to a file and transferred to a central database (Infinity MegaCare, Draeger Medical Systems, Inc., Danvers, MA, USA) for subsequent off‐line processing. To enable additional analysis of orthogonal P wave morphology, orthogonal‐lead ECG data were derived from the 12‐lead ECG using the inverse Dower transform. 18 , 19 Data analysis was performed using custom‐made software running on MATLAB R14 for Linux (http://www.mathworks.com). The basic method used, signal‐averaged P wave analysis, is described in detail elsewhere. 14 , 15 , 16 , 18
Briefly, following high‐pass (0.5 Hz) and bandstop (50 Hz) filtering, the ECGs were plotted digitally and the P waves were manually identified (P waves with PQ interval < 400 ms were discarded). The signal window (100 ms preceding and 100 ms following the P wave peak) was shifted in time to estimate the maximal correlation in each lead. P waves with a cross‐correlation coefficient of ρ > 0.8 (analyzed separately in all leads) were grouped together. The initial window (200 ms) was then averaged together with the following 400 ms to visualize the Ta segment. The P wave onset, end and Ta end were set manually. The PTa interval was defined as the interval from the beginning of the P wave to the end of the Ta wave. The Ta duration was defined as P wave end to Ta end. The P wave morphology was subsequently classified into one of three predefined classes (Type 1: positive Leads X and Y and negative Lead Z; Type 2: positive Leads X and Y and biphasic Lead Z (–/+); and Type 3: positive Lead X and biphasic signals in Leads Y (+/–) and Z (–/+)) or classed as atypical, 16 using an automatic algorithm. 15 The signals from the standard Leads I, aVF and V1 were also analyzed for comparison purposes. To enhance the similarity between Lead Z and V1, ‐V1 was used. The location and amplitude of the Ta peak were determined automatically in each lead.
Statistics
Data are expressed as the mean ± standard deviation. The Mann‐Whitney U test and Wilcoxon matched pairs test were used to analyze unpaired and paired data, respectively. The Spearman rank order correlation was used for correlation analyses. The Shapiro‐Wilk W‐test was used in testing for normality. All tests were two‐sided and P < 0.05 was considered statistically significant. All statistical analyses were performed using STATISTICA for Windows, version 6.1 (StatSoft, Inc., Tulsa, OK, USA).
RESULTS
The average P wave duration was 124 ± 16 ms, with the P wave morphology distribution being: Type 1, 33% (n = 13); Type 2, 60% (n = 24) and atypical, 7% (n = 3). The PTa duration was 449 ± 55 ms and the duration of the Ta segment was 323 ± 56 ms. The average atrial rate was 84 ± 13 bpm, and the corrected PTa duration 512 ± 60 ms. 6 Neither the distributions of PTa and Ta duration (illustrated in Fig. 1), nor the corrected PTa duration were significantly different from the normal distribution (P = 0.97, P = 0.53 and P = 0.68, respectively, Shapiro‐Wilk W‐test). The amplitude of the Ta peak in Lead Y was lower (−6.9 ± 3.9 mV) and located earlier (196 ± 55 ms) than the peak amplitudes in Lead X (−4.1 ± 4.0 mV, P = 0.00001; 216 ± 50 ms, P = 0.02) and Lead Z (−1.7 ± 5.6 mV, P = 0.00002, 335 ± 92 ms, P < 0.00001). Similar results were seen when analyzing the signals from the standard leads. The amplitude of the Ta peak in Lead aVF was lower (−7.6 ± 4.5 mV) and located earlier (193 ± 45 ms) than the peak amplitudes in Lead I (−5.2 ± 4.1 mV, P = 0.02; 235 ± 78 ms, P = 0.01) and Lead‐V1 (−5.0 ± 4.7 mV, P = 0.03, 315 ± 61 ms, P < 0.00001).
Figure 1.
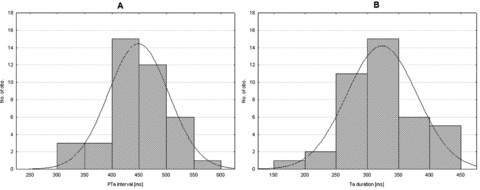
Histograms illustrating the distributions of PTa intervals (A) and Ta duration (B). The distributions are not significantly different from the normal distributions (solid lines, P = 0.97 and P = 0.53, respectively, Shapiro‐Wilk W‐test), hence no indications of different PTa or Ta duration populations were seen in this study.
No correlation was found between Ta peak amplitude and Ta duration in any of the signals analyzed (Lead X: r s=−0.11, Lead Y: r s=−0.13, Lead Z: r s=−0.01, Lead I: r s=−0.17, Lead aVF: r s=−0.13 and Lead‐V1: r s=−0.10. P = NS for all correlations). No correlation was found between P wave and Ta wave duration (r s=−0,13, P = NS). Typical examples of Ta morphology and its relation to P wave morphology are illustrated in Figure 2. The locations and amplitudes of the Ta peak in each lead and their relation to P wave morphology are listed in Table 1.
Figure 2.
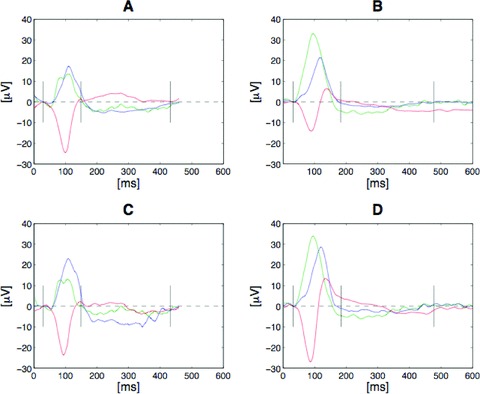
Typical examples of Ta morphologies in relation to P wave morphology. A and B show the signals from the orthogonal Leads X (blue), Y (green) and Z (red), while C and D show the signals from the standard Leads I (blue), aVF (green) and ‐V1 (red). A and C illustrate the Ta morphology resulting from a Type 1 P wave, which is likely to reflect interatrial conduction via the fossa ovalis. B and D illustrate the Ta morphology resulting from a Type 2 P wave morphology, which is likely to reflect Bachmann's bundle interatrial conduction. Note the consistent pattern showing the opposite polarity of the Ta wave regardless of P wave morphology.
Table 1.
Measured Parameters and P Wave Morphology
| Type 1 (n = 13) | Type 2 (n = 24) | P | ||
|---|---|---|---|---|
| P wave duration | ms | 118 ± 19 | 130 ± 12 | 0.02 |
| Atrial rate | bpm | 83 ± 10 | 85 ± 15 | 0.97 |
| PTa interval | ms | 440 ± 66 | 449 ± 51 | 0.79 |
| Corrected PTa | ms | 503 ± 70 | 512 ± 56 | 0.86 |
| Ta wave duration | ms | 321 ± 66 | 319 ± 51 | 0.77 |
| Lead X Ta wave | ||||
| Tapeak amplitude | mV | −4.1 ± 2.4 | −3.1 ± 2.2 | 0.22 |
| Tapeak location | ms | 218 ± 39 | 207 ± 51 | 0.74 |
| Lead Y | ||||
| Tapeak amplitude | mV | −6.3 ± 2.6 | −7.2 ± 4.3 | 0.49 |
| Tapeak location | ms | 202 ± 57 | 194 ± 58 | 0.34 |
| Lead Z | ||||
| Tapeak amplitude | mV | −1.3 ± 6.5 | −2.9 ± 3.4 | 0.34 |
| Tapeak location | ms | 360 ± 81 | 330 ± 94 | 0.74 |
| Lead I | ||||
| Tapeak amplitude | mV | −5.6 ± 3.7 | −4.4 ± 3.9 | 0.35 |
| Tapeak location | ms | 246 ± 101 | 228 ± 64 | 0.96 |
| Lead aVF | ||||
| Tapeak amplitude | mV | −7.0 ± 3.3 | −7.7 ± 4.9 | 0.69 |
| Tapeak location | ms | 200 ± 57 | 190 ± 40 | 0.58 |
| Lead‐V1 | ||||
| Tapeak amplitude | mV | −4.6 ± 5.4 | −4.7 ± 4.3 | 0.96 |
| Tapeak location | ms | 336 ± 75 | 308 ± 52 | 0.63 |
DISCUSSION
In the present study the Ta wave was found to be substantially longer than the P wave and, with a few exceptions, of opposite polarity regardless of which lead was analyzed. This is in agreement with the findings in similar, previous studies. 3 , 4 , 5 , 6 , 7 The consistent finding of the opposite polarity of the P and Ta waves is in sharp contrast to the case of the QRS complex and the T wave. 20 In the case of the ventricles, this has been explained by opposite directions of depolarization and repolarization. 9 This has, however, recently been questioned based on the results of several invasive studies, 21 , 22 in which the depolarization and repolarization seemed to follow the same main direction. Invasively obtained data on atrial repolarization are more scarce, but the results of one study, using the monophasic action potential technique, indicate that depolarization and repolarization also follow the same sequence in the atria. 23 Therefore, although sparse, the invasive data that do exist are in agreement with the findings in the present and previous studies. 3 , 4 , 5 , 6 , 7
While the first few studies primarily described the ECG phenomenon (i.e., the Ta wave), 3 , 4 , 5 the study conducted by Debbas et al. also described the dynamics of the Ta wave. 6 They were not able to demonstrate any relation between PTa interval and PP interval during sinus rhythm, but did find a shortening of the PTa interval as the heart rate increased during pacing. 6 As with the QRS complex, the P wave duration was unaffected by pacing rate. Propranolol, disopyramide and flecainide all prolonged the corrected the PTa interval, while the administration of atropine shortened it. 6 In the present study no patients using genuine anti‐arrhythmic drugs were included and in the minority on anti‐arrhythmics (class II and IV) medication was stopped prior to the ECG recording. Hayashi et al. found differences in the Ta loop, seen on vectorcardiography, between patients with (n = 4) and without (n = 12) a history of heart disease. 5 The ten patients with a history of heart disease in the present study had virtually identical P and Ta waves to the patients without (data not shown). This may either be due to the relatively small number of patients with heart disease in the present study or, considering the even lower number of patients in the study by Hayashi et al., may indicate a possible advantage of vectorcardiography over regular ECG analyses.
It has been postulated that the different P wave morphologies identifiable using signal‐averaged P wave analysis represent differences in interatrial conduction. 14 , 15 Specifically, Type 1 P wave morphology is thought to be generated by interatrial conduction primarily via posterior interatrial connections near the fossa ovalis area, while Type 2 morphology is believed to be generated by interatrial conduction via Bachmann's bundle. 15 A higher proportion of Type 2 P wave morphologies observed in the present study is expected given the high average age of the population. 14 No differences could be detected in atrial repolarization sequence as a consequence of P wave morphology.
The locations of the Ta minima in each lead were, in most cases, well over 200 ms after the onset of the P wave. With the normal PQ interval generally being below 200 ms, this implies that the Ta minima will, with a few exceptions, be located in the subsequent QRS complex during normal AV conduction. Moreover, even if the Ta peak were to be visible in some cases, with an unusually early Ta peak combined with an unusually long PQ interval, the amplitude of the Ta peak did not show any relation to its duration or PTa interval in the present study. Likewise, the end of the Ta peak will always be located either in the QRS complex or, more likely, somewhere in the ST segment. Finally, as in the case of the ventricles, the depolarization phase of the atria (P wave) was not correlated with Ta duration. Hence, based on the findings in this study, it seems that some form of separation of the atrial and ventricular ECG components is needed to enable detailed ECG analysis of atrial repolarization during normal AV conduction. Seen in the light of these findings, the negative results of the preliminary study by Langley and Murray, when comparing the PQ interval between patients with atrial fibrillation and healthy controls during normal sinus rhythm, 1 is hardly surprising. Separating the Ta wave from the QRST complex may be of importance not only in the case of atrial arrhythmia. Exaggerated Ta waves have, for example, been suggested as the cause of false‐positive exercise test results. 24
The distribution of PTa did not diverge significantly from the expected normal distribution. Hence, no indications of populations exhibiting pathologically long or short PTa or Ta intervals are seen in the present study. Neither did the two subjects with a history of atrial fibrillation diverge from the population as a whole. Obviously, future, larger studies are needed to shed light on these issues.
Study Limitations
The signal‐averaged P wave analysis method is now well established for the detailed analysis of P wave morphology and interatrial conduction. 13 , 14 , 15 , 16 , 17 The extension of the method to enable analysis of the Ta wave, described in the present study, is not likely to affect the validity of the method.
The prevalence of third‐degree AV block increases with age. The presence of third‐degree AV block was a prerequisite in the present study to enable analysis of the Ta segment. Consequently, the studied population was older than the population in general. This may induce bias due to increased co‐morbidity, cardiac as well as non‐cardiac. The prevalence of such comorbidity was, however, low in the present study.
CONCLUSIONS
In the present study unfiltered signal‐averaged P wave analysis was used to provide a detailed description of the Ta wave for the first time. The Ta wave was found to have the opposite polarity to, and the duration is generally two to three times longer than that of, the P wave. The Ta duration is normally distributed, and no indications of different populations were seen in the present study. These findings are valid regardless of the P wave morphology. Although the Ta peak may occasionally be located in the PQ interval during normal AV conduction, it is unlikely that enough information can be obtained from the analysis of this segment to differentiate normal from abnormal atrial repolarization. Hence, an algorithm for QRST cancellation during sinus rhythm is needed to further improve analysis.
Acknowledgments
Acknowledgments: The present study was supported by grants from Lund University Hospital, Torsten Westerström's Foundation, and by governmental funding of clinical research within the Swedish health care service. None of the authors has any conflict of interest to declare.
The study was supported by grants from Lund University Hospital, Torsten Westerström's Foundation, and by governmental funding of clinical research within the Swedish health care system.
REFERENCES
- 1. Langley P, Murray A. Analysis of the atrial repolarisation phase of the ECG in health and in atrial fibrillation. Computers in Cardiology 2007;34:785–788. [Google Scholar]
- 2. Ihara Z, Van Oosterom A, Hoekema R. Atrial repolarization as observable during the PQ interval. J Electrocardiol 2006;39:290–297. [DOI] [PubMed] [Google Scholar]
- 3. Sprague HB, White PD. Clinical observations on the T wave of the auricle appearing in the human electrocardiogram. J Clin Invest 1925;1:389–402. [DOI] [PMC free article] [PubMed] [Google Scholar]
- 4. Abramson DI, Fenichel NM, Shookhoff C. A study of electrical activity in the auricles. Am Heart J 1938;15:471–481. [Google Scholar]
- 5. Hayashi H, Okajima M, Yamada K. Atrial T (Ta) loop in patients with A‐V block: A trial to differentiate normal and abnormal groups. Am Heart J 1976;91:492–500. [DOI] [PubMed] [Google Scholar]
- 6. Debbas NM, Jackson SH, De Jonghe D, et al Human atrial repolarization: Effects of sinus rate, pacing and drugs on the surface electrocardiogram. J Am Coll Cardiol 1999;33:358–365. [DOI] [PubMed] [Google Scholar]
- 7. Koskinen R, Lehto M, Mantynen V, et al Assessment of atrial repolarization by magnetocardiographic mapping in patients. Int J Cardiol 2007;119:S22‐S23. [Google Scholar]
- 8. Abildskov JA, Burgess MJ, Urie PM, et al The unidentified information content of the electrocardiogram. Circ Res 1977;40:3–7. [DOI] [PubMed] [Google Scholar]
- 9. Malik M, Batchvarov VN. Measurement, interpretation and clinical potential of QT dispersion. J Am Coll Cardiol 2000;36:1749–1766. [DOI] [PubMed] [Google Scholar]
- 10. Wijffels MC, Kirchhof CJ, Dorland R, et al Atrial fibrillation begets atrial fibrillation. A study in awake chronically instrumented goats. Circulation 1995;92:1954–1968. [DOI] [PubMed] [Google Scholar]
- 11. Morillo CA, Klein GJ, Jones DL, et al Chronic rapid atrial pacing. Structural, functional, and electrophysiological characteristics of a new model of sustained atrial fibrillation. Circulation 1995;91:1588–1595. [DOI] [PubMed] [Google Scholar]
- 12. Allessie M, Ausma J, Schotten U. Electrical, contractile and structural remodeling during atrial fibrillation. Cardiovasc Res 2002;54:230–246. [DOI] [PubMed] [Google Scholar]
- 13. Carlson J, Johansson R, Olsson SB. Classification of electrocardiographic P‐wave morphology. IEEE Trans Biomed Eng 2001;48:401–405. [DOI] [PubMed] [Google Scholar]
- 14. Havmoller R, Carlson J, Holmqvist F, et al Age‐related changes in P wave morphology in healthy subjects. BMC Cardiovasc Disord 2007;7:22. [DOI] [PMC free article] [PubMed] [Google Scholar]
- 15. Holmqvist F, Havmoller R, Platonov P, et al Signal‐averaged P wave analysis for delineation of interatrial conduction—Further validation of the method. BMC Cardiovasc Disord 2007;7:29. [DOI] [PMC free article] [PubMed] [Google Scholar]
- 16. Holmqvist F, Platonov PG, Carlson J, et al Variable interatrial conduction illustrated in a hypertrophic cardiomyopathy population. Ann Noninvasive Electrocardiol 2007;12:227–236. [DOI] [PMC free article] [PubMed] [Google Scholar]
- 17. Platonov PG, Carlson J, Ingemansson MP, et al Detection of inter‐atrial conduction defects with unfiltered signal‐averaged P‐wave ECG in patients with lone atrial fibrillation. Europace 2000;2:32–41. [DOI] [PubMed] [Google Scholar]
- 18. Carlson J, Havmoller R, Herreros A, et al Can orthogonal lead indicators of propensity to atrial fibrillation be accurately assessed from the 12‐lead ECG? Europace 2005;7(Suppl 2):39–48. [DOI] [PubMed] [Google Scholar]
- 19. Edenbrandt L, Pahlm O. Vectorcardiogram synthesized from a 12‐lead ECG: Superiority of the inverse Dower matrix. J Electrocardiol 1988;21:361–367. [DOI] [PubMed] [Google Scholar]
- 20. Einthoven W. Ueber die Form des menschlichen Electrocardiogram. Archiv fur die gesammte Physiologie des Menschen und Thiere 1902;60:101–123. [Google Scholar]
- 21. Gepstein L, Hayam G, Ben‐Haim SA. Activation‐repolarization coupling in the normal swine endocardium. Circulation 1997;96:4036–4043. [DOI] [PubMed] [Google Scholar]
- 22. Yuan S, Kongstad O, Hertervig E, et al Global repolarization sequence of the ventricular endocardium: Monophasic action potential mapping in swine and humans. Pacing Clin Electrophysiol 2001;24:1479–1488. [DOI] [PubMed] [Google Scholar]
- 23. Li Z, Hertervig E, Kongstad O, et al Global repolarization sequence of the right atrium: Monophasic action potential mapping in health pigs. Pacing Clin Electrophysiol 2003;26:1803–1808. [DOI] [PubMed] [Google Scholar]
- 24. Sapin PM, Koch G, Blauwet MB, et al Identification of false positive exercise tests with use of electrocardiographic criteria: A possible role for atrial repolarization waves. J Am Coll Cardiol 1991;18:127–135. [DOI] [PubMed] [Google Scholar]