

Abstract
A collaboration between the Consortium for Innovation and Quality in Pharmaceutical Development and the Cardiac Safety Research Consortium has been formed to design a clinical study in healthy subjects demonstrating that the thorough QT (TQT) study can be replaced by robust ECG monitoring and exposure–response (ER) analysis of data generated from First‐in‐Man single ascending dose (SAD) studies. Six marketed drugs with well‐characterized QTc effects were identified in discussions with FDA; five have caused QT prolongation above the threshold of regulatory concern. Twenty healthy subjects will be enrolled in a randomized, placebo‐controlled study designed with the intent to have similar power to exclude small QTc effects as a SAD study. Two doses (low and high) of each drug will be given on separate, consecutive days to 9 subjects. Six subjects will receive placebo. Data will be analyzed using linear mixed‐effects ER models. Criteria for QT‐positive drugs will be the demonstration of an upper bound (UB) of the 2‑sided 90% confidence interval (CI) of the projected QTc effect at the peak plasma level of the lower dose above the threshold of regulatory concern (currently 10 ms) and a positive slope of ER relationship. The criterion for QT‐negative drug will be an UB of the CI of the projected QTc effect of the higher dose <10 ms. It is expected that a successful outcome in this study will provide evidence supporting replacement of the TQT study with ECG assessments in standard early clinical development studies for a new chemical entity.
Keywords: Thorough QT/QTc study, QTc interval, healthy volunteers, single‐ascending‐dose
Drug‐induced delayed cardiac repolarization, which can be measured as prolongation of the QTc interval in the 12‐lead ECG, has been associated with a rare but potentially fatal ventricular arrhythmia termed torsades de pointes (TdP).1, 2, 3 As a result of increased awareness that noncardiovascular drugs may cause QTc prolongation,4, 5 the International Conference on Harmonization (ICH) issued a guidance document in May 2005, the ICH E14 document: The Clinical Evaluation of QT/QTc Interval Prolongation and Proarrhythmic Potential for Non‐Antiarrhythmic Drugs.6 This guidance requires the majority of new chemical entities (NCE) with systemic availability to be tested in a study specifically designed to exclude small drug‐induced QTc effects, the so‐called “thorough QT/QTc” (TQT) study. The TQT study is typically performed in healthy volunteers and should evaluate the NCE at plasma levels exceeding those seen in the target population.7 The study is designed to exclude a “threshold” effect below which QTc changes are considered to have no clinical consequence, currently a placebo‐corrected, change‐from‐baseline QTc (∆∆QTc) of about 5 ms as demonstrated by the upper bound (UB) of the 2‐sided 90% confidence interval (CI) being below 10 ms (i.e., a “negative TQT study”).8 In case this “threshold” effect cannot be excluded (i.e., a “positive TQT study”), the QTc effect and its potential consequences (adverse events of ventricular arrhythmias or signs/symptoms suggestive thereof) are required to be further studied in the targeted patient population, which includes ECG monitoring in late stage trials.
The TQT study is a resource intensive study9 designed solely to evaluate the effect on ECG parameters by the NCE. Increased efficiency could be realized if these data were generated from studies that are routinely performed as part of the clinical development program. In the single‐ascending‐dose (SAD) First‐in‐Man (FIM) study, escalating doses of the NCE are given to small cohorts of subjects, often up to the maximum tolerated dose. Plasma concentrations are often achieved which thereafter will not be exceeded in healthy subjects or in patients. Provided a robust ECG assessment schedule is incorporated into the SAD study design, such “early QT assessment” could therefore represent an opportunity to generate ECG data with the same high level of confidence as from the TQT study.10, 11, 12 Since different doses are distributed across several small cohorts (typically, six to eight subjects on NCE), the power of a “by time point” analysis will be insufficient to exclude small effects.13 In contrast, exposure–response (ER) analysis makes full use of all data across the often wide range of plasma concentrations of the NCE, thereby resulting in a substantially improved precision of the estimated QTc effect.
To better understand and define advantages and disadvantages of “early QT assessment” as compared to the TQT study, the Clinical Pharmacology Leadership Group of the Consortium for Innovation and Quality in Pharmaceutical Development (IQ)14 and the Cardiac Safety Research Consortium (CSRC15) have joined in a collaborative research initiative. Six marketed drugs with a well‐characterized QT effect, of which 5 have been shown to be mildly positive, will be evaluated in a “SAD‐like” study in healthy volunteers using ER analysis as the primary method. The drugs and doses have been identified in collaboration with the FDA and the objective of the project is to determine whether “early QT assessment” can replace the TQT study. The IQ‐CSRC has reached an agreement with the FDA that if the criteria for a successful study outcome are met (as discussed below), a similar approach (i.e., QT assessment in a SAD study) could serve as an alternative path to quantify QT effects and thereby replace the TQT study.
This paper describes the study design, selected drugs and doses and the analysis of the study, which is expected to start in Q1, 2014 and to deliver data approximately 4 months later.
STUDY DESIGN
The study will be a 3‐period, third‐party blinded, randomized, placebo‑controlled study in 20 healthy volunteers conducted in a design similar to a single ascending dose (SAD) Phase 1 study with the primary objective to estimate the effect of the drugs on the QTc interval using ER analysis. As is often the case for SAD Phase 1 studies, the majority of subjects is expected to be males, although the study will be open to female subjects. Each subject will undergo three treatment periods. An incomplete block design will be used that will result in each study drug being administered to nine subjects and placebo to six subjects in separate periods (Table 1). The design, sample size and statistical approach is intended to result in similar power to exclude clinically relevant QTc effects as a standard SAD FIM study (see Sample size justification below).
Table 1.
Randomization Scheme
| Subject | Period 1 | Period 2 | Period 3 |
|---|---|---|---|
| 1 | a | b | c |
| 2 | b | c | a |
| 3 | c | a | b |
| 4 | c | b | a |
| 5 | b | a | c |
| 6 | a | c | b |
| 7 | P | c | b |
| 8 | c | P | a |
| 9 | b | a | P |
| 10 | a | b | c |
| 11 | d | e | f |
| 12 | e | f | d |
| 13 | f | d | e |
| 14 | f | e | d |
| 15 | e | d | f |
| 16 | d | f | e |
| 17 | P | f | e |
| 18 | f | P | d |
| 19 | e | d | P |
| 20 | d | e | f |
Block 1 in blue; block 2 in pink. Study treatments: a = ondansetron; b = quinine; c = dolasetron; d = moxifloxacin; e = dofetilide; f = levocetirizine (QT‐negative drug); P = placebo.
SELECTED DRUGS AND DOSES
Six marketed drugs with well‐characterized QT effect have been selected for the evaluation: five “QT‐positive” and one “QT‐negative” drug (Table 2). The 5 QT‐positive drugs were chosen in discussions with FDA and selection criteria include the toxicity profile allowing administration to healthy subjects, lack of substantial heart rate effect and the degree of QTc prolongation; the lower dose on Day 1 was recommended by the FDA and is meant to achieve a mean placebo‐corrected, change‐from‐baseline QTc (ΔΔQTc) of 9–12 ms. A higher dose, expected to result in ΔΔQTc of about 15–20 ms, will be given on Day 2. The higher dose was chosen to mimic a typical SAD study which includes doses that target efficacious concentrations and then adds higher doses. In addition to providing similarity with a SAD design, the higher dose increases the precision of the slope estimate by pooling data from the two dose levels (see Sample size justification below).
Table 2.
Selected Drugs and Doses
| Dose Justification | |||
|---|---|---|---|
| Drug | TQT Study Design and Results | Day 1 | Day 2 |
| ZOFRAN (on‐ | QTc interval prolongation was studied in a double blind, | 52 mg orala | 32 mg given by 15 min IV |
| dansetron | single intravenous dose, placebo‐ and positive‐controlled, | Dose has not been | infusion |
| HCl)25 | crossover study in 58 healthy subjects | tested in TQT study. | Based on TQT study results, |
| The maximum mean (95% upper confidence bound) difference in QTcF from placebo after baseline‐correction was 19.5 (21.8) ms and 5.6 (7.4) ms after 15 minute | However, the anticipated effect is 10–12 ms | mean ΔΔQTc = 19.5 ms | |
| intravenous infusions of 32 mg and 8 mg ZOFRAN, respectively | Cmax: ∼281 ng/mL | ||
| QUALAQUIN | QTc interval prolongation was studied in a double‐blind, | 648 mg orala | 648 mg q8h × 4 (3 doses on |
| (quinine sulphate)26, 27 | multiple dose, placebo‐ and positive‐controlled crossover study in young (N = 13, 20–39 years) and elderly (N = 13, 65–78 years) subjects. After 7 days of dosing with | In a PK study in HV (n = 24) the mean change from | Day 1 and a morning dose on Day 2)After the 4th dose (75% of |
| QUALAQUIN 648 mg three times daily, the maximum mean (95% upper confidence bound) differences in QTcI from placebo after baseline correction was 27.7 (32.2) ms | baseline QTc at Tmax was 12 ms Cmax ∼ 3.2 μg/mL | Cmax), the anticipated con‐centration is 5.1 μg/mL and the anticipated QTc is | |
| QRS prolongation noted | Expected increase in QTc of 12 ms based on the PK/PD model | ∼20 ms | |
| ANZEMET | QTcF interval was evaluated in a randomized, single dose, | 100 mg POa | 150 mg IV by 15 minute |
| (dolasetron)28 | placebo and active (moxifloxacin 400 mg once daily) | Cmax: ∼278 ng/mL | infusion |
| controlled crossover study in 80 healthy adults. The maximum mean (95% upper confidence bound) differences in QTcF from placebo after predose | This value was extrapolated from the 200 mg dose in | Dose chosen for an expected QTcF of about 20 ms, based on: | |
| baseline‐correction were 14.1 (16.1) and 36.6 (38.6) ms for 100 mg and supratherapeutic 300 mg ANZEMET administered intravenously, respectively | the Label.The Cmax from 100 mg IV was 310 (SD = 65.7) ng/mL | Linear PK in the 50–200 mg IV dose range | |
| QRS prolongation noted | in the TQT study. | From TQT modeling, plasma hydrodolasetron | |
| concentrations above approximately 444 ng/mL will result in increase in QTcF that are 20 ms or greater | |||
| AVELOX | NA | 400 mg poa | 800 mg by 60 min IV infusion |
| (moxifloxacin)18, 29 | Cmax: ∼2.95 μg/mL | Mean ΔΔQTc ∼20 ms | |
| Mean ΔΔQTc = 10–14 ms | |||
| TIKOSYN | Increase in QT interval is directly related to dofetilide dose | 0.125 mg oral | 0.25 mg oral |
| (dofetilide)30 | and plasma concentration. The relationship in normal | Cmax: 0.7 ng/mL | ΔQTc = ∼20 ms |
| volunteers between dofetilide plasma concentrations and change in QTc is linear, with a positive slope of approximately 15–25 ms/ng/mL after the first dose. | ΔQTc = 10–11 ms | ||
| XYZAL (levocetirizine; | A QT/QTc study using a single dose of 30 mg of levocetirizine did not demonstrate an effect on the QTc interval. | 5 mg (therapeutic dose) oral | 30 mg oral (supratherapeutic dose TQT study) |
| negative | Mean ∆∆QTc 1.1 ms31 | ||
| drug)31, 32 | Cmax: ∼1.3 μg/mL | ||
Dose suggested by FDA
Cmax: Estimated peak plasma concentration at this dose.
Subjects will be fasting overnight for 8 hours before dosing in the morning. For the first 4 hours postdosing, subjects will continue fasting and will thereafter receive meals in a standardized way. Since six different marketed drugs will be administered in addition to placebo, a fully double‐blind study has been deemed infeasible; the identity of treatments will however be blinded to subjects and the investigating site staff by using third party dosing. Since some of the doses/drugs will be given intravenously on Day 2 (Table 2), all subjects will be given an infusion (active or placebo) and a tablet (active or placebo) on this day in each period.
ECG AND PHARMACOKINETIC METHODOLOGY
The continuous ECG recordings from this study will be stored in a research database; once established, this will allow different methodologies for extraction and measurement of ECG intervals to be applied to the data.
ECG recording, processing and analysis will be performed using the same rigorous approach as in TQT studies. Continuous digital 12‐lead ECGs will be recorded from 1 hour prior to dosing on Day 1 to 24 hours after the dose on Day 2, that is, until the morning of Day 3. Subjects will be resting quietly in supine position for at least 10 minutes prior to and 5 minutes after the nominal times for ECG and PK analysis: three predose time points on Day 1 to serve as the baseline and nine serial time points for 24 hours postdose on Day 1 and Day 2. The same schedule will be used for all treatments, designed to capture the effect near the time of peak plasma levels of all drugs. Twelve‐lead ECG strips of appropriate length will be extracted in replicate (triplicate or more) from the continuous recording during periods of verified stable heart rate during a 5‐minute window preceding each time point. ECG intervals will be measured at a central ECG laboratory, which will be fully blinded to study treatments, time points (baseline vs postdosing) and subject identification.
After each nominal postdosing time point for ECG extraction, blood samples for PK analysis will immediately be collected. Plasma concentrations of parent drug and any active metabolites will be determined by appropriate assay methodology (e.g., LC/MS) with adequate sensitivity.
DATA ANALYSIS AND INTERPRETATION
Since subjects in a SAD study are divided into small cohorts and administered several doses of the NCE, a “by time point” analysis with treatment as factor would be underpowered and thus, inappropriate. In contrast, an ER analysis can make optimal use of the totality of doses and time points and thereby substantially increase the precision of the estimated QTc effect.
The primary analysis will be based on an ER analysis of the relationship between drug plasma concentrations and QTcF. The primary variable will be change‐from‐baseline QTcF (∆QTcF), and adjustment for placebo and circadian variability will be done within the ER model. Data from nine subjects receiving each drug will be analyzed separately and data from the six subjects on placebo will be included in each analysis (i.e., nine subjects on drug vs six on placebo for each treatment). The analysis will be based on a linear mixed‐effects model with ∆QTcF as the dependent variable, drug plasma concentration as a continuous covariate and nominal time post–first dose as a factor. Predictions of drug effect at a given concentration using this model have been shown to be similar to those obtained from a model using time‑matched, placebo‑adjusted change from baseline QTcF as the dependent variable (Dr. Garnett, Certara, personal communication). The latter model can, however only be applied in a complete block crossover setting. Tests will be formulated based on 2‐sided 90% CI and the confidence intervals for slopes will be derived directly from the model. Confidence intervals for the predicted effect at the geometric mean peak plasma level (Cmax) will be obtained by nonparametric bootstrapping with subject as unit of observation.
The key assumptions for this model to be applicable are absence of hysteresis and linearity of the concentration–response relationship. The absence of hysteresis will be checked graphically. If the maximum ∆∆QTcF (defined as the mean change from baseline in QTcF of each drug at each nominal time point minus the mean ∆QTcF of the placebo group at each nominal time point) is delayed compared to the peak plasma concentrations of the drug by 1 hour or more, a pharmacokinetic model with an effect compartment will be explored to replace the direct effect model described above. The appropriateness of a linear model will be assessed by inspecting of relevant goodness of fit plots. If there is an indication that a linear model is inappropriate, the nonlinearity detected will be taken into account by an appropriate transformation of the concentration values (e.g., log(conc/lloq)), or another appropriate nonlinear model.
CRITERIA FOR QT ASSESSMENT
The same criteria as currently used to estimate QTc effects using ER analysis with the observed data in TQT studies and to project QTc effects in the targeted patient population16, 17 will be used in the evaluation of the results from this study. It should be noted that even though two doses of each drug are included, the criteria for the “QT‐positive” drugs will be based on the projected QTc effect of the lower dose, that is, the dose identified by the FDA as having a QTc effect at the threshold of regulatory interest, and the criterion for the “QT‐negative” drug will be applied to the projected effect of the higher dose of the negative drug.
The following criteria will be used to evaluate whether the study was able to demonstrate a QT effect of the 5 “QT‐positive drugs” (Fig. 1):
-
(1)
The UB of the 2‐sided 90% CI of the predicted placebo‐corrected ∆QTcF is above 10 ms at the observed geometric mean Cmax of the lower dose of the studied drugs.
Figure 1.
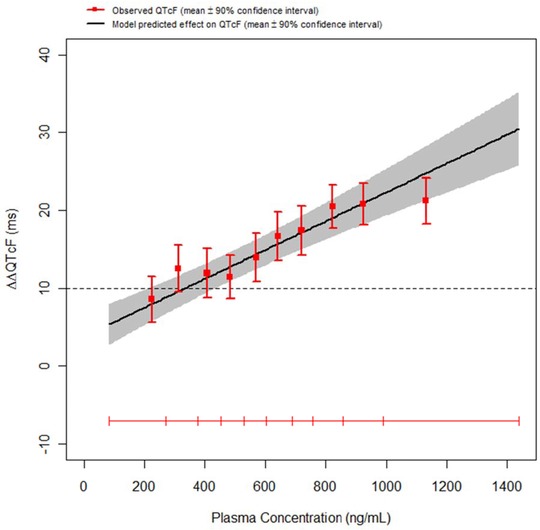
An example of a positive QT assessment. The model‐based projection of the mean QTcF effect (solid black line) with 90% CI (gray shaded area) is shown across the range of plasma concentrations observed in a multiple‐ascending dose study. A concentration dependent effect of the drug on the QTcF interval was demonstrated with an increase of approximately 1.85 ms (90% CI ±0.45) per 100 ng/mL increase in plasma level. At plasma levels around 1 μg/mL, the predicted QTc effect is around 18 ms with an upper bound of the 90% CI of 23 ms. The horizontal red line shows the range of plasma concentrations divided into deciles and the vertical, red bars show the observed ∆∆QTcF with 90% CI within each plasma concentration decile (plotted at the median concentration of each decile).
Reproduced from Ref. 10 with permission from the authors, Br J Clin Pharmacology, The British Pharmacological Society and Blackwell Publishing.
In addition, the following criterion will be applied to ensure that the study has provided data with sufficiently low variability to allow a precise slope estimate:
-
(2)
The lower bound of the 2‐sided 90% CI for the ER slope estimate from the linear mixed effects model is above zero.
The following criterion will be used to evaluate whether the study was able to exclude a QT effect of concern for the “QT‐negative” drug (levocetirizine):
-
(3)
The UB of the 2‐sided 90% confidence interval of the predicted placebo‐corrected ∆QTcF at the observed geometric mean Cmax level of the higher dose of levocetirizine is below 10 ms (Fig. 2).
Figure 2.
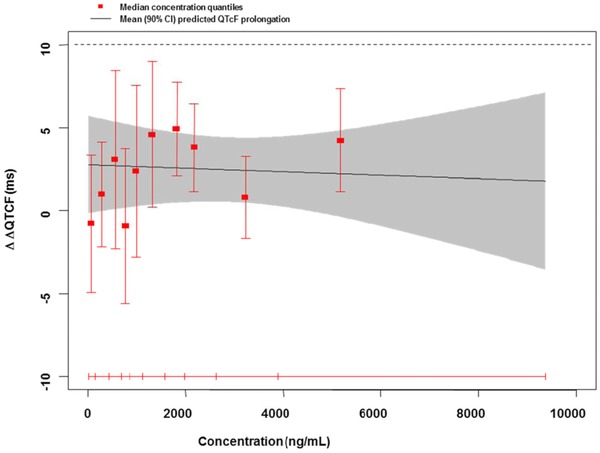
An example of a negative QT assessment in a SAD study with a neurological NCE. As shown by the upper bound of the 90% CI of the projected QT effect, a drug‐induced effect exceeding 10 ms could be excluded at all observed plasma levels. Symbols as in previous figure.
Reproduced from Ref. 10 with permission from the authors, Br J Clin Pharmacology, The British Pharmacological Society and Blackwell Publishing.
As a secondary endpoint, the same criteria will be applied to the estimated QT effect at the expected Cmax of the lower dose of the “QT‐positive” drugs and of the higher dose of the negative drug (see Table 2), based on literature and labels.
The results of this study will not be compared with the “by time point” analysis from TQT studies of the same compounds since a different analytical approach (ER) is used and the intention is to demonstrate whether a threshold effect can be detected, not necessarily corresponding exactly to what has been shown in other studies.
JUSTIFICATION OF SAMPLE SIZE
The incomplete block design will result in nine subjects on each active treatment and six subjects on placebo with the aim to obtain ECG and PK data from at least six subjects on each of the marketed drugs and five subjects on placebo (Table 1). This sample size is in the same range as for one dose cohort in a SAD study, in which often eight subjects are allocated within each cohort to six on active and two on placebo. It should be acknowledged that there is limited experience with respect to the power of a study of this design. Simulations based on subsampling from existing TQT studies indicate that for 400 mg moxifloxacin (with a projected effect of around 10–14 ms18), a false negative rate of about 10% can be expected, while the power to detect a positive slope is well above 90% (Table 3). Based on parametric PK/PD simulations of moxifloxacin data from the PK model described in Florian et al.18 and PD model described in Brendel et al.,19 inclusion of a higher dose level (800 mg) is expected to increase precision of the slope estimate obtained from a linear mixed‑effects model (Table 4, the planned study corresponds to the 6/6/0/6 scenario). Inclusion of the higher dose did not affect the point estimate of the slope: the median slope value ranged from 5.41 to 5.82 ms/mg/L across all scenarios. In line with this, it is expected that with the addition of a higher dose on Day 2, the power of the study should increase further.
Table 3.
False Negative Rate and Fraction of Studies with Significantly Positive Slope Based on Subsampling of the Moxifloxacin (400 mg) and Placebo Arms of Four Thorough QT Studies
| Fraction of | Fraction of Studies | |||||
|---|---|---|---|---|---|---|
| Sample Size | (False) Negative Studies | with Significantly Positive Slope | ||||
| Moxi/Plac | Min | Mean | Max | Min | Mean | Max |
| 03/03 | 7% | 11% | 17% | 74% | 83% | 86% |
| 06/03 | 7% | 11% | 20% | 87% | 93% | 98% |
| 09/03 | 9% | 13% | 23% | 92% | 96% | 100% |
| 12/03 | 8% | 13% | 24% | 97% | 99% | 100% |
| 03/06 | 7% | 11% | 17% | 80% | 88% | 91% |
| 06/06 | 6% | 11% | 21% | 90% | 96% | 99% |
| 09/06 | 8% | 12% | 20% | 97% | 99% | 100% |
| 12/06 | 6% | 12% | 24% | 99% | 99% | 100% |
Table 4.
Precision of Slope Estimate under Various Simulation Designs; Parametric Simulation
| Number Subjects per | False | Median and 90% | Median CI |
|---|---|---|---|
| Moxifloxacin Dose Arm | Negative Rate with | CI of Slope, | Width of Slope, |
| 800 mg/400 mg/200 mg/0 mg | 95% Binomial CI | ms/mg/L | ms/mg/L |
| 0/24/0/24 | 3.5% (0.953, 6.05) | 5.82 (3.75, 7.54) | 3.10 |
| 0/12/0/12 | 4.5% (1.63, 7.37) | 5.71 (3.06, 8.59) | 4.43 |
| 0/6/0/6 | 7% (3.46, 10.5) | 5.53 (1.91, 10.4) | 6.28 |
| 0/6/6/6 | 7.5% (3.85, 11.2) | 5.41 (1.87, 8.61) | 5.98 |
| 6/6/0/6a | 10% (5.84, 14.2) | 5.44 (3.01, 7.91) | 3.20 |
| 6/0/6/6 | 8% (4.24, 11.8) | 5.64 (3.01, 8.00) | 3.13 |
Simulations based on 200 replicates of the PK/PD model.
Dose allocation in the proposed study design.
CAN THE OUTCOME OF THE STUDY INFLUENCE THE CURRENT PARADIGM FOR CLINICAL QT ASSESSMENT?
The objective of the study planned by the IQ‐CSRC group is to evaluate whether intense ECG assessment paired with ER analysis in a SAD study with small cohorts of subjects can be used to replace the TQT study in a subsequent phase of clinical development. If the planned study results in a positive QT assessment (as defined above) for all five “QT‐positive drugs” and can exclude a QTc effect exceeding 10 ms for levocetirizine, it will be deemed to have met this objective successfully. In such a case, these data can serve to demonstrate that a similar approach, applied to a standard SAD study for an NCE, can be used as an alternative to the TQT study. This concept has been presented to the FDA, which has taken active part in drug selection and in discussing the design and the potential outcome of the study. The FDA has emphasized that their primary interest is to ensure that the rate of false negative results remains low and therefore recommended the five “QT‐positive” drugs. In these discussions, the FDA has endorsed the study and agreed to this interpretation of the study results. The study and the underlying concepts have also been presented to the ICH E14 Implementation Working Group and to individual regulators with the intention to provide regular updates. With a successful outcome of the study, we therefore expect that the results can be used to trigger a discussion in regard to revising the ICH E14 document.
The underlying concept of “early QT assessment” is to utilize ER analysis applied to ECG data derived from serial postdosing ECG/PK time points as the primary analysis method. If the E14‐defined time‐matched approach were to be applied to a standard SAD study with dosing groups of six to nine subjects, it will in most cases not have the power to exclude a QTc effect of concern, since the effect of the drug is independently tested at each postdosing time point for each dose separately. Given the substantial experience that has been gained using ER analyses of data from TQT studies and from trials in the targeted patient population,20 we believe that it is now time to consider this methodology as primary for the evaluation of whether an NCE has a QTc effect of concern in early clinical trials. The following criterion would be used as a basis for a request for a TQT waiver:
-
(4)
The UB of the 2‐sided 90% confidence interval of the predicted placebo‐corrected ∆QTcF at the highest clinically relevant plasma concentrations of the drug should be below 10 ms.
Several limitations and aspects of this approach should be acknowledged and discussed:
“Clinically relevant plasma concentrations” of the parent compound and abundant metabolites can be estimated based on in vitro pharmacology and nonclinical assays but are certainly not known when the results from the SAD study are available. In case the doses evaluated in the SAD study have not generated plasma concentrations exceeding those seen in patients with increased drug concentrations due to intrinsic or extrinsic factors, for example, impaired drug clearance due to drug–drug interaction, these data may not obviate the TQT study. When using ER analysis, there will always be a plasma concentration below which the study is negative (which is similar to using doses that are too low in a TQT study). It is therefore important to emphasize that the estimated QT effect at plasma concentrations at the highest clinically relevant concentrations will define the outcome (positive or negative) of the study. This will not be different as compared to discussions held in regard to whether the selected supratherapeutic dose has been high enough in a TQT study.21
ER analysis has been criticized for not prospectively defining criteria for model selection but rather use observed data for selection of the model, that is, a post hoc approach. It is therefore important to state in the statistical analysis plan how and in which order models will be explored and selected. We have addressed this for the current study and believe that the criteria we will use cover most ER relationships (see Data analysis and interpretation). It should however be acknowledged that there may be scenarios that are not easily defined prospectively. As more experience accumulates, criteria for model selection can be improved to also cover even exceptional scenarios.
It can be argued that by adding a higher dose of the QT‐positive drugs, the study will not evaluate an effect at the level of concern, that is, 10 ms. It should then be noted that the criteria for a QT‐positive assessment is based on the projected effect of the lower, FDA‐selected dose. The intent of adding a higher dose is to make the design more similar to a standard SAD design and to increase the precision of the estimate of the ER slope. Furthermore, the design of the study allows exploration of the power of ER analysis under variations of the design. In particular, analyses using only Day 1 data and simulations of studies with varying sample sizes can be undertaken. Even so, the power of a typical SAD study with many parallel dose‐groups will vary and will sometimes be lower than for the current design, which will increase the likelihood of a false positive result (i.e., the study may fail to exclude a 10 ms QTc effect).
There is a limitation in experience and knowledge in regard to the power of small studies to exclude small QTc effects. The planned study will be conducted at a clinical site with experience executing TQT studies and SAD studies using the same ECG technology as in TQT studies. The precision of QT data generated will vary with the experimental conditions at the site and the used ECG methods, including extraction and interval measurements. Thus, it seems prudent to use the same rigorous approach in Phase 1 as in TQT studies.
In the power calculation for the planned study, we have used the current threshold of regulatory concern, 10 ms. This threshold is conservatively chosen22 and may change in the future to a somewhat higher value. If so, this will obviously increase the power of SAD studies to exclude relevant QTc effects.
It should be underlined that Early QT assessment presents an alternative way of assessing whether a drug has an effect on the QT interval or not. The approach would be applied early in clinical development, often in the FIM study, and it can be expected that <10% of projects continue through Phase 3. Some sponsors may therefore argue that it is more effective from a resource perspective to perform a TQT study later in development when the likelihood of reaching Phase III is higher, whereas others see a need to characterize the QT effect (and other ECG effects) early in development. The results from the TQT study or “Early QT assessment” should be available before initiation of Phase III; therefore, additional costs may be incurred from moving up certain studies, for example, C14, drug‐interaction and special population studies, to ensure that the “worst‐case concentrations” in patients (the highest attainable) have been explored. Early QT assessment should therefore be regarded as an alternative to the TQT study.
The study will be initiated during the first quarter of 2014 and results will be available during the 2nd quarter of 2014. Since these data may have an impact on regulatory guidance, annotated, digital waveforms will be submitted to the FDA ECG warehouse, in‐line with data derived from a TQT study. The full digital, continuous ECG data from the study will then be stored and made available for public research, under a governance structure similar to the CSRC ECG warehouse.23, 24 It is therefore our hope that the data generated from the IQ‐CSRC prospective study will facilitate the process of replacing the TQT study by data generated from studies in routine early clinical development.
REFERENCES
- 1. Jackman WM, Friday KJ, Anderson JL, Aliot EM, Clark M, Lazzara R. The long QT syndromes: a critical review, new clinical observations and a unifying hypothesis. Prog Cardiovasc Dis 1988;31:115–172. [DOI] [PubMed] [Google Scholar]
- 2. Roden DM. Torsade de pointes. Clin Cardiol 1993;16:683–686. [DOI] [PubMed] [Google Scholar]
- 3. Roden DM. Taking the “idio” out of “idiosyncratic”: predicting torsades de pointes. Pacing Clin Electrophysiol 1998;21:1029–1034. [DOI] [PubMed] [Google Scholar]
- 4. Barbey JT, Lazzara R, Zipes DP. Spontaneous adverse event reports of serious ventricular arrhythmias, QT prolongation, syncope, and sudden death in patients treated with cisapride. J Cardiovasc Pharmacol Ther 2002;7:65–76. [DOI] [PubMed] [Google Scholar]
- 5. Honig PK, Wortham DC, Zamani K, Conner DP, Mullin JC, Cantilena LR. Terfenadine‐ketoconazole interaction. Pharmacokinetic and electrocardiographic consequences. JAMA 1993;269:1513–1518. [PubMed] [Google Scholar]
- 6. ICH Harmonized Tripartite Guideline E14 . The Clinical Evaluation of QT/QTc Interval Prolongation and Proarrhythmic Potential for Non‐Antiarrhythmic Drugs. 2005. Available at: http://www.ich.org/fileadmin/Public_Web_Site/ICH_Products/Guidelines/Efficacy/E14/E14_Guideline.pdf. Accessed October 2013.
- 7. Darpo B, Nebout T, Sager PT. Clinical evaluation of QT/QTc prolongation and proarrhythmic potential for nonantiarrhythmic drugs: The International Conference on Harmonization of Technical Requirements for Registration of Pharmaceuticals for Human Use E14 Guideline. J Clin Pharmacol 2006;46:498–507. [DOI] [PubMed] [Google Scholar]
- 8. ICH E14 Questions & Answers . Available at: http://www.ich.org/fileadmin/Public_Web_Site/ICH_Products/Guidelines/Efficacy/E14/E14_Q_As_R1_step4.pdf . Accessed October 2013.
- 9. Bouvy JC, Koopmanschap MA, Shah RR, Schellekens H. The cost‐effectiveness of drug regulation: the example of thorough QT/QTc studies. Clin Pharmacol Ther 2012;91:281–288. [DOI] [PubMed] [Google Scholar]
- 10. Darpo B, Garnett C. Early QT assessment—how can our confidence in the data be improved? Br J Clin Pharmacol 2012;76:642–648. [DOI] [PMC free article] [PubMed] [Google Scholar]
- 11. Rohatagi S, Carrothers TJ, Kuwabara‐Wagg J, Khariton T. Is a thorough QTc study necessary? The role of modeling and simulation in evaluating the QTc prolongation potential of drugs. J Clin Pharmacol 2009;49:1284–1296. [DOI] [PubMed] [Google Scholar]
- 12. Shah RR, Morganroth J. Early investigation of QTc liability: The role of multiple ascending dose (MAD) study. Drug Saf 2012;35:695–709. [DOI] [PubMed] [Google Scholar]
- 13. Zhang J, Machado SG. Statistical issues including design and sample size calculation in thorough QT/QTc studies. J Biopharm Stat 2008;18:451–467. [DOI] [PubMed] [Google Scholar]
- 14. International Consortium for Innovation and Quality in Pharmaceutical Development . Available at: http://www.iqconsortium.com/. Accessed October 2013.
- 15. Cardiac Safety Research Consortium . Available at: https://www.cardiac-safety.org/. Accessed October 2013.
- 16. Bedaquiline . Anti‐infective Drugs Advisory committee meeting November 28, 2012. FDA Briefing document. Available at: http://www.fda.gov/AdvisoryCommittees/CommitteesMeetingMaterials/Drugs/Anti-InfectiveDrugsAdvisoryCommittee/ucm329257.htm. Accessed October 2013.
- 17. Vandetanib . (Caprelsa) Clinical Pharmacology review April 2011. Available at: http://www.accessdata.fda.gov/drugsatfda_docs/nda/2011/022405Orig1s000ClinPharmR.pdf . Accessed October 2013.
- 18. Florian JA, Tornoe CW, Brundage R, Parekh A, Garnett CE. Population pharmacokinetic and concentration–QTc models for moxifloxacin: Pooled analysis of 20 thorough QT studies. J Clin Pharmacol 2011;51:1152–1162. [DOI] [PubMed] [Google Scholar]
- 19. Brendel K, Canini L, Chenel M. Population pharmacokinetic‐pharmacodynamics modelling of the QTc prolongation of moxifloxacin and levofloxacin in healthy volunteers: Selection of the positive control in mandatory QT/QTc studies . Poster presented at 9th PAGE meeting, Berlin, Germany: 2010; Available at: http://www.page-meeting.org/default.asp?abstract=1696. Accessed October 2013. [Google Scholar]
- 20. Garnett CE, Beasley N, Bhattaram VA, Jadhav PR, Madabushi R, Stockbridge N, Tornoe CW, Wang Y, Zhu H, Gobburu JV. Concentration‐QT relationships play a key role in the evaluation of proarrhythmic risk during regulatory review. J Clin Pharmacol 2008;48:13–18. [DOI] [PubMed] [Google Scholar]
- 21. Darpo B, Sager P, Macconell L, Cirincione B, Mitchell M, Han J, Huang W, Malloy J, Schulteis C, Shen L, Porter L. Exenatide at therapeutic and supratherapeutic concentrations does not prolong the QTc interval in healthy subjects. Br J Clin Pharmacol 2013;75:979–989. [DOI] [PMC free article] [PubMed] [Google Scholar]
- 22. Park E, Willard J, Bi D, Fiszman M, Kozeli D, Koerner J. The impact of drug‐related QT prolongation on FDA regulatory decisions. Int J Cardiol 2013;168:4975–4976. [DOI] [PubMed] [Google Scholar]
- 23. Kligfield P, Green CL. The cardiac safety research consortium ECG database. J Electrocardiol 2012;45:690–692. [DOI] [PubMed] [Google Scholar]
- 24. Kligfield P, Green CL, Mortara J, Sager P, Stockbridge N, Li M, Zhang J, George S, Rodriguez I, Bloomfield D, Krucoff MW. The cardiac safety research consortium electrocardiogram warehouse: Thorough QT database specifications and principles of use for algorithm development and testing. Am Heart J 2010;160:1023–1028. [DOI] [PubMed] [Google Scholar]
- 25. Zofran (ondansetron hydrochloride) . US label. Available at: http://www.accessdata.fda.gov/drugsatfda_docs/label/2012/020007s043lbl.pdf. Accessed October 2013.
- 26. Qualaquin (quinine sulphate) . Clinical Pharmacology and Biopharmaceutics Review(s). Available at: http://www.accessdata.fda.gov/drugsatfda_docs/nda/2005/021799s000_ClinPharmR.pdf. Accessed October 2013.
- 27. Qualaquin (quinine sulphate) . US label. Available at: http://www.accessdata.fda.gov/drugsatfda_docs/label/2013/021799s023lbl.pdf. 2013. Accessed October 2013.
- 28. Anzemet (dolasetron mesylate) . US label. Available at: http://www.accessdata.fda.gov/drugsatfda_docs/label/2013/020623s010lbl.pdf,020624s023lbl.pdf. Accessed October 2013.
- 29. Avelox (moxifloxacin hydrochloride) . US label: Available at: http://www.accessdata.fda.gov/drugsatfda_docs/label/2013/021085s057,021277s054lbl.pdf. Accessed October 2013.
- 30. Tikosyn (dofetilide) . US label. Available at: http://www.accessdata.fda.gov/drugsatfda_docs/label/1999/20931lbl.pdf. Accessed October 2013.
- 31. Hulhoven R, Rosillon D, Letiexhe M, Meeus MA, Daoust A, Stockis A. Levocetirizine does not prolong the QT/QTc interval in healthy subjects: results from a thorough QT study. Eur J Clin Pharmacol 2007;63:1011–1017. Accessed October 2013. [DOI] [PubMed] [Google Scholar]
- 32. Xyzal (levocetirizine dihydrochloride) . US label. Available at: http://www.accessdata.fda.gov/drugsatfda_docs/label/2012/022064s024,022157s008lbl.pdf. Accessed October 2013.