Abstract
Background: Right ventricular outflow tract ventricular tachycardia (RVOT‐VT), arrhythmogenic right ventricular cardiomyopathy/dysplasia (ARVC/ARVD), and Brugada syndrome (BrS) were characterized by arrhythmias originating in the right ventricle, and the pathophysiologic mechanism underlying these arrhythmias has not been fully understood.
Methods: This study consisted of 40 subjects, including 20 patients with RVOT‐VT, 10 patients with BrS, and 10 ARVD patients. The parameters on the signal‐averaged electrocardiography (ECG) and the frequency components recorded from the wavelet‐transformed ECG were compared between the three groups. Late potentials were positive in none of the patients with RVOT‐VT, seven of the patients with BrS, and all of ARVD patients.
Results: In Brugada and ARVD patients, the power of high‐frequency components (80–150 Hz) was developed to a greater extent than in RVOT‐VT patients. In the power analysis of the high‐frequency components between BrS and ARVD, the frequency showing the greatest power was significantly higher in ARVD patients than that in BrS patients (145.4 ± 27.9 Hz vs 81.7 ± 19.9 Hz, P < 0.01).
Conclusions: High‐frequency components were developed in ARVD and BrS, but not in RVOT‐VT. The frequency levels showing high power by wavelet analysis obviously differ between ARVD and BrS. Wavelet analysis may provide new insight into unsolved mechanisms in arrhythmogenic right heart disease.
Ann Noninvasive Electrocardiol 2011;16(3):263–269
Keywords: Brugada syndrome, arrhythmogenic right ventricular cardiomyopathy/dysplasia, wavelet transform, electrocardiogram
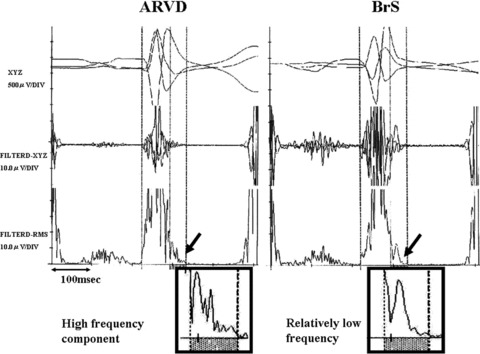
Right ventricular outflow tract ventricular tachycardia (RVOT‐VT), arrhythmogenic right ventricular cardiomyopathy/dysplasia (ARVC/ARVD), and Brugada syndrome (BrS) were characterized by arrhythmias originating in the right ventricle. In patients with ARVD and in some patients with RVOT‐VT and BrS, conduction abnormalities in RV are responsible for the occurrence of ventricular arrhythmias. However, the pathophysiologic mechanism has not been fully understood. Late potentials (LP) on signal‐averaged electrocardiography (SAECG) are usually absent in RVOT‐VT, otherwise often present in ARVD and BrS. To compare conduction abnormality between ARVD and BrS, we focused attention on the morphology of LP. In ARVC, a form of LP consists of high‐frequency components, otherwise comparatively low frequency in BrS (Fig. 1). From this viewpoint, we supposed that frequency analysis would provide useful information to investigate conduction abnormality in these diseases.
Figure 1.

Comparison of the late potentials between ARVC and BrS patients. In ARVC, a form of LP consists of high‐frequency components, otherwise comparatively low frequency in BS.
METHODS
Study Population
A total of 40 subjects were evaluated in this study. RVOT‐VT group (n = 20); eight males, mean age 49.4 ± 13.0 years old; range, 29–72 years old, BrS group (n = 10); all males, mean age 41.9 ± 16.9 years old; range, 18–63 years old, and ARVD group (n = 10); four males, mean age 48.4 ± 11.1 years old; range, 24–65 years old. All patients were referred to Nippon Medical School Main Hospital between December 1, 1996 and December 31, 2007. Patients with bundle branch block, atrioventricular block were not eligible in this study. RVOT‐VT patients were scheduled to undergo radiofrequency ablation. The right ventricular origin was determined by electrocardiographic criteria and confirmed in all cases at electrophysiological study. No structural heart disease was noted at routine checkups. All BrS patients met the diagnostic criteria of the second consensus conference of BrS, 1 including four symptomatic and six asymptomatic patients. Three patients had a family history of sudden death. In three patients, a type‐1 ECG was documented at least once, and in the remaining seven patients, pilsicainide (1 mg/kg over 10 minutes) provoked a type‐1 ECG. All BrS patients underwent electrophysiologic study to assess whether or not ventricular tachycardia (VT) or ventricular fibrillation could be induced. The stimulation protocol included ventricular stimulation from the right ventricular apex and/or outflow tract with a basic cycle length of 600 ms or 400 ms, with a maximum of up to three extrastimuli. The shortest coupling interval of these extrastimuli was limited to 200 ms. No structural heart disease was noted at routine checkups, nor was the presence of triggering factors of cardiac arrhythmias, such as electrolyte abnormalities, or cardiac ischemia, detected in BrS patients. Diagnosis of ARVD was made by the international standardized diagnostic criteria. 2 All patients had RV dilatation and reduced wall motion of the RV and VT (left branch block type). The mean ejection fraction of LV (LVEF) was 48.4%± 12.6%. No patients had a Brugada‐type ECG. Electrophysiologic study was performed in all ARVD patients, and sustained VT was induced in three patients. Implantable cardioverter defibrillators were implanted in these three patients, while seven patients with noninducible under antiarrhythmic drug therapy and were left on sotalol (three patients), amiodarone (two patient), bisoprolol (one patient), and carvediolol (one patient). Clinical characteristics and electrocardiographic parameters were summarized in Table 1.
Table 1.
Clinical Characteristics and Parameters between the Three Groups
| RVOT‐VT ARVD BrS (n = 20) | ARVD (n = 10) | BrS (n = 10) | P‐Value | |
|---|---|---|---|---|
| Age (y/o) | 49.4 ± 13.0 | 48.4 ± 11.1 | 41.9 ± 16.9 | 0.360 |
| Male | 8 | 4 | 10 | 0.006 |
| RVD | 26.6 ± 3.3 | 47.2 ± 6.2 | 29.6 ± 5.1 | <0.001 |
| LVEF | 67.6 ± 6.4 | 48.4 ± 12.6 | 67.0 ± 7.6 | <0.001 |
| Family history | 0 | 2 | 3 | 0.569 |
| Syncope | 5 | 2 | 4 | 0.569 |
| SAECG | ||||
| f‐QRS (ms) | 106.6 ± 7.7 | 137.1 ± 23.6 | 121.1 ± 22.2 | <0.001 |
| RMS40 (μV) | 19.2 ± 7.6 | 6.3 ± 3.2 | 15.8 ± 16.1 | 0.006 |
| LAS40 (ms) | 31.0 ± 5.7 | 60.4 ± 21.6 | 43.4 ± 18.8 | <0.001 |
| LP | 0 | 10 | 7 | <0.001 |
| WTECG | ||||
| P20 | 1082.0 ± 99.2 | 1000.6 ± 123.7 | 1082.5 ± 83.9 | 0.107 |
| P50 | 805.2 ± 100.1 | 730.0 ± 147.6 | 851.0 ± 111.0 | 0.074 |
| P80 | 450.8 ± 67.1 | 546.7 ± 69.2 | 704.6 ± 38.3 | <0.001 |
| P100 | 301.4 ± 88.6 | 566.4 ± 77.4 | 501.4 ± 81.2 | <0.001 |
| P150 | 161.2 ± 56.3 | 570.0 ± 124.6 | 297.5 ± 83.9 | <0.001 |
Data are given as the mean ± standard deviation, number of patients and percent of the number in parentheses. RVOT‐VT = right ventricular outflow tract ventricular tachycardia; ARVC = arrhythmogenic right ventricular cardiomyopathy; BrS = Brugada syndrome; RVD = right ventricular diameter; WTECG = wavelet‐transformed ECG; SAECG = signal‐averaged ECG; f‐QRS = filtered QRS; RMS40= root mean square voltage of the terminal 40 ms; LAS40= low‐amplitude signals <40 μV; LP = late potentilal.
Signal‐Averaged Electrocardiography
SAECG recordings were obtained from the Frank X, Y, and Z leads during sinus rhythm using a Signal Processor DP 1100 (NEC Co. Tokyo, Japan) in all the subjects. A total of 200 cycles were averaged to obtain a noise level of <0.2 μV. The signals were amplified, digitized, averaged, and bi‐directionally filtered with a band‐pass filter at frequencies between 40 and 250 Hz. The filtered QRS duration (fQRSd), root mean square voltage of the terminal 40 ms (RMS40) of the filtered QRS (f‐QRS) complex, and duration of low‐amplitude signals of <40 μV (LAS40) in the terminal f‐QRS complex were measured, respectively. In the present study, LP were considered to be positive if two of the following criteria were met: (1) f‐QRS > 120 ms, (2) RMS40 < 20 μV, and (3) LAS40 > 38 ms.
Wavelet‐Transformed ECG (WTECG)
The continuous wavelet transform was used for the QRS complex analysis using custom‐made software (WAVEROVER, Nihon Bussei, Tokyo, Japan). The wavelet transform is expressed as:
The Gabor function was chosen as the mother wavelet because of its excellent frequency resolution in the high‐frequency bands (50–150 Hz). A low noise body surface ECG was recorded in each subject (sampling 3 kHz) in a shielded room. One representative QRS complex during SR was selected randomly and then transformed into wavelet data at the frequency range of 10–200 Hz. The transformed data were displayed as a power curve at different frequency levels (20–150 Hz) along a time course (Fig. 1). The peak power values at 20 Hz (P20), 50 Hz (P50), 80 Hz (P80), 100 Hz (P100), and 150 Hz (P150) were measured, respectively. The total power value at each frequency level was calculated as the integrated area below each frequency line and was compared between the three groups.
Statistical Analysis
Data are expressed as mean ± standard deviation. Comparisons between groups were performed using one‐way analysis of variance. Categorical data were compared using chi‐square analysis. A P‐value < 0.05 was considered significant.
RESULTS
Signal‐Averaged Electrocardiography
LP were positive in none of the patients with RVOT‐VT, seven of the patients with BrS, and all of ARVD patients. f‐QRS and LAS40 were significantly longer, and RMS40 was lower in the BrS and ARVD group than in the RVOT‐VT group (Table 1).
Wavelet‐Transformed ECG
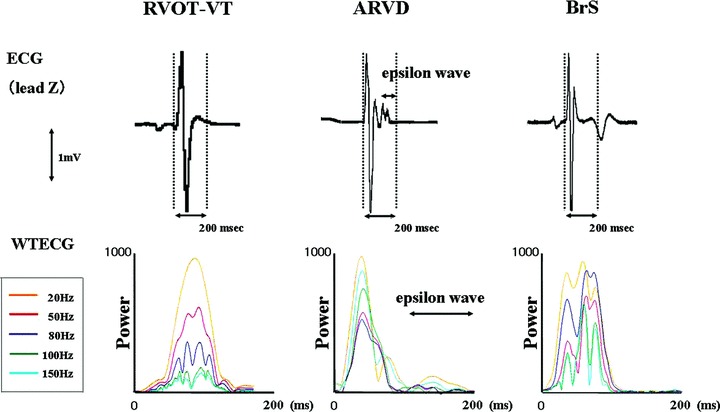
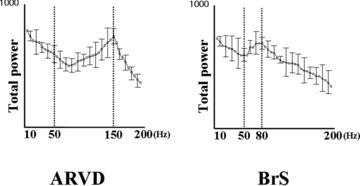
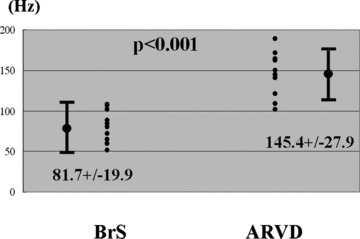
Representative WTECGs in each group are shown in Figure 2. High‐frequency components (80–150 Hz) are developed in both BrS patient and ARVD patient, but not in RVOT‐VT patient. In BrS patient, they were developed mainly at 80 Hz otherwise mainly at 150 Hz in ARVD patient. Particularly at the timing of the appearance of epsilon wave, the power of high‐frequency levels was increased in ARVD patient. The mean value of P80 was significantly greater in the BrS group than in the ARVD group. On the other hand, that of P150 was significantly greater in the ARVD group than in the BrS group (Table 1). We plotted the total power in the QRS complex against the frequency component (Fig. 3). Within the level of high‐frequency range (50–200 Hz), the dominant frequency was approximately 80 Hz in the BrS group, whereas approximately 150 Hz in the ARVD group. The mean frequency of the high‐frequency peak in the BrS group was 81.7 ± 19.9 Hz, otherwise 145.4 ± 27.9 Hz in the ARVD group (Fig. 4).
Figure 2.

Comparison of the ECGs from representative cases from both groups showing lead Z (upper panel) and the WTECG (lower panel). High‐frequency components are developed in both BrS patient and ARVC patient. They were developed mainly at 80 Hz in BrS patient, otherwise mainly at 150 Hz in ARVC patient. In the WTECG, the orange, red, gray, green, and light blue lines indicate 20, 50, 80, 100, and 150 Hz, respectively.
Figure 3.

Comparison of the total power value for each frequency level between the BrS group (right panel) and ARVC group (left panel). In the analysis section for values 50 Hz, the frequency level showing the greatest power was about 80 Hz in the BrS group, while 150 Hz in the ARVC group.
Figure 4.

Comparison of high‐frequency levels showing the greatest power between BrS patients and ARVC patients. The mean frequency of this high‐frequency peak in the BrS group was 81.7 ± 19.9 Hz, otherwise 147.9 ± 26.3 Hz in the ARVC group.
DISCUSSION
Major Findings
In the present study, we found that high‐frequency components are developed in both BrS patients and ARVD patients but not in RVOT‐VT patients. In addition, the frequency properties of WTECG were different between BrS and ARVD. The level of high‐frequency components that most preferentially developed in the BrS group was at approximately 80 Hz, otherwise 150 Hz in ARVD.
High‐Frequency Components in the WTECG
In general, LP are low‐amplitude, high‐frequency signals at the terminal portion of QRS complex, which were thought to reflect slow and fragmented myocardial conduction. These high‐frequency components are considered to exist not only at the terminal portion but in the middle portion of QRS complex. However, they cannot be observed with SAECG because they are masked by low‐frequency components having potent power. Wavelet analysis is a novel time‐frequency technique, which is able to detect transient changes of electrocardiogram even if they are hidden within the high‐gain QRS complex. High‐frequency components in the QRS complex detected by this technique have been considered to reflect conduction abnormality hidden in the QRS complex, which were observed in patients with structural heart diseases, such as prior myocardial infarction, 3 hypertrophic, or dilated cardiomyopathy, 4 , 5 , 6 and we previously reported the diagnostic importance of WTECG in BrS. 7 As expected, high‐frequency components are developed in both BrS and ARVC patients, but not in RVOT‐VT patients.
Differential Diagnosis between RVOT‐VT and ARVC
The mechanism responsible for RVOT‐VT is possibly considered as cyclic adenosine monophosphate‐mediated triggered activity in the absence of structural heart disease. 8 ARVD is an inherited myocardial disorder characterized by right ventricular dysfunction due to fibrofatty replacement of myocardium, leading to ventricular arrhythmias and progressive RV failure.
Actually, it is not hard to differentiate between RVOT‐VT and ARVD because structural abnormalities on echocardiography or angiography are usually detected in ARVD patients, but not in RVOT‐VT patients. However, some investigators have claimed that RVOT‐VT is a localized form of cardiomyopathy. Endomyocardial biopsy has detected structural abnormalities in patients with RVOT‐VT. 9 Furthermore, magnetic resonance imaging has been reported to detect structural abnormalities in 54% of patients with RVOT‐VT. 10 Therefore, the differential diagnosis between milder form or early stage of ARVD and RVOT‐VT is still challenging as there is no established technique to discriminate these conditions. Although milder form or early stage of ARVD was not included in the present study, the presence of LP could discriminate well between RVOT‐VT and ARVD patients (0% vs 100%). In addition, high‐frequency components were prominent within the QRS complex in ARVC, not in RVOT‐VT patients. These results suggested that delayed conduction of ventricular myocardium would not be present in RVOT‐VT, and may explain the mechanism of VT is not reentry.
Comparison of Conduction Abnormality between ARVD and BrS
The BrS is an inherited cardiac disorder characterized by right bundle‐branch block, ST‐segment elevation in the precordial leads (V1–V3) and sudden cardiac death. The theoretical background of BrS is based on experimental studies revealing the role of the prominent transient outward potassium current in the cells of the epicardial layer in the inhomogeneity of repolarization in the right ventricular outflow tract, leading to ST elevation in the right precordial leads. 11 Currently, depolarization abnormality is also considered to be associated with BrS because the genetic abnormalities that cause BrS have been associated with mutations in SCN5A gene, which encodes for the alpha‐subunit of the cardiac sodium channel. 12 SCN5A mutations cause a loss of function of the channel that reduces the inward sodium current, leading to conduction delay and induction of the substrate for reentry. 13 As already mentioned, ARVD is an inherited cardiac disorder characterized by right ventricular dysfunction and ventricular arrhythmia. ARVD also can possibly cause ST elevation in right precordial leads, and Peters et al. showed that systematic ajmaline challenge test could provoke coved‐type ST elevation in right precordial leads in 16% of ARVD patients. 14 Therefore, differential diagnosis between BrS and ARVC with ST elevation in right precordial leads and minimal structural abnormalities is extremely difficult. Some investigators have claimed that BrS is a form of right ventricular cardiomyopathy, because morphological and histological abnormalities are found in a part of BrS patients. 15 , 16 These findings suggest an overlap between BrS and ARVD. Although currently the concept that BrS and ARVD are part of a clinical spectrum has been advanced, ARVD and BrS are considered to be distinct clinical profiles and the genetic predisposition.
In this study, we assessed frequency properties of QRS complex in both diseases using wavelet transform analysis. As we expected from the morphology of LP in both diseases, the frequency properties of WTECG were different between BrS and ARVD. To date, the difference of high‐frequency band of this analysis has not been discussed in detail. In the present study, the level of high‐frequency components that most preferentially developed in the BrS group was at approximately 80 Hz, otherwise 150 Hz in ARVD. The difference of frequency band on WTECG might reflect the variation in the myocardial substrate.
One possible mechanism of LP in patients with BrS is conduction delay in the ventricle as documented in other structural heart diseases. Nevertheless, the mechanism of LP in BrS is not fully understood. Antzelevitch suggested that concealed occurrence of phase 2 reentry may contribute to the generation of LP in SAECG. 17 Hence, the dominant frequency 80 Hz in BrS might reflect the second upstroke of the epicardial action potential leading to local phase 2 reentry. However, high‐frequency components were developed not only at the terminal portion but in the middle portion of QRS complex, therefore it is more likely that 80 Hz reflects dominant frequency of conduction delay. As previously indicated, pathology and histology have demonstrated fibrofatty replacement of right ventricular myocardium in patients with ARVD, the frequency of 150 Hz is considered to reflect abnormal deporalization caused by fibrofatty tissue. From a similar point of view, Furushima et al. assessed the presence of LP and the fQRSd in V2 and V5 using a high‐pass filter of 40 Hz (fQRSd:40) and 100 Hz (fQRSd:100). They reported that the fQRSd in the high‐pass filter at 100 Hz was much shorter in BrS than that in ARVD, but similar in both of them at 40 Hz, suggesting characteristics of LP in BrS is different from that in ARVD. 18 Although the mechanism of high‐frequency components remains obscure especially in BrS patients, our results may provide new insight into the basis of these diseases.
Study Limitations
The current study has some limitations. First, the major limitation of this study is the small number of the patients studied. There were only four symptomatic patients with BrS. Further study in larger groups of patients including symptomatic BrS is required. Second, we did not perform genetic assessment. Therefore, the difference between carriers and noncarriers of mutated genes could not be discussed.
CONCLUSIONS
Abnormal high‐frequency components are developed in both BrS patients and ARVC patients but not in RVOT‐VT patients. The frequency levels showing high power by wavelet analysis obviously differ between ARVC and BrS. Wavelet analysis may provide new insight into unsolved mechanisms in arrhythmogenic right heart disease.
Acknowledgments
Acknowledgments: The authors thank Michio Ogano, M.D., Reiko Okazaki, M.D., Akira Ueno, M.D., Katsuhiko Tateoka, M.D., Tsutomu Horie, M.D., Hiroshi Taniguchi, M.D., Junko Abe, M.D., Yasuhiro Hirasawa, M.D., Yu‐ki Iwasaki, M.D., Meiso Hayashi, M.D., Mitsunori Maruyama, M.D., Yasushi Miyauchi, M.D. for technical assistance during the electrophysiologic studies.
Potential conflicts of interests: none. Financial support: none.
REFERENCES
- 1. Antzelevitch C, Brugada P, Borggrefe M, et al Brugada syndrome. Report of the second consensus conference. Endrosed by the Heart Rhythm Society and the European Heart Rhythm Association. Circulation 2002;111:659–670. [DOI] [PubMed] [Google Scholar]
- 2. McKenna RJ, Thiene G, Nava A, et al Diagnosis of arrhythmogenic right ventricular dysplasia/cardiomyopathy. Task Force of the Working Group Myocardial and Pericardial Disease of the European Society of Cardiology and of the Scientific Council on Cardiomyopathies of the International Society and Federation of Cardiology. Br Heart J 1994;71:215–218. [DOI] [PMC free article] [PubMed] [Google Scholar]
- 3. Morlet D, Peyrin F, Desseigne P, et al Wavelet analysis of high‐resolution signal‐averaged ECGs in postinfarction patients. J Electrocardiol 1993;26:311–320. [DOI] [PubMed] [Google Scholar]
- 4. Englund A, Hnatkova K, Kulakowski P, et al Wavelet decomposition analysis of the signal averaged electrocardiogram used for risk stratification of patients with hypertrophic cardiomyopathy. Eur Heart J 1998;19:1383–1390. [DOI] [PubMed] [Google Scholar]
- 5. Yi G, Hnatkova K, Mahon NG, et al Predictive value of wavelet decomposition of the signal‐averaged electrocardiogram in idiopathic dilated cardiomyopathy. Eur Heart J 2000;21:1015–1022. [DOI] [PubMed] [Google Scholar]
- 6. Maehara K, Kokubun T, Awano N, et al Detection of abnormal high‐frequency components in the QRS complex by the wavelet transform in patients with idiopathic dilated cardiomyopathy. Jpn Circ J 1999;63:25–32. [DOI] [PubMed] [Google Scholar]
- 7. Yodogawa K, Morita N, Kobayashi Y, et al High‐frequency potentials developed in wavelet‐transformed electrocardiogram as a novel indicator for detecting Brugada syndrome. Heart Rhythm 2006;3:1436–1444. [DOI] [PubMed] [Google Scholar]
- 8. Lerman B, Belardinelli L, West G, et al Adenosine‐sensitive ventricular tachycardia: Evidence suggesting cyclic AMP‐mediated triggered activity. Circulation 1986;74:270–280. [DOI] [PubMed] [Google Scholar]
- 9. Morgera T, Salvi A, Alberti E, et al Morphological findings in apparently idiopathic ventricular tachycardia: An echocardiographic, hemodynamic and histologic study. Eur Heart J 1985;6:323–334. [DOI] [PubMed] [Google Scholar]
- 10. O’Donnell D, Cox D, Bourke J, et al Clinical and electrophysiological differences between patients with arrhythmogenic right ventricular dysplasia and right ventricular outflow tract tachycardia. Eur Heart J 2003;24:801–810. [DOI] [PubMed] [Google Scholar]
- 11. Yan GX, Antzelevitch C. Cellular basis for the Brugada syndrome and other mechanisms of arrhythmogenesis associated with ST‐segment elevation. Circulation 1999;100:1660–1666. [DOI] [PubMed] [Google Scholar]
- 12. Chen Q, Kirsch GE, Zhang D, et al Genetic basis and molecular mechanism for idiopathic ventricular fibrillation. Nature 1998;392:293–295. [DOI] [PubMed] [Google Scholar]
- 13. Yokokawa M, Noda T, Okamura H, et al Comparison of long‐term follow‐up of electrocardiographic features in Brugada syndrome between the SCN5A‐positive probands and the SCN5A‐negative probands. Am J Cardiol 2007;100:649–655. [DOI] [PubMed] [Google Scholar]
- 14. Peters S, Trümmel M, Denecke S, et al Results of ajmaline testing in patients with arrhythmogenic right ventricular dysplasia‐cardiomyopathy. Int J Cardiol 2004;95:207–210. [DOI] [PubMed] [Google Scholar]
- 15. Frustaci A, Priori SG, Pieroni M, et al Cardiac histological substrate in patients with clinical phenotype of Brugada syndrome. Circulation 2005;112:3680–3687. [DOI] [PubMed] [Google Scholar]
- 16. Catalano O, Antonaci S, Moro G, et al Magnetic resonance investigations in Brugada syndrome reveal unexpectedly high rate of structural abnormalities. Eur Heart J 2009;30:2241–2248. [DOI] [PubMed] [Google Scholar]
- 17. Antzelevitch C. Late potentials and the Brugada syndrome. J Am Coll Cardiol 2002;39:1996–1999. [DOI] [PubMed] [Google Scholar]
- 18. Furushima H, Chinushi M, Okamura K, et al Comparison of conduction delay in the right ventricular outflow tract between Brugada syndrome and right ventricular cardiomyopathy: Investigation of signal average ECG in the precordial leads. Europace 2007;9:951–956. [DOI] [PubMed] [Google Scholar]


