

SUMMARY
Intrathymic T-cell development converts multipotent precursors to committed pro-T cells, silencing progenitor genes while inducing T-cell genes, but the underlying steps have remained obscure. Single-cell profiling was used to define the order of regulatory changes, employing single-cell RNA-seq for full transcriptome analysis, plus multiplex single-molecule fluorescent in situ hybridization (seqFISH) to quantitate functionally important transcripts in intrathymic precursors. Single-cell cloning verified high T-cell precursor frequency among the immunophenotypically-defined “early T-cell precursor” (ETP) population; a discrete committed granulocyte precursor subset was also distinguished. We established regulatory phenotypes of sequential ETP subsets; confirmed initial co-expression of progenitor- with T-cell specification genes; defined stage-specific relationships between cell-cycle and differentiation; and generated a pseudotime model from ETP to T-lineage commitment, supported by RNA velocity and transcription factor perturbations. This model was validated by developmental kinetics of ETP subsets at population and clonal levels. The results imply that multilineage priming is integral to T-cell specification.
Keywords: T cell development, clonal development assay, single-cell RNA-seq, transcription factors, single-molecule in situ hybridization, developmental trajectory, model validation, RNA velocity, multilineage priming
Graphical Abstract
eTOC
The earliest regulatory events initiating T-cell development have been obscure. Here, complementary single-cell analysis methods display the regulatory gene combinations acting within individual early pro-T cells, establish the sequence of transcriptome changes, and validate their relationships to developmental potential.
Introduction
Generation of T cells begins in postnatal mice as multipotent precursor cells enter the thymus from bone marrow and undergo multiple rounds of proliferation and differentiation events before T lineage commitment (Porritt et al., 2003; Rothenberg et al., 2008; Taghon et al., 2005; Yui et al., 2010). While many key regulators of T cell specification and commitment are known (Yui and Rothenberg, 2014), the types of thymic T cell progenitors and the steps that they undergo to initiate commitment remain unclear.
Early T-cell progenitors (ETPs), cells double-negative (DN) for CD4 and CD8 that are Kit+ CD44+ CD25−, represent the earliest defined stage in each cohort of mouse thymocytes. After ~1 wk of proliferation and differentiation under the influence of environmental signals, including Notch ligands and cytokines from the thymic stroma, ETPs asynchronously progress into the DN2a stage, marked by upregulation of surface CD25 (Il2ra) (Porritt et al., 2003)(Fig. 1a). Commitment follows in a separate step, coinciding with up-regulation of transcription factor Bcl11b and global changes in chromatin landscapes (Hu et al., 2018; Ikawa et al., 2010; Kueh et al., 2016; Li et al., 2010). However, ETPs themselves are poorly characterized before they progress to DN2a stage. While single-cell colony assays show that many ETPs are individually multipotent as well as T-cell competent (Bell and Bhandoola, 2008; Wada et al., 2008), none of the ETP markers are exclusive to T-cells, so “ETPs” could also include committed non-T-lineage precursors. In addition, T-cell precursors can migrate to the thymus from different hematopoietic precursor states (CLP and LMPP)(Saran et al., 2010) (Fig. 1a). Thus, in a ‘snapshot’ of single ETP transcriptomes, there could be heterogeneity due to different input origins, different developmental stages, and/or contamination with cells committed to alternative fates.
Figure1.

High T-cell precursor frequency in ETP cells and bulk population gene expression comparison with DN2a cells. a) Schematics of early T-cell developmental stages, checkpoints, associated key developmental markers, and previously unresolved questions addressed in this study. b) Diagram of clonal culture and imaging methods for following the development of individual sorted ETP cells and a representative false color image of the progeny of an ETP clone (top). Histogram plots showing the numbers of ETP clones with different percentages of CD25+ (magenta) or Bcl11b+ (cyan) cells on day 6 of culture (n = 66 viable clones) (bottom). c-d) Heatmaps of bulk RNAseq measurements on Flt3+ and Flt3− ETP and Bcl11b− (uncommitted) and Bcl11b+ (committed) DN2a sorted populations. Color scales indicate raw expression levels as log(FPKM+0.1), without row normalization. Some samples were sequenced with pre-amplification, indicated (o) (see Methods). c) Clustered expression heatmap of bulk RNAseq measurements for genes differentially expressed between all ETP and committed Bcl11b+ DN2a cells (n≥3, adj. pval<0.05, fold change ≥ 2 either way, also see Table S1). Representative non-T or stem/progenitor genes are labeled. d) Selected key genes involved in T development, on the same populations as in (c).
The expression of important regulators in early T-cell development has mostly been studied in bulk populations. Notch1 signaling (Besseyrias et al., 2007; Pui et al., 1999; Radtke et al., 1999) and transcription factors GATA3 and TCF1 (encoded by Tcf7) play indispensable roles to establish T-cell identity from the earliest stages (García-Ojeda et al., 2013; Germar et al., 2011; Hosoya et al., 2009; Schilham et al., 1998; Scripture-Adams et al., 2014; Ting et al., 1996; Weber et al., 2011). With Notch1, Gata3, and Tcf7, other regulators more widely shared (Myb, Gfi1, Runx1, Tcf3) are also essential for cells starting the T-cell pathway. Expression of these genes is readily detectable in the ETP population by bulk RNA analysis, but in an unknown fraction (De Obaldia and Bhandoola, 2015; Mingueneau et al., 2013; Yui and Rothenberg, 2014; Yui et al., 2010; Zhang et al., 2012). Further, many legacy “non-T” genes, associated with “stemness” and/or non-T-lineage fates, are also expressed at low levels in early pro-T cell populations, including several with potential gene network interactions with the “T-cell” regulators (Longabaugh et al., 2017; Yui and Rothenberg, 2014). It is unclear if they are an integral part of the T-lineage program or merely expressed in contaminating cells. If the former, the expression of stem and progenitor “non-T” genes may be indicators of multi-lineage priming and/or important regulatory network relationships between the declining stem cell program and ongoing T-cell specification. The single-cell expression patterns of these genes relative to T-cell genes are essential to elucidate the significance of their expression in T cell development.
Single cell transcriptional profiling by RNAseq (scRNA-seq) has transformed our understanding of hematopoietic differentiation and heterogeneity (Boudil et al., 2013; Giladi et al., 2018; Ishizuka et al., 2016; Karamitros et al., 2018; Knapp et al., 2018; Olsson et al., 2016; Paul et al., 2015; Pina et al., 2012; Tusi et al., 2018; Velten et al., 2017; Zandi et al., 2012; Zheng et al., 2018), providing nominally unbiased full-transcriptome information and effectively separating distinct cell types within complex populations. However, in most scRNA-seq applications the accuracy and robustness of measurement are biased towards highly expressed genes, which mostly characterize already-diverged developmental end states. Here, the goal is to resolve a continuum of changing transcriptome states within a developmental pathway, and relate them to changes in the controlling regulatory network state. This demands accurate, statistically robust quantitation of regulatory genes encoding key transcription factors (TFs), which are often expressed at low RNA copy numbers per cell. Therefore, we have taken advantage of recent advances in single-molecule fluorescence in situ hybridization (Raj et al., 2006), which visualizes and counts individual mRNA transcripts directly in individual cells at very high sensitivity. Recently, a version incorporating a temporal barcoding scheme, “seqFISH”, has been developed that uses a limited set of fluorophores but can detect hundreds to thousands of distinct sequences in the same cells (Lubeck et al., 2014; Shah et al., 2016a, 2016b), and another similar strategy, “merFISH”, has also been described (Chen et al., 2015). We have used the highly sensitive seqFISH technique to quantify transcripts of a curated panel of 65 regulatory and developmental state marker genes in pro-T cells.
Thus, combining droplet-based scRNA-seq, deep-sequenced whole-transcript scRNA-seq, and seqFISH for key regulatory genes, together with developmental assays of sorted subsets and clones from sorted founders, we have characterized the sequence of gene expression transitions in early intrathymic mouse T-cell precursors and regulatory gene dynamics of T-cell specification. Our results show an unexpectedly complex, multistep progression through which the cells shed stem cell characteristics and approach T-cell lineage commitment. The results give new insights into the transition from multipotency to commitment and how it is controlled.
Results
Single-cell developmental competence and bulk population phenotype of ETPs
Broad outlines of mouse T-cell development are well-studied, but the initial events upon entry of T-cell precursors into the thymus remain obscure. Most uncertain are events that occur within the ETP population and in transition to DN2a. While later stages are clearly defined as shown in Fig. 1a, ETPs are rare, individually multipotent and poorly separable by flow cytometry from other, irrelevant multipotent precursors. However, vital regulatory events including the exclusion of B-cell potential (Heinzel et al., 2007) and epigenetic priming of the cells for later commitment (Kueh et al., 2016; Ng et al., 2018) occur during the ETP stage(s). Thus, we have investigated whether different precursors contribute functional ETP starting state(s); their precise sequence of regulatory state changes leading to T-lineage commitment; and whether they develop by single or branched pathways. In Fig. S1 a–b, we summarize the logical sequence of questions addressed, the experimental approaches, and the data- handling pipeline.
To characterize the earliest mouse thymic T-cell progenitors through T-lineage commitment, we used fluorescence-activated cell sorting (FACS) of DN cells to isolate the ETP and DN2a subsets (cf.1a). Only a tiny fraction of total thymocytes (<0.01%) at steady state are uncommitted ETP and DN2a cells, distinguished from all others by their expression of growth factor receptor c-Kit. Expression of a Bcl11b-YFP knock-in reporter (Kueh et al., 2016) that distinguishes uncommitted (YFP−) from newly committed (YFP+) DN2a cells was used to mark the commitment milestone (Fig. 1b,c; Table S1). Another growth factor receptor, Flt3, has been reported to characterize the least mature ETPs (Ramond et al., 2014; Sambandam et al., 2005), and in many experiments we used it to subdivide ETPs either by FACS or in silico.
To estimate the fraction of “ETPs” that actually possess T-lineage developmental potential, we carried out single-cell clonal culture experiments. Individual ETP cells were plated in microwells and tracked by live imaging in T-cell development culture conditions to determine how many could generate progeny that reach DN2 stage and undergo commitment (Fig. 1b, top, see Methods). Of 78 founder ETPs, 66 survived and were tracked for 6 days. Almost all clones generated cells expressing CD25 and Bcl11b-YFP by day 6 (Fig. 1b, bottom). Two of the 66 clones only produced small non-T lineage cells resembling granulocytes, consistent with alternative lineage affiliation, as discussed below. Thus, >90% of viable clonogenic ETPs possessed T-lineage precursor activity.
Bulk RNA expression patterns showed that ETP populations were clearly distinct from DN2a populations, with many of the differences reflecting downregulation of ETP-expressed genes in DN2a (Fig. 1c,d). ETP populations expressed many characteristic “non-T” genes, including genes expressed in mature granulocytes, macrophage, dendritic cells, NK cells, and stem cells but not in mature T cells (www.immgen.org)(Fig. 1c), consistent with previous bulk RNA expression studies (Mingueneau et al., 2013) [rev. by (Rothenberg et al., 2016; Yui and Rothenberg, 2014)]. Both uncommitted and committed DN2a cells expressed lower levels of multipotent progenitor-associated genes Flt3, Lmo2, and Mef2c than ETPs, although the DN2a cells continued to express another multipotency-associated gene, Spi1 (encoding transcription factor PU.1)(Fig. 1c, d). In contrast, sorted Flt3+ and Flt3− ETP populations appeared similar, and both expressed the essential T-cell regulatory genes Gata3 and Tcf7, implying that at least some ETPs have started T-lineage specification (Fig. 1d). Such population-level analysis raised the question of how many substates were comprised in ETPs, how homogeneously cells progressed through them, and which states reflected the presence of contaminating cells with no T-cell potential.
To determine the sequence of developmental changes in these earliest pro-T cells, we FACS-purified Kithigh thymocytes across the ETP-DN2 developmental continuum, and analyzed their single-cell transcriptomes and also their developmental potentials (Fig. S1c). To anchor the developmental direction, for most analyses we also added a small number of purified committed DN3 cells (Fig. S1c). The transcriptomes of these samples were defined by three methods: seqFISH, whole-transcriptome 3’-end biased sequencing (10X Chromium), and whole-transcriptome full-transcript sequencing (Fluidigm C1-SmartSeq2). Results from these methods were highly concordant but highlighted different aspects of the gene expression programs.
Sensitive monitoring of developmentally important regulatory genes in single cells by seqFISH
Expression in ETP populations of the essential T-cell regulatory genes, Gata3 and Tcf7, appeared in accord with their high clonogenic T-cell precursor frequency overall, but, single-cell methods were needed to determine which ETP subsets activate these T-cell regulators. First, we sought to determine whether the ETPs expressing characteristic multipotent progenitor-associated regulatory genes included the individual cells entering the T-cell pathway. However, as shown in Table S1 and in previous studies, regulatory genes have bulk RNAseq signals measured at <10 FPKM, below the robust detection limit of common single cell approaches (also see below). We therefore applied a targeted seqFISH approach, focused on a curated set of regulatory and lineage-informative genes. Most of these 65 genes are known to be functionally significant in early T or multipotent progenitor cells (Hosokawa et al., 2018a; Rothenberg et al., 2016; Yui and Rothenberg, 2014), while others are distinctive markers for stages in T and non-T pathways (genes and criteria for selection shown in Table S2). Probes for 54 genes with low to medium expression level were used in barcoding rounds of seqFISH with hybridization chain reaction (HCR seqFISH), followed by sequential rounds of non-barcoding HCR single molecule FISH (HCR smFISH) to detect the remaining genes, including highly expressed genes, controls, and genes with shorter transcripts, and finally followed by immunofluorescent staining (Fig. 2a; see STAR Methods). Analyses used sorted populations of ETP-DN2a from mice of 3 different ages (4 wk, 2874 cells; 5 wk, 4413 cells; 8 wk, 1736 cells)(Fig. S2a, c), plus similar numbers of DN3s from the same animals imaged in separate lanes of hybridization-cells.
Figure 2.

High sensitivity measurement and coexpression of key regulatory genes in single early pro-T cells using seqFISH. a) Experimental design for seqFISH analysis with FACS enriched cells. b) Transcript distributions of genes in thymic ETP (cKithigh, Kit transcript ≥5, Il2ra transcript ≤3, N=890) and DN2 (cKithigh, Kit transcript ≥5, Il2ra transcript >3, n=1984) cells, in cells from 4 week-old-animals as detected by seqFISH. c) Gene-Gene Pearson distance heatmap of co-expression of genes measured based on 2963 ETP-DN2 cells plus 1587 DN3 cells. d-e) Clustering analysis of seqFISH data for 4550 cells across ETP-DN3 stages. The Smart Local Moving (SLM) algorithm was used based on PC 1–6 of size-normalized data for 65 genes. Heatmap of genes enriched in expression in each sub-cluster, ordered based on connectivity in tSNE and reflecting developmental progression (Wilcoxon rank sum test with threshold of 0.2 and minimum fraction of expressing cells ≥0.2 using Seurat 2). e) Annotated tSNE display generated using PC1–6, colored by clusters. f) Pair-wise scatter plots, overlaid with color-coded density contours, of copy numbers of transcripts for Tcf7 against those of T specification genes Gata3 and Bcl11b and of “non-T” gene Mpo and growth-control gene Pim1. ETP and DN2 cells are defined as in (b), displayed on sqrt+1 scale.
As detailed in Fig. S2a–c, seqFISH measurements were sensitive and reproducible across all three ages tested in independent experiments without batch correction. It faithfully detected critical genes like Tcf7 and Notch1 that were hard to detect consistently in ETPs with 10X Chromium scRNA-seq (Fig. S2b, d). Furthermore, protein and seqFISH RNA expression (c-Kit, PU.1 and TCF-1 protein vs. Kit, Spi1 and Tcf7) correlated in the same cells (Fig. S2e,f).
SeqFISH reveals co-expression of stem/progenitor and T-cell regulators in individual ETPs
SeqFISH confirmed regulatory state differences between Kit-high cells categorized as ETP or DN2 based on expression of Il2ra (CD25). DN2s expressed lower levels of multiple ETP-associated genes (Flt3, Cd34, Mpo, Lmo2) while a subset expressed much higher levels of the commitment-associated gene Bcl11b (Fig. 2b). Pairwise coexpression patterns of the seqFISH gene set among all ETP-DN3 cells sampled (Fig. 2c) clearly distinguished a “T-associated” group of genes, including a subset highly coexpressed in DN3s (Ptcra, Rag1, Cd3e, Cd3g, Spib, Tcf12, and Lef1), from at least two other gene groups containing coexpressed ‘Stem and Progenitor’ genes (Kit, Spi1, Lyl1, Bcl11a, Runx3, Pim1, Erg, Cd34, Hhex, Lmo2, and Cd44). Each of these stem/progenitor groups also contained genes normally associated with non-T cells (e.g. Mpo, Irf8, Pdgfrb) (Fig. 2c). In addition, other separate gene subgroups contained Gata3 and Ikaros (Ikzf) family TFs, plus their interaction partners found in T and innate-lymphoid cells (Zfpm1, Gfi1, and Zbtb16). These “T/ILC” groups of genes showed intermediate correlation both with the stem/progenitor genes and with the T-associated genes.
The seqFISH results enabled the cells to be resolved into 9 clusters (Fig. 2d,e), based on high-dimensional analysis using Smart Local Moving (SLM) clustering (Waltman and van Eck, 2013). Clusters were provisionally ordered by known “endpoint” genes, starting from the earliest ETP cells, identified by Flt3 and Cd34 enrichment, to committed DN3 cells, marked by high Ptcra, Cd3e and Cd3g. This initial clustering was broadly consistent with results from previous bulk RNA analysis. However, it revealed that progenitor- or alternative-lineage genes were not all co-expressed, but instead displayed distinct although overlapping patterns. Among the earliest cells, for example, Lmo2 and Flt3 were co-expressed in a more restricted developmental pattern (mainly cluster 2), than Kit and Spi1. Cells in DN3 split into 3 clusters, two of which represented DN3a stages with high levels of Bcl11b, Ets1, Ptcra, Cd3g, Cd3e and Rag1 (clusters 6 & 0, mainly distinguished by different levels of Tcf7). The third DN3 cluster (cluster 7) could be identified as DN3b cells that had passed the β-selection checkpoint based on T-cell receptor expression (see Fig. 1a), with enrichment of Lef1, Id3, Tcf7, and Pgk1 but downregulation of DN3a genes. Only one small ETP subpopulation, low in Tcf7 expression (Fig. 2d,e, cluster 8) and highly coexpressing Mpo, Spi1, Cebpa, Lmo2 and Irf8 but not other progenitor genes, appeared to be discontinuous from the others. This outgroup population was seen in every analysis we performed, and is identified below. Note that, in each of the seven clusters spanning Flt3+ ETP to DN3a, the expression of key regulatory genes such as Spi1, Tcf7, and Bcl11b was relatively homogeneous; 89–100% of cells expressed >3 copies/cell in relevant clusters (Fig. S2g).
Given the distinctive expression of progenitor-associated genes among ETPs, a central question was whether the cells expressing these genes are representative of the cells entering the T-cell program. We used seqFISH to assess which legacy stem and progenitor genes are coexpressed with Gata3 and Tcf7 in individual cells. Gata3 activation began in ETPs with varying levels of Tcf7 transcripts, and became concordant in DN2-DN3 stages (Fig. 2f). As expected (Kueh et al., 2016), the T-lineage commitment gene Bcl11b was activated exclusively in cells that express Tcf7, and almost completely within the DN2 stage (Fig. 2f).
To ask directly how ETPs expressing Notch-induced Gata3 and/or Tcf7 differ from ETPs not expressing these genes, we compared the transcript counts of all other seqFISH genes between ETP cells with and without expression of Gata3 (>10 transcripts vs. ≤3 transcripts) and/or Tcf7 (>20 transcripts vs. ≤5 transcripts)(Table S3). The seqFISH results confirmed that ETPs activating Gata3 and/or Tcf7 were markedly different from committed, Bcl11b-expressing DN2s in their expression levels of >30 genes (p values <10−6, two-tailed T test, unequal variances). However, ETPs expressing Gata3 and/or Tcf7 differed very little from ETPs lacking expression of both Gata3 and Tcf7. ETPs with and without Gata3 and/or Tcf7 expression were statistically indistinguishable in their expression of Notch1, or of stem/progenitor-associated genes Spi1, Cd34, Mpo, Mef2c, or Bcl11a, which were expressed by the great majority of both (Table S3). Only Gfi1b and Runx3 differed with p <10−6, while Flt3 and Lmo2 were slightly lower in expression, and T-promoting genes, including Hes1 and Ets1, were slightly higher in the cells expressing Gata3 and/or Tcf7 than in those without Gata3 or Tcf7. Overall, these seqFISH results show that there is continuity between the stem/progenitor gene expression patterns in those individual ETPs starting T-cell development and most other ETPs.
Individual ETPs in fact spanned boundaries of the gene-set co-expression clusters seen in the overall ETP—DN3 population (cf. Fig. 2c). For example, the myeloid-associated gene, Mpo, encoding myeloperoxidase, was expressed at higher levels in ETPs than either Gata3 or Bcl11b, but a major fraction of Mpo-expressing cells also clearly expressed Tcf7 (>20 copies/cell) (Fig. 2f). The growth-promoting gene Pim1, which marked intermediate clusters (Fig. 2d, clusters 3,5), was activated in both Tcf7-low and Tcf7-high ETPs and then increased in DN2 cells with varied Tcf7 expression. These results suggest that although not expressed in mature T cells, Mpo as well as Pim1 were substantially expressed within cells initiating the T-cell program and are not from contaminants.
Deep-sequencing confirms stem/progenitor and “non-T” associated regulatory genes co-expressed with Gata3 and Tcf7 in individual ETPs
To extend this inquiry to a sensitive genome-wide analysis of single cells, we carried out whole-transcript Smartseq2 scRNA-seq analysis (from C1 Fluidigm; “C1”) of highly purified ETP-DN2a cells (n=193 cells) (Fig. 3). Despite the low cell numbers, semi-supervised clustering of the C1 dataset (based on differentially expressed genes described in Fig.1c and Table S1) yielded high-quality gene expression patterns that supported and extended those seen in seqFISH. DN3 endpoint cells could not be included, but the results again separated ETP-DN2a cells expressing combinations of multipotent progenitor-associated genes from the cells more highly expressing T-lineage associated genes (Fig. 3a–e; Table S4, “C1_supervised_markers”). Again, one small outgroup was found with a highly divergent program (Fig. 3a, PC2) lacking T-cell gene expression, apparently among cells with a “Flt3− ETP” phenotype (Fig. 3b–e; cluster 9). Nevertheless, in the rest of the cells, C1-Smartseq data confirmed that multipotency-associated genes Spi1, Flt3, Lmo2, Mef2c, Cd7 and Irf8, were all frequently co-expressed with Tcf7 and Gata3 in individual ETPs, sometimes continuing into DN2s. But whereas Spi1 could still be co-expressed with the late DN2a gene Bcl11b, in contrast Irf8, Lmo2, and Flt3 expression was almost dichotomous with Bcl11b (Fig. 3f,g). This supports the interpretation that expression of these stem/progenitor genes selectively characterizes most ETPs as they enter the T-cell developmental program.
Figure 3.

Semi-supervised C1 Fluidigm (C1) analysis of single cells in the ETP-DN2a developmental continuum supports co-expression hierarchy of T-lineage and progenitor-associated genes. a) Principal component (PC) loading of first 2 PCs of the analysis based on genes that are differentially expressed in bulk RNAseq shown in Table S1. b) PC1–2 display of 193 cells measured by C1, colored by stage categorization of Flt3, Il2ra (ETP vs. DN2a), and Bcl11b positivity. c) tSNE display of C1 data with SLM clusters color projected. Both tSNE and clustering with SLM were performed with PC 1–10. d) tSNE display with expression patterns of specific genes as indicated overlaid in red. e) Heatmap of expression patterns of selected genes (‘non-T’ genes and ‘T-associated’ genes). The clusters are ordered by approximate T developmental order, according to c) and d). Also see Table S4 for the list of feature genes that are enriched in individual clusters. f) Bi-plots of expression patterns of two non-T lineage markers Irf8 and Mpo, against T specification genes Tcf7 and Bcl11b, showing the pattern of overlap of Mpo and both T specification genes. Irf8, on the other hand, overlaps with early T specification gene, Tcf7, but minimally with Bcl11b, which is expressed at a later stage. The dots are colored by expression of Il2ra (CD25) on a log transformed color scale. g) Co-expression patterns of stem and progenitor genes and T specification genes Tcf7, Gata3 and Bcl11b. n= 228 total cells measured, n= 193 cells were shown in this figure after filtering for single cells with a minimum of 3600 genes and a mitochondrial gene fraction under 0.11.
10x scRNAseq shows tightly connected ETP-DN2 cell populations
The seqFISH and C1 results indicated that the regulatory states of most ETP cells are within the continuum of the T-cell specification trajectory. We therefore dissected this trajectory in depth by whole-transcriptome analyses of thousands of enriched ETP-DN2a cells, again with DN3 cells as an internal reference, using 10X Chromium v2 (10X). Samples of 4627 (replicate1) and 7076 (replicate2) ETP-DN2 cells plus 10% DN3 cells yielded 3’ end-enriched transcriptome profiles with UMI quantitation. Upon dimensional reduction (tSNE or UMAP), RNA expression phenotypes separated the cells into 2–3 distinct clusters. These corresponded respectively to a large mix of ETP-DN2 cells, DN3 cells, and a small outgroup (Figure 4a,b), judged by expression patterns of genes characterizing different developmental stages or lineages (e.g., Elane (granulocytes), Mpo (macrophages), Klrd1 (NK cells))(Fig. 4c, highlighted in red). Within the ETP-DN2 continuum, stage-defining genes such as Kit (ETP-DN2), Il2ra (DN2-DN3), and Bcl11b (committed DN2-DN3) were localized to different regions but not well-separated. Again, the small outgroup expressed granulocyte-associated genes, e.g. Elane (Fig. 4c) along with some progenitor-associated genes (Kit, Spi1, Lmo2), as in the seqFISH (cluster 8 in Fig. 2g, h) and C1 analyses (cluster 9, Fig. 3b–e). Highly concordant results were found in an independent 10X experiment (Fig. S3a–d), and the 10X results overall agreed well with the C1 and seqFISH results after CCA scaling (Fig. S3e).
Figure 4.

A dense developmental continuum of gene expression in early DN pro-T cells based on 10x Chromium scRNAseq analysis. a-b) UMAP(a) and tSNE(b) displays of 10X Chromium data, colored by sub-clusters. Clustering performed with SLM algorithm using PC1–10. c) UMAP display with expression patterns of genes that characterize different developmental stages (Flt3, Kit, Il2ra, Spi1, Bcl11b, Rag1) or different lineages [Elane (granulocytes, GN), Mpo (macrophages, MP), Klrd1 (NK cells, NK)] overlaid in red. d) Heatmap displaying the top 10 enriched genes in each sub-cluster ordered by approximate developmental progression based on gene expression and connectivity in low dimensional displays. (Seurat 2 pipeline with minimum fraction of expressing cells ≥0.2, Wilcoxon rank sum test with threshold of 0.2; see Table S4). n=4627 cells: ~90% ETP-DN2 and ~10% DN3 cells.
Fine resolution unsupervised clustering by SLM distinguished 14 sub-clusters of cells across the ETP-DN3 range (Fig. 4a,b,d; Table S4, “10X unsupervised”). Bcl11b expression again marked clusters of recently committed cells (Fig. 4d, clusters 5, 2, 9, 11). The spiked-in DN3 cells again included both pre-β-selection DN3a cells (cluster 9: high Ptcra, Cd3g, Cd3d, and Cd3e, non-proliferative) and DN3b cells that had begun β-selection (cluster 11: high levels of Lef1 and proliferative markers). The Elane-expressing outgroup was cluster 13. This left the clusters of greatest interest, representing earlier, pre-commitment pro-T cells (clusters 0, 10, 4, 6, 7, 8, 12, 1), provisionally identified by their expression of progenitor-associated genes such as Cd34, Lmo2 and Mef2c. However, among these earlier clusters, the ordering was ambiguous in unsupervised clustering, and the relationship to cluster 13 was still unclear. This was partly because transcripts of key T-cell genes Notch1, Gata3, and Tcf7 did not change sharply enough to be identified as highly enriched in any particular ETP-DN2a cluster(s). Another source of ordering ambiguity among ETP-DN2a cells was the prominence of multiple states associated with cell cycle, in both biological replicates (Fig. 4d, Fig. S3d). Cells expressing S- or G2+M related genes (e.g. Birc5, Mki67) were found in clusters apparently representing different stages along the early-to-late developmental continuum.
Distinct T-cell differentiation kinetics and identification of committed granulocyte precursors among ‘ETPs’
To confirm which gene expression clusters were associated with T or non-T lineage potential and to verify which were more or less advanced in T-linage progression, we used marker genes that distinguished some of these clusters to fractionate ETPs by FACS, and then directly compared their developmental kinetics and fates under T-cell and non-T cell developmental conditions (Fig. S4a). We also sought to resolve whether the Elane-positive cells (Fig. 2e, cl. 8; Fig. 3, cl. 9; Fig. 4d, cl. 13) were part of the T-cell developmental pathway or a separate lineage. These cells uniquely expressed several granulocyte-associated genes, including Elane, Ms4a3, Ly6c2, and Prtn3, but lacked expression of Notch1 or Notch-induced genes (Hes1, Dtx1), possibly resembling a bone marrow early pre-neutrophil precursor (Evrard et al., 2018). Distinctively, these cells co-expressed surface receptors, CD63 and Ly6c2, detectable with antibodies that were used to purify them away from other ETP subsets for developmental tests.
We first confirmed that Flt3+ ETPs were indeed more immature than the Flt3− ETPs. Flt3+ and Flt3− ETPs (excluding CD63+ Ly6c+ cells) and DN2a (CD25+Bcl11b-YFP−) cells were co-cultured with OP9-DL1 stroma to provide T-cell differentiation conditions (Fig. S4b). Their progression was scored by two T-cell milestones: onset of CD25 expression, denoting transition from ETP to DN2a, and the subsequent expression of Bcl11b-YFP. Then, to test the developmental potential of the Elane+ cells, CD63+ Ly6c+ cells were sorted and compared with CD63− Ly6c− ETPs. Unlike other ETPs, CD63+ Ly6c+ cells could not turn on CD25 or Bcl11b-YFP in T-cell culture conditions. Instead, they turned on the granulocyte marker Gr1 after 4–5 days (Fig. S4c–d). These populations were also tested for their ability to generate alternative lineages in non-T conditions, in the absence of Notch signaling and with cytokines supporting myeloid differentiation. Under these conditions, while other subsets of ETPs generated multiple types of non-T cells, CD63+ Ly6c+ cells exclusively gave rise to Gr1+ granulocytes (Fig. S5). Thus, the CD63+Ly6c+ cluster in the thymic ‘ETP compartment’ is a committed granulocyte precursor, has no T potential, and differentiates independently of Notch signaling. Thus, expression of Elane and Prtn3 in single cell and bulk ETP RNA-seq is attributable to a distinct non-T lineage population rather than to expression by uncommitted T-cell precursors.
Developmental progression shows stage-dependent relationships to cell cycle states
We could now address the gene regulatory states associated with T-cell specification per se, in the 10X data. To gain better resolution of possible component processes by topology on a more complex developmental manifold, we applied a force-directed layout algorithm using SPRING, visualizing long-distance as well as nearest-neighbor relationships of cells across three reduced dimensions (Weinreb et al., 2018)(Fig. S6). The SPRING graph revealed an ordered developmental continuum from ETP (Il2ra negative), through DN2a (Il2ra positive) and committed DN2 cells (Bcl11b positive), and into the separated DN3a and DN3b cells (offset Bcl11b high populations)(Fig. S6a–b), roughly progressing from top right to bottom left (arrow in Fig. S6b). Within the main zones, the early ETP marker Flt3 highlighted the top right edge, while ETP-DN2 gene Spi1 lit up a distinctly larger area of the ETP-DN2 cluster, and the T-lineage commitment gene Bcl11b was activated only at the edge away from the Flt3-enriched zone and continuing into the offset DN3a and DN3b cells (Fig. S6a), consistent with known developmental relationships. However, the cells also varied strongly along an axis orthogonal to the developmental direction (Fig. S6). This second axis was represented by proliferative and cell cycle state markers as annotated in Fig. S6a. The resolution of two biologically meaningful but orthogonal axes of variance suggests that cells transition through multiple cell cycles as they progress through successive differentiation states, rather than confining cell cycling to a single state.
Notably, expression of many functionally important genes was not uniform across each band of cells along the “developmental axis”. The G1-associated ETP-DN2 region (upper left) had a concentration of cells expressing Gata3 and Tcf7, yet this region was also most enriched for cells expressing high levels of Spi1, Cd7, and Tyrobp, genes characteristic of non-T cells. Depending on the actual trajectory the cells take, this state could represent a developmental branch point, an alternative entry point for precursors, or a transiently induced upregulation of non-T genes even along the T-cell pathway.
RNA velocity analysis maps the developmental flux from ETP through DN2 and commitment
To elucidate the developmental fluxes between populations in the ETP-DN2 transition, we used RNA velocity analysis (Velocyto)(La Manno et al., 2018)(Fig. S7; Fig. 5a, b). This algorithm uses the ratio of unspliced, presumably nascent, pre-mRNAs to mature mRNAs to estimate the rate of RNA production change, and therefore the direction of regulatory change in low-dimensional transcriptome space, for cells moving through development. Indeed, 17% of reads in the 10X scRNAseq data mapped to intronic regions of the genome (Fig. S7a, b). Data from the 10X analysis, omitting DN3b and granulocyte precursors, were plotted on a principal component space (PC1 and 2 shown in Fig. 5a,b), with RNA velocity-based differentiation vectors superimposed on the same axes (Fig. 5b). Similarly to the SPRING layout, expression of known genes showed that cells separated orthogonally with cell cycle differences most evident along PC1 and developmental stage differences more along PC2 (Fig. 5a, b). Notably, though, despite this cell-cycle correlation, differences in cell cycle genes did not drive the velocity vector patterns, for the velocity vectors were nearly identical even when cell cycle genes were excluded from the calculation (Fig. S7c).
Figure 5.

Stage ordering by RNA velocity and pseudotime modeling from supervised analysis of 10X scRNAseq data: evidence for gene expression waves during early T-cell differentiation. a-b) RNA velocity analysis on trimmed data using Velocyto (excluding granulocyte precursor and DN3b clusters). a) mRNA expression patterns for key genes on PC1–2: higher expression, darker green. b) Grid arrows indicating relative transition probabilities based on un-spliced/spliced transcript calculations (imputation with k = 90, displayed on PC1–2) using Velocyto. Also see Fig. S7. c–d) DDRtree display analyzed with Monocle 2 and based on the curated instructive gene list (Table S2), overlaid with pseudo-time staging (c), and branching state (d). Granulocyte precursor and DN3b clusters excluded, n=4438 cells. e-f) Gene expression patterns along pseudo-time. e) Relative expression patterns of representative regulatory genes across pseudo-time, colored by DDRtree ‘state’ (legend in (d)). Also see Fig.S8c. f) Clustered expression heatmap of 763 genes that are differentially expressed along the pseudo-time (Monocle 2, with qval<10−8, in both biological replicates). Red= high expression level, blue = low expression level, on a relative scale normalized to each gene. Dashed vertical lines are positioned for descriptive purposes, hierarchical clustering based on expression using the “complete” method. g) Summary table of fractions of pseudotime-differentially expressed genes in each cluster that overlap with regulatory targets activated (act) or repressed (rep) by key TFs PU.1 and Bcl11b in perturbation assays, and the total number of genes in each cluster. Also see Table S5. Red font highlights fractions above 10%(0.1).
The velocity vector map indicated complex, PC1-biased differentiation trends within the ETP compartment distinct from those in DN2, and suggested that transition from ETP to DN2a occurred from a preferential regulatory state (Fig. 5b). While velocity vectors indicated that DN2 cells in all cell cycle states were uniformly progressing toward DN3 (central band of downward pointing arrows), the early ETPs (along the topmost zone, colocalized with Flt3) had velocity vectors suggesting two different attractors with distinct cell cycle states. Velocity vectors for the Birc5+ ETPs (extreme top right, presumably in G2+M) appeared to be pointing to the left, toward another ETP state, where a subset of these Birc5+ ETPs appeared to be developmentally static (dots or shortest arrows). Of note, these more static ETPs, possibly representing a self-renewing subset, also showed the highest ongoing transcription of Hoxa9, a homeobox gene associated with prethymic progenitor specification and leukemia (Gwin et al., 2013)(Fig. S7d). In contrast, ETPs with differentiation velocity vectors pointing toward an Il2ra+Bcl11b− early DN2a state (down) were on the left, among Birc5-nonexpressing ETPs. Here, transitions from a Cd7-high ETP subset (extreme upper left) were most prominent. The velocity data suggest that the immediate precursors of DN2a cells were among particularly Spi1-high G1 phase ETP cells, many also transiently Cd7 high, in the process of downregulating Flt3 (Fig. 5a, Fig. S7e).
Supervised analysis of 10X data reveals a developmental trajectory from ETP through T-lineage commitment
The RNA velocity analysis was reinforced by the topology obtained when we used the 10X datasets to construct a developmental gene expression trajectory. The curated list of seqFISH genes (Table S2) was now used for supervised analysis of the whole transcriptome data, with DN3b cells and granulocyte precursors excluded (Fig. S8a,b; clusters in Table S4, “10X_supervised_markers”). DDRtree (Qiu et al., 2017a) was used to obtain a connected developmental trajectory and pseudotime staging of the cells (Fig. 5c–e, Fig. S8). From the independent replicates of the 10X analysis, 763 genes were significantly differentially expressed along the pseudotime axis in both (qval <10−8), and these genes were clustered according to their expression patterns in a heat map (Fig 5f; listed in order in Table S5). Fig. 5f also indicates approximate subdivisions and regulatory landmarks; the pattern of expression in pseudotime of the curated genes themselves is shown in Fig. S8c. While the pseudotime model clearly supported the distinction between ETP and DN2a stages (approx. between subdivisions B & C, Fig 5f), additional substages were present, in accord with the seqFISH analysis (cf. Fig. S1), and these were not based on cell cycle gene clusters. Instead of monotonic increases or decreases in gene expression across the trajectory, another group of progenitor-associated genes (e.g. Spi1, Cd7, Mpo, and Tyrobp) was predicted to rise transiently upon down-regulation of Flt3 within the ETPs (Il2ra negative), followed by their own down-regulation at a later DN2 stage. This implication also accorded with the unsupervised RNA velocity analysis. Similarly, in second or third waves during the ETP-DN2 transition and DN2 stages (subdivisions C & D-E, Fig 5f), other groups of genes including Pim1 were predicted to undergo transient expression changes before the final committed DN3 regulatory state.
These predicted pseudotime trends were generally consistent with known regulatory relationships between landmark TFs, Bcl11b and PU.1 (encoded by Spi1) and individual target genes, based on perturbation experiments that defined targets of these factors genome-wide (Hosokawa et al., 2018a, 2018b; Ungerbäck et al., 2018). These perturbation tests defined 326 PU.1-upregulated genes, 237 PU.1-repressed genes, 394 Bcl11b-dependent genes, and 747 Bcl11b-repressed genes. Bcl11b and/or PU.1 targets represented 214 of the 763 pseudotime-indicator genes (Table S5), so we compared the changes in these genes in pseudotime with changes in expression of Bcl11b and Spi1 themselves. Fig. 5g shows the fractions of genes in individual pseudotime expression clusters that were significantly repressed by or dependent on PU.1 or Bcl11b (pattern details in Table S5). PU.1 indeed positively regulated genes in several distinct early clusters, particularly in the early transient wave (Fig. 5g, orange margin), but negatively regulated genes in late (DN3-associated) clusters. Bcl11b primarily activated genes upregulated late in pseudotime. Bcl11b repression targets were concentrated among early and intermediate pseudotime-expressed genes, especially in the two intermediate expression waves (Fig. 5g, groups with green and orange margins). These genes had been deduced to be Bcl11b repression targets because acute deletion of Bcl11b caused their expression to increase even in committed pro-T cells that had already reached DN2b. This supports the interpretation that the genes upregulated in the intermediate wave are expressed within the T-lineage specification pathway, and that their expression is then truncated by Bcl11b.
In vitro culture supports the single cell trajectory and multilineage priming model
These intermediate expression waves were unpredicted (Mingueneau et al., 2013; Yui and Rothenberg, 2014), and might either reflect a succession of transient regulatory states during T-cell development or be computational artifacts of forcing branched gene expression changes into a single pathway. Specifically, in the DDRtree model, the end stage ETPs exhibited a small branch going off the trajectory, associated with upregulation of Spi1, Hhex, Cd7, and Tyrobp, genes strongly affiliated with myeloid, NK, or DC alternative fates. In pseudotime, however, these genes were modeled as transiently up-regulated in ETP. In support of the pseudotime model, ETPs expressing high levels of these genes (G1-enriched ETPs) were identified in the velocity analysis within the region most likely to transition to DN2 (Figure 5b). In seqFISH and C1 distribution analysis, we had also confirmed that these genes are expressed by a substantial population of cells (Fig. 2–3). Thus, two hypotheses can explain this early wave or branch pattern (Fig. 6a): 1. lineage branching, where levels of these non-T-cell associated transcripts are accumulated in a subset of cells that have branched off towards alternative fates; or 2. multilineage priming, in which genes associated with alternative lineages are expressed transiently in early stages, reflecting the intrinsic regulatory network structure and phenotypic plasticity of uncommitted early T-cell stages. If lineage branching were true, then the pseudotime model expression pattern of transiently upregulated genes in late ETP would be inaccurate.
Figure 6.

In vitro test of ETP developmental staging favors a multilineage-priming model for gene expression waves. a) Diagram of two hypotheses to explain the branch or early wave patterns observed in the DDRtree and pseudotime analyses. b) Diagram of the in vitro developmental culture assays and ETP subset scRNAseq setups. c-e) ETPs (stages A and B, Fig 6d) were subdivided into 6 populations according to surface markers Flt3, HSA, and Ly6d, and analyzed for their developmental progression after 4–7 days. c) Representative flow cytometry plots of the development of sorted ETP populations after 4 days of culture on OP9-DL1. d) Bar-graphs showing the fraction of committed T-cells (measured by Bcl11b-YFP upregulation) after 4 days in OP9-DL1 culture, ordered according to the pseudo-time pattern. (n=3 independent biological replicates, 3rd replicate (Rep3) an average of 2 technical replicates.) e) non-T lineage potential of individual sorted populations after 7d of culture on OP9-Control (no Notch ligand, non-T conditions) with lymphoid supporting cytokines. n≥4. f) Summary plots of percentage of cells passing T-developmental milestones in individual clones from individual FACS sorted precursors (gates same as in (c)-(e)) cultured 5 days on OP9-DL1. Whiskers represent 5–95 percentiles. n=55, 62, 63, 58, 58, 44 live clones in ETP pop1 through 6, respectively. g-h) Reconstructed transcriptome single cell pseudotime trajectory with 4 ETP subsets (pops 1, 3, 4, 6 from (c)-(f)) and a ETP-DN3 control group tagged with antibody barcodes. g) DDRtree with pseudotime coloring and highlighted ETP subsets. h) Pseudotime distribution of individual cells from the 4 sorted subpopulations. (Analyzed with Monocle 2 and based on the curated instructive gene list). n= 1333, 1144, 1044, 823, 3172 cells in ETP pop1, 3, 4, 6 and control, respectively.
To test the two hypotheses functionally, we used the pseudotime analysis to identify markers that could distinguish between ETP subpopulations. We then FACS-purified ETP subsets based on their expression of these markers, and followed their T-lineage developmental kinetics, as well as their alternative lineage potentials, through in vitro culture (Fig. 6b). Whereas Flt3 marks earlier ETPs (Fig. 2, Fig. S4), the cell surface marker HSA (Cd24a) was predicted in pseudotime to be gradually up-regulated during late ETP stages, followed by Ly6d up-regulation (Fig. 5f). Unfortunately, CD7 could not be used for subset enrichment due to lack of a specific antibody. We therefore sorted ETPs into 6 sub-populations according to Flt3, HSA and Ly6d expression (Fig. S8d), and tested them in OP9 co-culture systems with and without Notch ligand to compare their developmental potentials and speeds of T-lineage progression, as measured by upregulation of the Bcl11b-YFP reporter. In this T-lineage developmental assay, after 4 days these 6 populations showed a clear range of T-lineage developmental speeds (Fig. 6c–d). The most advanced population repeatedly appeared to be Ly6d+ Flt3− ETPs (pop. 6, approximately late substage B, Fig. 5f), and the least advanced population, the Flt3+ Ly6d− HSA− cells (pop. 1), in good agreement with the single cell pseudotime trajectory model. In tests of non-T lineage potential using co-culture without Notch ligand, Flt3+ cells (pops. 1–3) differentiated readily into dendritic cells (DCs), macrophages, natural killer cells (NKs), and some granulocytes, as expected for uncommitted precursors. However, despite their association with higher expression of myeloid-affiliated genes Spi1, Hhex, Tyrobp, and Mpo, all the Flt3− subpopulations (pops. 4–6) revealed less potential to give rise to DCs and macrophages than the Flt3+ ones, although similar to Flt3+ ETPs in their output of NKs (Fig. 6e). This agreed with the different outputs of Flt3+ and Flt3− ETP subsets when myeloid potential was promoted with alternative cytokines, omitting Flt3 ligand (Fig. S5b). Thus, potential towards DC and macrophage development is reduced, not increased, in ETPs when they turn off Flt3.
Finally, to determine whether the developmental potentials of individual cells truly match the transcriptome features of the pseudotime model, we repeated this experiment at the clonal level. First, we determined the distribution of developmental states from Bcl11b− DN2a to Bcl11b+ DN2a to DN2b, within clones generated by single precursors from sorted ETP subsets 1–6 (Fig. 6f). The results showed that nearly all cells in clones from all subsets of input cells had crossed the ETP-DN2 boundary in five days (Fig. 6f, top). In accord with the sorted bulk population results (Fig. 6d), clones seeded by precursors from subsets 1 and 2 were slower than the rest and those seeded from subsets 5 and 6 were faster than the rest at turning on Bcl11b-YFP and progressing to DN2b (Fig. 6f, middle, bottom). However, despite these differences, >75% of the individual subset 3 and 4 precursors generated clones in which at least 30%–50% of the cells had turned on Bcl11b-YFP by day 5 (Fig. 6f), confirming the T-lineage potential of the founders. To determine how homogeneously the transcriptomes of these sorted subsets were actually distributed in pseudotime, at single-cell level, we used Cell Hashing for scRNA-seq of 5 populations simultaneously, combining barcoded antibodies with 10X analysis (Stoeckius et al., 2018)(Fig.6b, also see Methods). Purified ETP subsets 1, 3, 4, and 6 and a reference ETP-DN3 population were labeled and pooled for 10x single-cell transcriptome analysis. A new DDRTree and a new ‘ETP-enriched’ pseudotime analysis were calculated from the results (Fig. 6g,h, Fig. S8e), and the distinct subset features were deconvolved from the data by sample cell hashing barcode. The separation and spread of the clonal developmental assay and the transcriptomic pseudotime profiles of precursors from sorted gates were in good agreement. Cells in the Flt3− subsets 4 and 6 resolved to different pseudotime positions particularly well, and both subsets were distinct from subsets 1 and 3 (Fig. 6g,h). Fig. S8e confirms that their enhanced T-lineage differentiation relative to subsets 1 and 3 was indeed correlated with their higher expression of “non-T” genes Spi1, Hhex, Cd7, Mpo, and Tyrobp, as predicted by RNA velocity results.
These results thus confirm that ETPs advance toward T-lineage progression as they turn off Flt3, but that strong multipotency regulators and non-T markers are transiently elevated in these cells relative to earlier T-cell precursors. This result favors the multilineage-priming model and indicates that the transient upregulation of these “non-T” genes is an integral feature of the early T-cell developmental program.
Discussion
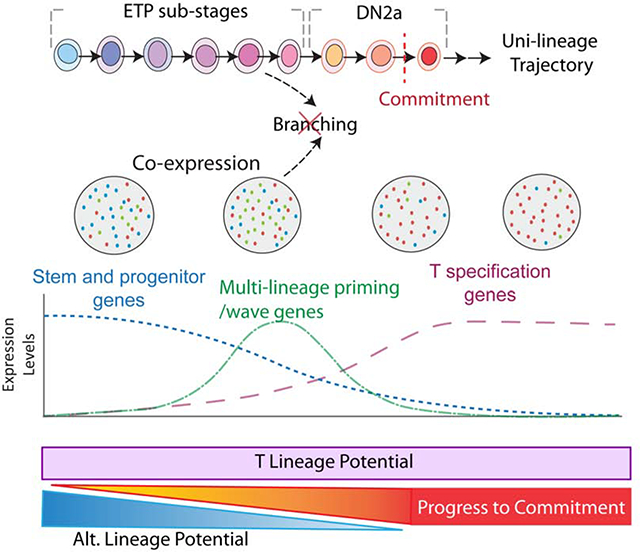
The T-lineage commitment transition has been much studied, but the events leading up to commitment have been poorly understood until now. Here, we have dissected the gene regulatory changes and associated developmental potentials during this process, encompassing ETP to DN2a stages, at the single cell level (Fig. S1a), with results summarized in Figure 7. This analysis has provided evidence for an ordered sequence of at least three transient regulatory states leading toward T-lineage commitment. Evidence that these transient states are truly within the T-cell developmental progression and not representing cells of different lineages comes from the high T-lineage precursor frequency in the starting ETP population, from the relative differentiation kinetics of the candidate intermediate populations, and from the robust coexpression of T-lineage specification TFs (Tcf7, Gata3) together with genes specific for the intermediate states within individual cells. This study thus provides insight into gene expression dynamics of the earliest T-cell precursors, essential for more accurate modeling of the underlying T-cell specification gene regulatory network.
Figure 7.

Summary of key findings in this study Data imply sequential sub-stages within the ETP compartment before transition to DN2a, not only marked by asynchronous downregulation of progenitor genes but also by transient activation of gene waves as the cells progress toward commitment. The frequency of T lineage potential is very high in ETPs overall, and although some transiently activated genes are otherwise associated with non-T fates (multilineage priming), alternative lineage potential in pro-T cells decreases monotonically as the cells progress from Flt3+ ETP to Flt3− ETP to DN2a to commitment.
The results of this study were greatly strengthened by the complementary contributions from three single-cell transcriptome analysis approaches. Genome-wide transcriptome profiles based on 10X Chromium droplet-based sequencing had to be supplemented with highly sensitive seqFISH measurements to obtain accurate relationships between regulatory genes expressed in the same cells, while deep sequencing of a smaller number of cells with C1-SmartSeq2 provided full-transcript corroboration. We validated the biological predictions of the pseudotime trajectory using primary cell culturing assays to test directly the T and other lineage differentiation potentials among sub-populations of ETPs. The pseudotime model of gene expression dynamics in early T cell differentiation was also consistent with recent empirical knock-out studies of known regulatory factors, PU.1 (Spi1) and Bcl11b (Hosokawa et al., 2018a, 2018b; Ungerbäck et al., 2018), which activate and repress target genes that cluster appropriately relative to Bcl11b and PU.1 expression changes.
Transcriptome clustering and RNA velocity analyses indicated that developmental progression could be initially linked with cell cycle control in ETPs, later becoming cell cycle-unrestricted in DN2s. Through RNA velocity and pseudotime analysis, we identified the most likely phenotype of the immediate DN2 precursors within the ETP population. Notably, these cells were particularly enriched for expression of Spi1 and other genes that are not specific for the T-cell pathway, supporting multilineage priming. This population was distinct from an outgroup of granulocyte-committed precursors found in every population of ETPs analyzed. Finally, primitive populations of ETPs with unusually high Hoxa9 transcription were detectable by cell cycle and distinctive regulatory gene expression velocity (Fig. S6e), and could represent an ETP subset with augmented self-renewal potential.
Using seqFISH and C1 data, we showed that within the ETP state the majority of individual cells co-express legacy progenitor genes with the critical Notch-induced T cell regulatory genes, Gata3 and Tcf7. This demonstrates rigorously that intra-thymic Notch signaling does not immediately shut down expression of stem and progenitor genes, even as it turns on T-cell genes, and that the two regulatory networks operate together in the same cells throughout ETP and even into DN2 stages, implying timescales of days (Kueh et al., 2016). This also suggests the possibility of crossover regulatory network connections, which remain to be determined but may help to explain the observed transient regulatory states. Previous studies suggested that hematopoietic stem cells (HSCs) maintain low-level expression of lineage-associated genes to stay poised for multilineage blood production while balancing self-renewal and differentiation, a state termed multilineage priming (Hu et al., 1997; Mercer et al., 2011; Orkin, 2003; van Galen et al., 2014). Seemingly-overlapping patterns of expression of Spi1, Bcl11a, Cebpa and T-cell specification genes at the population level have been suggested to explain the persistence of multilineage differentiation potential in ETP-DN2a cells under conditions of Notch withdrawal (Del Real and Rothenberg, 2013; Franco et al., 2006; Kueh et al., 2016; Laiosa et al., 2006; Wang et al., 2014; Yui et al., 2010), but this has previously been a hypothesis. The results shown here are the first to demonstrate this co-expression in individual ETPs. Furthermore, in ETPs, even some “effector” genes representative of non-T cell lineages, such as Mpo, were also robustly co-expressed with Gata3 and Tcf7 at the single cell level, in populations showing a high T-lineage precursor frequency; the seqFISH data ruled out possible doublets. This pattern of coexpression strongly supports multilineage priming in many individual ETP (and even DN2a) cells rather than contamination with cells lacking T-lineage potential.
In summary, we have established a detailed model of single-cell transcriptome dynamics during the transition from multipotentiality to T-cell lineage commitment, with single cell sequencing tools, bolstered by highly sensitive seqFISH analysis, and supported by in vitro differentiation kinetics and the results of acute transcription factor perturbation studies. This study provides new potential regulatory steps to explore and validate. For the first time, the complexity and regulatory substructure within the first phase of T-cell development can be perceived.
STAR METHODS
LEAD CONTACT AND MATERIALS AVAILABILITY
All sequence data generated in this study have been deposited in Gene Expression Omnibus and all genotypes of mice used in this study were crossed from strains available from Jackson Laboratories, or from strains we reported previously (Kueh et al., 2016), which are available upon reasonable request. Further information and requests for resources and reagents should be directed to and will be fulfilled by the Lead Contact, Ellen V. Rothenberg (evroth@its.caltech.edu).
EXPERIMENTAL MODEL AND SUBJECT DETAILS
Animals
Mice of a variety of genotypes were used exclusively as sources of primary cells to be analyzed ex vivo in these studies. B6.Bcl11byfp/yfp reporter (Kueh et al., 2016) mice were used for bulk RNAseq analysis, in vitro developmental assays and ETP subpopulation Cell Hashing 10X scRNAseq. This nomenclature is used for animals which have a nondisruptive insertion of IRES-mCitrine into the 3’-untranslated region of Bcl11b, so that they have wildtype Bcl11b function despite simultaneously expressing the yellow fluorescent protein. C57BL/6(B6) mice (stock originally from Jackson Laboratories) were used for seqFISH and all other scRNAseq analysis. B6.ROSA26-mTom;Bcl11b-YFP mice were used for clonal imaging analysis. They were generated by crossing and backcrossing B6.129(Cg)-Gt(ROSA)26Sortm4(ACTB-tdTomato,-EGFP)Luo/J mice, which express ubiquitous membrane Tomato (Jackson Laboratories), with the B6.Bcl11byfp/yfp reporter mice until both loci were homozygous. E-Bcl-2–25(Bcl2-tg) (Strasser et al., 1991) and B6.Bcl11byfp/yfp;Bcl2-tg mice were used for specific culturing assays as indicated below. B6.Bcl11byfp/yfp;Bcl2 mice were generated through crossing B6.Bcl11byfp/yfp × Bcl2-tg until the Bcl11b locus was homozygous. All adult animals used were mice between 4 and 8 weeks of age, and all samples within experiments were pools from multiple age and sex-matched animals. Animals used for these experiments were bred and maintained at the Animal Facilities at California Institute of Technology under conventional Specific Pathogen-Free conditions, and animal protocols were reviewed and approved by the Institute Animal Care and Use Committee of California Institute of Technology (Protocol #1445–18G). To maximize both thymus population sizes and fertility of the mice in the colony, care was taken to protect these animals from stress throughout their lifetimes to the greatest extent possible.
Cell lines
To provide a microenvironment that supports T-lineage differentiation in vitro, we co-cultivated primary cells with the OP9-DL1 stromal cell line (Schmitt and Zúñiga-Pflücker, 2002), which was obtained from Dr. Zúñiga-Pflücker (Sunnybrook Research Institute, University of Toronto) and maintained in our laboratory as described in the original reference. Control OP9 cells not expressing the Notch ligand DL1 were used to establish a microenvironment to support non-T cell developmental pathways of primary cells. The OP9-control cells were also obtained from Dr. Zúñiga-Pflücker. Both OP9-DL1 and OP9-control cell lines were tested and found to be negative for mycoplasma contamination. For live imaging experiments, a derivative of the OP9-DL1 cells was used, OP9-DL1-delGFP1, in which the GFP marker in the cell line had been removed by Cas9-mediated disruption as described elsewhere (Olariu et al., 2019). Details of the differentiation cultures are given below under Method Details.
METHOD DETAILS
Primary Cell Purification
Early stage thymocytes were purified from thymi removed from 4- to 8-week-old animals prior to flow cytometry analysis or fluorescence-activated cell sorting (FACS). Harvested thymi were mechanically dissociated to make single cell suspensions that were resuspended in Fc blocking solution with 2.4G2 hybridoma supernatant (prepared in the Rothenberg lab), followed by depletion of mature T and non-T lineage cells using a biotin-streptavidin-magnetic bead removal method. Briefly, thymocyte suspensions were labeled with biotinylated lineage marker antibodies (CD8α, TCRβ, TCRγδ, Ter119, CD19, CD11c, CD11b, NK1.1), incubated with MACS Streptavidin Microbeads (Miltenyi, Biotec) in HBH buffer (HBSS (Gibco), 0.5% BSA (FractionV), 10 mM HEPES, (Gibco)), pre-filtered through nylon mesh, and passed through a magnetic column (Miltenyi Biotec) on a cell separation magnet (BD Biosciences) to obtain enriched DN cells. Then, the DN cells were stained with conjugated fluorescent cell surface antibodies (See STAR Key Resources Table) to purify the ETP, DN2a, and DN3 populations. ETP: Kithigh CD44high CD25neg. DN2a: Kithigh CD44high CD25+. DN2b: Kitintermed CD44high/intermed CD25+. DN3: Kitlow CD44low CD25+. Where the Bcl11b-YFP allele is present, the onset of Bcl11b-YFP expression distinguishes T-lineage committed DN2a cells from earlier, uncommitted DN2a cells (Kueh et al., 2016).
KEY RESOURCES TABLE
| REAGENT or RESOURCE | SOURCE | IDENTIFIER |
|---|---|---|
| Antibodies | ||
| Anti-human/mouse CD44 PE | eBioscience | Cat#12-0441-83 |
| Anti-mouse CD117 (cKit) APC | eBioscience | Cat#17-1171-82 |
| Anti-mouse CD25 eFluor-450 | eBioscience | Cat#48-0251-82 |
| Anti-mouse CD25 APCe780 | eBioscience | Cat#47-0251-82 |
| Anti-mouse CD25-Alexa Fluor 647 | Biolegend | |
| Anti-mouse CD45 PECy7 | eBioscience | Cat#25-0451-82 |
| Anti-mouse CD11b PE | eBioscience | Cat#12-0112-85 |
| Anti-mouse CD11b AF488 | eBioscience | Cat#53-0112-82 |
| Anti-mouse CD11b APCe780 | eBioscience | Cat#47-0118-42 |
| Anti-mouse CD11c e450 | eBioscience | Cat#48-0114-82 |
| Anti-mouse CD11c APCe780 | eBioscience | Cat#47-0114-82 |
| Anti-mouse CD63 PE | Biolegend | Cat#143903 |
| Anti-mouse Ly6c PE | Biolegend | Cat#128008 |
| Anti-mouse Ly6c Alexa Fluor 647 | Biolegend | Cat#128010 |
| Anti-mouse CD135 (Flt3) BV421 | Biolegend | Cat#135313 |
| Anti-mouse CD24(HSA) APC | Biolegend | Cat#138506 |
| Anti-mouse Ly6d PE | Biolegend | Cat#138603 |
| Anti-mouse Gr1 APC | Biolegend | Cat#108412 |
| Anti-mouse NK1.1 PE | eBioscience | Cat#12-5941-83 |
| Anti-mouse Dx5 PE | eBioscience | Cat#12-5971-83 |
| Anti-mouse NK1.1 Biotin | eBioscience | Cat#13-5941-85 |
| Anti-mouse CD19 Biotin | eBioscience | Cat#13-0193-85 |
| Anti-mouse Ter119 Biotin | eBioscience | Cat#13-5921-85 |
| Anti-mouse CD11b Biotin | eBioscience | Cat#13-0112-86 |
| Anti-mouse CD11c Biotin | eBioscience | Cat#13-0114-85 |
| Anti-mouse CD8a Biotin | eBioscience | Cat#13-0081-86 |
| Anti-mouse TCRγδ Biotin | eBioscience | Cat#13-5711-85 |
| Anti-mouse TCRβ Biotin | eBioscience | Cat#13-5961-85 |
| Streptavidin PerCP-Cy5.5 | eBioscience | Cat#45-4317-82 |
| PU.1 (9G7) Rabbit mAb (Alexa Fluor 647 conjugate) | Cell Signaling | Cat#2240 |
| TCF1/TCF7 (C63D9) Rabbit mAb (Alexa Fluor 647 conjugate) | Cell Signaling | Cat#6709 |
| Totalseq-A0301 anti-mouse Hashtag1 | Biolegend | Cat#155801 |
| Totalseq-A0301 anti-mouse Hashtag2 | Biolegend | Cat#155803 |
| Totalseq-A0301 anti-mouse Hashtag3 | Biolegend | Cat#155805 |
| Totalseq-A0301 anti-mouse Hashtag4 | Biolegend | Cat#155807 |
| Totalseq-A0301 anti-mouse Hashtag5 | Biolegend | Cat#155809 |
| Bacterial and Virus Strains | ||
| Biological Samples | ||
| Primary murine thymocytes | This work | |
| Chemicals, Peptides, and Recombinant Proteins | ||
| MEM Alpha | GIBCO | Cat#12561–056 |
| Fetal Bovine Serum | SigmaAldrich | Cat#F7305 |
| Human IL-7 | PeproTech Inc | Cat#200–07 |
| Human FLT-3-Ligand | PeproTech Inc | Cat#300–19 |
| Stem Cell Factor | PeproTech Inc | Cat#250–03 |
| Murine M-CSF | PeproTech Inc | Cat#315–02 |
| Mouse GM-CSF | Miltenyi Biotec | Cat#130-095-739 |
| Murine IL3 | PeproTech Inc | Cat#213–13 |
| Murine IL6 | PeproTech Inc | Cat#216–16 |
| HBSS | GIBCO | Cat#14175–095 |
| HEPES | GIBCO | Cat#15630–080 |
| Pen Strep Glutamine | GIBCO | Cat#10378–016 |
| MACS Streptavidin Microbeads | Miltenyi Biotec | Cat#130-048-101 |
| 37% formaldehyde | ThermoFisher Scientific | Cat#28908 |
| 7AAD | eBioscience | Cat#00-6993-50 |
| β-mercaptoethanol | SigmaAldrich | Cat#M6250 |
| NaBH4 | SigmaAldrich | Cat#452882 |
| DNaseI recombinant, RNase-free | Roche | Cat#4716728001 |
| 20× SSC | Invitrogen | Cat#15557–036 |
| Formamide | Ambion | Cat#AM9344 |
| HCR amplification hairpins | Molecular Instruments | Custom order |
| Dextran Sulfate | SigmaAldrich | Cat#D8906 |
| Trolox | Calbiochem | Cat#648471 |
| Pyranose oxidase | SigmaAldrich | Cat#P4234 |
| Catalase | SigmaAldrich | Cat#C3155 |
| Critical Commercial Assays | ||
| Illumina Nextera DNA preparation Kit | Illumina | Cat#FC-121–1030 |
| Nextera Index Kit (96 indexes, 384 samples) | Illumina | Cat#FC-121–1012 |
| RNeasy Micro Kit | QIAGEN | Cat#74004 |
| C1™ Single-Cell mRNA Seq IFC, 5–10 μm | Fluidigm | Cat#100–5759 |
| Chromium i7 Multiplex Kit | 10X Genomics | Cat#120262 |
| Chromium Single Cell 3′ Library & Gel Bead Kit v2 | 10X Genomics | Cat#120267 |
| Chromium Single Cell A Chip Kit | 10X Genomics | Cat#1000009 |
| High Sensitivity DNA Kit | Agilent Technologies | Cat#5067– 4626 |
| Qubit dsDNA HS Kit | ThermoFisher Scientific | Cat#Q32854 |
| SPRIselect reagent kit | Beckman Coulter | Cat#B23318 |
| Chromium Single Cell 3′ GEM, Library & Gel Bead Kit v3 | 10X Genomics | Cat#1000092 |
| Chromium Chip B Single Cell Kit | 10X Genomics | Cat#1000074 |
| Deposited Data | ||
| Bulk RNA-seq data | This work | Gene Expression Omnibus GSE130812 |
| Two samples, 10X Chromium RNA-seq | This work | Gene Expression Omnibus GSE130812 |
| C1 Smartseq2 RNA-seq, 226 cells | This work | Gene Expression Omnibus GSE130812 |
| 10X Chromium RNA-seq cell hashing sample, 5 cell fractions barcoded | This work | Gene Expression Omnibus GSE137165 |
| Experimental Models: Cell Lines | ||
| OP9-DL1 | Schmitt et al., 2002 | N/A |
| OP9-DL1 dGFP | Olariu et al., 2019 | N/A |
| OP9-control | Schmitt et al., 2002 | N/A |
| Experimental Models: Organisms/Strains | ||
| Mouse: C57BL/6 | Jackson laboratories | Stock NO: 664 |
| Mouse: B6.Cg-Tg(BCL2)25 Wehi/J (Bcl2-tg) | Jackson laboratories | Stock NO: 002320 |
| Mouse: Bcl11b-YFP | Kueh et al., 2016 | N/A |
| Mouse: Bcl11b-YFP × BCL2 | This work | N/A |
| Mouse: B6.ROSA26-mTom;Bcl11b-YFP | This work | N/A |
| Oligonucleotides | ||
| Listed in Table S6 | ||
| Recombinant DNA | ||
| Software and Algorithms | ||
| Bedtools (v.2.17.0) | Quinlan and Hall, 20101 | http://bedtools.readthedocs.io/en/latest/ |
| Bioconductor (v3.4) | N/A | http://bioconductor.org/ |
| DESeq2 (v.1.14.1) | Love et al., 20142 | https://www.bioconductor.org/packages/devel/bioc/html/DESeq2.html |
| EdgeR (v.3.16.5) | Robinson et al., 20103 | http://bioconductor.org/packages/release/bioc/html/edgeR.html |
| FlowJo (v10.0.8) | N/A | https://www.flowjo.com/ |
| Ggplot2 (v.2.2.1) | N/A | http://ggplot2.org/ |
| MATLAB (R2016a) | N/A | https://www.mathworks.com/products/matlab.html |
| R (v3.4.2) | N/A | https://www.r-project.org/ |
| RSEM (v1.2.25) | Li and Dewey, 20114 | http://deweylab.github.io/RSEM/ |
| Rstudio (v1.1.383) | N/A | https://www.rstudio.com/ |
| Samtools (v0.1.19–96b5f2294a) | Li et al., 20095 | http://samtools.sourceforge.net/ |
| STAR (v2.4.0; v2.5.2a) | Dobin et al., 20136 | https://github.com/alexdobin/STAR/releases |
| Python(v3.6) | N/A | https://www.python.org |
| Custom probe design software | Shah et al., 2016b | Long Cai lab |
| Velocyto.py (v0.17.8) | La Manno et al., 2018 | http://velocyto.org/velocyto.py/ |
| Seurat (v2.3.4; v3.0.1) | Butler et al., 2018; Stuart et al. 2019 | https://satijalab.org/seurat/ |
| SPRING | Weinreb et al., 2018 | https://kleintools.hms.harvard.edu/tools/spring.html |
| Monocle v2 | Qiu et al., 2017a, 2017b | http://cole-trapnell-lab.github.io/monocle-release/ |
| Other | ||
| BD FACS Aria II Cell Sorter | BD Bioscience | N/A |
| Illumina HiSeq 2500 | Illumina | N/A |
| Illumina HiSeq 4000 | Illumina | N/A |
| iCyt Mission Technology Reflection Cell Sorter | Sony | N/A |
| BD FACSARIA FUSION Cell Sorter | BD Bioscience | N/A |
| Miltenyi Biotech MACSQuant 10 Flow Cytometer | Miltenyi Biotec | N/A |
| hyb-cells | Grace Bio-Labs | RD478685-M |
| Microscope | Leica | DMi8 |
| Confocal Scanner Unit | Yokogawa | CSU-W1 |
| sCMOS camera | Andor | Zyla 4.2 PLUS |
| 40x Oil Objective Lens NA1.30 | Leica | N/A |
| Motorized stage MS2000 | ASI | N/A |
| Leica wide-field fluorescence inverted microscope | Leica | 6000 |
| Black PDMS micromesh inserts | Microsurfaces | MMA-0250-100-08-01 |
References specifically used in Key Resources Table
Quinlan, A.R., and Hall, I.M. (2010). BEDTools: a flexible suite of utilities for comparing genomic features. Bioinformatics 26, 841–842.
Love, M.I., Huber, W., and Anders, S. (2014). Moderated estimation of fold change and dispersion for RNA-seq data with DESeq2. Genome Biol. 15, 550.
Robinson, M.D., McCarthy, D.J., and Smyth, G.K. (2010). edgeR: a Bioconductor package for differential expression analysis of digital gene expression data. Bioinformatics 26, 139–140.
Li, B., and Dewey, C.N. (2011). RSEM: accurate transcript quantification from RNA-Seq data with or without a reference genome. BMC Bioinformatics 12, 323.
Li, H., Handsaker, B., Wysoker, A., Fennell, T., Ruan, J., Homer, N., Marth, G., Abecasis, G., Durbin, R., and 1000 Genome Project Data Processing Subgroup (2009). The Sequence Alignment/Map format and SAMtools. Bioinformatics 25, 2078–2079.
Dobin, A., Davis, C.A., Schlesinger, F., Drenkow, J., Zaleski, C., Jha, S., Batut, P., Chaisson, M., and Gingeras, T.R. (2013). STAR: ultrafast universal RNA-seq aligner. Bioinformatics 29, 15–21.
Flow Cytometry and Cell Sorting
Unless otherwise noted, flow cytometry analysis and FACS of all samples were carried out using the procedures outlined. Briefly, cultured cells on tissue culture plates and primary cells from thymus were prepared as single cell suspensions, incubated in 2.4G2 Fc blocking solution, stained with respective surface cell markers as indicated (See STAR Key Resources Table), resuspended in HBH, and filtered through a 40 μm nylon mesh. They were then analyzed using a benchtop MacsQuant flow cytometer (Miltenyi Biotec, Auburn, CA) or sorted with a Sony Synergy 3200 cell sorter (Sony Biotechnology, Inc, San Jose, CA) for most of the single-cell transcriptome analyses and seqFISH samples, or with a FACSAria Fusion cell sorter (BD Biosciences) for the culture assays and ETP sub-population Cell Hashing scRNAseq. All antibodies used in these experiments are standard, commercially available monoclonal reagents widely established to characterize immune cell populations in the mouse; details are given in STAR Key Resources Table. Acquired flow cytometry data were all analyzed with FlowJo software (Tree Star).
Cell Cultures
Subsets of primary DN thymocytes FACS-purified as described above were cultured on a OP9-DL1 or OP9-control stromal monolayer system (Schmitt and Zúñiga-Pflücker, 2002) at 37°C in 7% CO 2 conditions with standard culture medium [80% αMEM (Gibco), 20% Fetal Bovine Serum (Sigma-Aldrich), Pen-Strep-Glutamine (Gibco), 50 μM β-mercaptoethanol (Sigma)] supplemented with appropriate cytokines (Lymphoid condition: Flt3L (Pepro Tech Inc.) 10 ng/mL, Human IL7 (Pepro Tech Inc.) 5 ng/mL; Myeloid condition: M-CSF(Pepro Tech Inc.), GM-CSF(Miltenyi Biotec), and IL-6(Pepro Tech Inc.) each at 5 ng/mL, SCF(Pepro Tech Inc.) at 1 ng/mL, and IL-3 (Pepro Tech Inc.) at 0.1 ng/mL.
Bulk RNAseq Analysis
Kithi CD44hi cells purified from B6.Bcl11byfp/yfp animals were subdivided into Flt3highCD25low ETP, Flt3lowCD25low ETP, Bcl11b-YFPnegCD25hi DN2a, and Bcl11b-YFPposCD25hi DN2a. fractions, followed by RNA purification following the instructions of the RNeasy Micro Kit (Qiagen 74004). cDNA from each sample was prepared with or without pre-amplification as indicated in Fig. 1. Pre-amplified samples were prepared with SMART-Seq v4 Ultra Low Input RNA Kit (Takara 634888) and Nextera XT library preparation kits (FC-131–1096) for Illumina sequencing, column 2, 6, 8,11 in Fig 1b–c). Samples without pre-amplification were prepared using NEBNext Ultra RNA Library Prep Kit for Illumina (E7530, NEB). All bulk libraries were sequenced on Illumina HiSeq2500 in single read mode with the read length of 50 nt. Base calls were performed with RTA 1.13.48.0 followed by conversion to FASTQ with bcl2fastq 1.8.4 and produced approximately 30 million reads per sample.
RNA-seq reads were mapped onto the mouse genome build GRCm38/mm10 using STAR (v2.4.0) and were post-processed with RSEM (v1.2.25; http://deweylab.github.io/RSEM/) according to the settings in the ENCODE long-rna-seq-pipeline (https://github.com/ENCODE-DCC/long-rna-seq-pipeline/blob/master/DAC/STAR_RSEM.sh), with the minor modifications that the setting ‘–output-genome-bam–sampling-for-bam’ was added to rsem-calculate-expression. STAR and RSEM reference libraries were created from genome build GRCm38/mm10 together with the Ensembl gene model file Mus_musculus.GRCm38.gtf. The resulting bam files were used to create HOMER tag directories (makeTagDirectory with –keepAll setting). For analysis of statistical significance among DEGs, the raw gene counts were derived from each tag directory with ‘analyzeRepeats.pl’ with the ‘– noadj -condenseGenes’ options, followed by the ‘getDiffExpression.pl’ command using EdgeR (v3.6.8; http://bioconductor.org/packages/release/bioc/html/edgeR.html). For data visualization, RPKM normalized reads were derived using the ‘analyzeRepeats.pl’ command with the options ‘–count exons –condenseGenes –rpkm’; genes with an average of RPKM ≥1 across samples were kept, and their RPKM values were processed by log transformation. The normalized datasets were then hierarchically clustered with R hclust function based on Euclidean distance and ‘complete’ linkage. The heatmap is visualized with R pheatmap with log2 transformed RPKM data (after adding 0.1 to all values).
Clonal Imaging Assay of Individual ETPs
To follow individual ETP clones by microscopic imaging, Kithi CD44hi CD25− ETP cells were purified from B6.ROSA26-mTom;Bcl11b-YFP mice (generated as described in the Animal sections above). Sorted ETP cells were plated onto OP9-DL1 stromal cells lacking GFP (OP9-DL1-delGFP1) in 24-well glass bottom plates with black 8mm circular poly(dimethyl siloxane) PDMS micromeshes with multiple microwells 250μM wide × 100 μM deep, custom fabricated by Microsurfaces (Australia). Cells were cultured in OP9 culture medium prepared as previously described except for the omission of the pH indicator, phenol red, from the medium, and with the addition of 10mM Hepes buffer to stabilize the pH of the wells during imaging, plus 10 ng/ml Flt3L, 5 ng/ml IL-7, and 0.05 mg/ml CD25-AlexaFluor647 (BioLegend), for detection of CD25 surface expression. Wells were imaged daily for 6 days on a Leica 6000 wide-field fluorescence inverted microscope with Metamorph software and an incubation chamber preset to 37°C, 7% CO2. Wells found to have exactly one mTomato positive cell on either day 1 or 2 were followed subsequently and scored for CD25 and Bcl11b-YFP fluorescence.
SeqFISH
Experimental Design
Using seqFISH, single transcripts can be robustly detected and localized in 3D in light-scattering tissue or in samples of thousands of cells. The strategy detects each targeted gene with up to 24 probes per gene using Hybridization Chain Reaction (HCR) amplification, in which all the probes against a given gene share the same HCR amplification handle and are detected in repeated sequential rounds of color-coded HCR in which each gene is decoded by a different sequence of colors (Shah et al., 2016a). Signals can be aligned by keeping the sample immobile under the microscope throughout all rounds of processing. This technique enables detection of transcripts even < 1 kb in size, with a fidelity comparable to conventional single molecule FISH (smFISH), and can be sequentially multiplexed (Shah et al., 2016b, 2016a).
T cells have relatively small cytoplasm compared to many cell lines and other cell types, and it was observed that smFISH analysis was relatively hard to perform due to the high relative content of cytoplasmic membrane and nuclear membrane sandwiching the small cytoplasm, yielding relatively dim fluorescent signals. To amplify the signal, therefore, we designed a 5-color-sequential barcoding scheme of HCR-seqFISH, using an error correction scheme that tolerates 1 round of signal dropout or inaccuracy as described before (Shah et al., 2016b). We applied HCR-seqFISH against 54 genes on FACS sorted and immobilized early T cells, followed by additional targeted HCR smFISH analyses and immunostaining on the same samples. Targeted HCR smFISH analyses, of only five genes at a time, were used for functionally important genes with particularly short transcripts which required maximal sensitivity, or for those particularly abundant transcripts which can obstruct detection of other species in the barcoding rounds. Briefly, 14–24 primary probes incorporating designed hairpin initiation sequence handles (hyb1) were hybridized to mRNA transcripts of genes of interest, followed by HCR signal amplification in 5 colors against the “handles”. Targeted mRNAs detected by amplified signals appear to be individual bright dots in microscope images, and were recorded and registered in space. Without moving the slide on the microscope, primary probes and readout hairpins were then digested with DNaseI, leaving mRNAs intact, and the second hybrization round of primary probes, with attached handles permuted (hyb2), were hybridized again. After HCR amplification, the second round of amplified signals in 5 colors were collected and registered to the previous hybridization. The steps were repeated until the completion of the designed sequential rounds of hybridization. The individual mRNA molecules were represented by the sequence of colors that appeared in the same registered spots. The identities of the mRNAs were encoded in the color sequence (color barcode details in Table S6).
SeqFISH Probe Design and Synthesis
The curated gene set that we selected as targets for seqFISH analysis consisted of regulatory genes that were judged likely to be functionally important in early T and lymphomyeloid development, based on previous genetic perturbation evidence, and lineage-associated genes that would be particularly informative as developmental state indicators (www.immgen.org) (Mingueneau et al., 2013)[reviewed in (Longabaugh et al., 2017; Rothenberg et al., 2016; Yui and Rothenberg, 2014)], as detailed in Table S2. The final list included 65 genes.
Gene-specific primary probes (35 nt long) were designed as previously described (Shah et al., 2016b), where 5 pairs of dye-coupled HCR hairpins (IR800, Alexa 647, Alexa 594, Cy3b, and Alexa 488) were used for signal amplification and readout from primary probes, and the 405nm channel was used for segmentation. Probes to be used in barcoding seqFISH were first subjected to stringent screening to avoid cross-reactivity, using the probe design software previously described (Shah et al., 2016b) with the following settings for this study. First, all candidate probes were BLASTed against the mouse transcriptome, and expected copy numbers of off-target probe hits were calculated using predicted RNA counts in the ENCODE database for murine thymocytes. BLAST hits with a 15-nt match on any sequences other than the target gene were considered off-target hits. For each target gene, any candidate probe that hit an expected cumulative total off-target copy number exceeding a threshold >0.1% of total was dropped, and candidate probes were sequentially dropped until no off-target gene was hit by more than 6 individual probes from the entire pool. At this stage, all of the “viable” probes for each gene had been identified. For the final probe set, the best possible subset from the viable probes was selected such that the final probes were non-overlapping and at least 2-nt bases apart from each other. The choice between which of two overlapping candidate probes to keep was based on their respective distances from the target GC content (55% in this case). As a final step to minimize cross-hybridization between probe sets, a local BLAST database was constructed from all the viable probe sequences, and all of the probes (including “handle” sequences) were queried against it. All matches of 17 nt or longer between probes were removed by dropping the matched probe from the larger probe set. The final probe set size for barcoding seqFISH was 14–24 probes per gene. For targeted, non-barcoding smHCR, 8–24 probes per gene were used, and genes were analyzed in groups of 5 per HCR round, with groups based on similar probe numbers per gene.
The template oligos were generated from array-synthesized oligopools from Oligoarray or Twist Bioscience, and amplified as described by (Chen et al., 2015) and (Shah et al., 2016b). To balance the probes’ concentrations, each of the template oligos were synthesized 3 times in the oligo pool, and probe pools for individual hybridizations were assigned a validated primer and assembled according to the following template (complete list in Table S6):
5’ -[Primer 1] - [KpnI] - [“TAG”] - [primary probe] - [HCR initiator] - [“GAT”] - [EcoRI] -[Primer 2] - 3’
List of amplification primers:
| Name | Primer1 | Primer2 | Batch of oligo pools |
|---|---|---|---|
| Barcode hyb 1 | AATTGAGCAGCTCGGGCCAC | GGCGATGGAAGCCTGCAACT | 1 |
| Barcode hyb 2 | CCGCACGCCGTCCTTAAATC | CTTTCCGTGCTGCCGGATCT | 1 |
| Barcode hyb 3 | GACGCACATATGCGGGCAAG | GGCATCTTCGTGACTGCGGA | 1 |
| Barcode hyb 4 | ATTGAGGGTCTTCGCGTGCC | GTAACCGGCGCTTTGCAACC | 1 |
| smHCR hyb 1 | TGTGCGCTCCGATTGTCCTC | GCAAATGGGGTCTGTTGGCC | 1 |
| smHCR hyb 2 | TGCAGCTCCGCGAAATGAAG | CGCTGCCTGTCTGTGCCATT | 1 |
| smHCR hyb 3 | TCAGGGCACGAGGACATTCG | TCCGGCAAGATTGCTCTCCC | 2 |
| smHCR hyb 4 | ATGCGCTGCAACTGAGACCG | TTGTGCCAGCCTTGGTCGAG | 2 |
SeqFISH Experimental Procedures and Imaging
The DN cells were purified as described in “Cell Purification” above, the ETP-DN2 population was FACS-sorted as a continuum as shown in Fig. S1c, and an equal number of DN3 cells was sorted separately, each population into tubes containing HBH buffer. Next, the isolated DN cell fractions were crosslinked with 4% Formaldehyde (ThermoScientific 28908) in 1X PBS for 10min. Then, cells were spun onto an amino-silane modified coverslip in hyb-cells (Grace Bio-Labs, RD478685-M). They were then crosslinked again with 4% Formaldehyde (ThermoScientific 28908) in 1× PBS for 10min, and permeabilized in 70% EtOH overnight at 4°C. Samples were imaged first to record the surface antibody signals, followed by briefly bleaching away antibody signals through incubation in 0.1% NaBH4 (Sigma 452882) in 1× PBS for 10min. Then, the samples were washed with PBS and pretreated with DNaseI (Roche Cat. #04716728001) at 1 U/μl for 2 hrs at 37°C, and washed 3 times with 50% Hybridization Buffer (50% HB: 2× SSC (Invitrogen 15557–036), 50% Formamide (v/v) (Ambion AM9344), 10% Dextran Sulfate (Sigma D8906) in Ultrapure water (Invitrogen 10977–015)). Following pre-treatment, samples were (1) hybridized overnight at 37°C with primary intron probes at concentrations of 1 nM each oligo in 50% Hybridization Buffer, then (2) washed in 50% Wash Buffer (2× SSC, 50% Formamide (v/v), 0.1% Triton-X 100 (Sigma X-100)) for 20 minutes, followed by incubation in 2× SSC for 10 minutes. The samples were then (3) incubated with HCR hairpins in Amplification Buffer (2× SSC, 10% Dextran Sulfate in Ultrapure water) for 30 minutes followed by (4) washing in 2× SSC for 5 min, and then in 10% Wash Buffer (2× SSC, 10% Formamide (v/v), 0.1% Triton-X 100 (Sigma X-100)) for 10 minutes. Before imaging, brief DAPI staining was performed for cell background registration and segmentation (DAPI 5μg/mL, 1min, Sigma D8417), then (5) imaged as described below. After image acquisition, (6) the samples were incubated with 1 U/μl DNaseI (Roche) for 3 hours at 37°C, and the remaining enzymes were washed out by 30 min incubation with 50% wash buffer at 37°C. The procedures (3)-(6) constituted one round and were repeated until the completion of all rounds of barcoding and non-barcoding HCR seqFISH.
Post RNA profiling, additional immunostaining with antibodies was performed in some experiments to quantitate transcription factor proteins. Specifically, samples were blocked with 1 × PBS, 1% BSA for 1 hour at room temperature, followed by incubation with anti-PU.1 or anti-TCF1, and anti-CD44 (not shown) (See STAR Key Resources Table) at 1:100 for 2 hours at room temperature, then washed in PBS 3 times, and then imaged. Note that antibodies used for surface staining, e.g. anti-cKit, were imaged before hybridization as described above.
Samples were imaged in an anti-bleaching buffer (20 mM Tris-HCl, 50 mM NaCl, 0.8% glucose, saturated trolox (Calbiochem 648471), pyranose oxidase (OD405 = 0.05) (Sigma P4234), and catalase at a dilution of 1/1000 (Sigma C3155)). Sample port covers were closed with a glass coverslip or a transparent polycarbonate sheet to exclude oxygen. The images were acquired with a microscope (Leica, DMi8) equipped with a confocal scanner unit (Yokogawa CSU-W1), sCMOS camera (Andor Zyla 4.2 PLUS), 40x oil objective lens (Leica NA 1.30), and a motorized stage (ASI MS2000). Lasers from CNI and filter sets from Semrock were used. Snapshots were acquired with 0.5 μm z steps for more than 30 positions per sample.
Image Processing and Analysis
The images were first corrected to remove the uneven illumination profiles in each channel, the effects of chromatic aberration, and registered for shift across all hybridizations as described before (Shah et al., 2016b).
For cell segmentation, the cell background taken in the DAPI channel without staining was first maximum z projected and blurred using a 2D Gaussian blur with a sigma of 1 pixel. The ImageJ-FIJI built in default dark thresholding algorithm was then used to separate out the cell boundary from background. Finally, the thresholded image was run through a watershed algorithm to demarcate individual cells. The obtained individual cell masks were further filtered by size (number of pixels between 600–3000) and circularity (between 0.7 to 1). The subsequent segmentation results were manually curated and corrected to obtain a final accurate segmentation of images.
The potential mRNA signals were then found by LOG filtering the registered images and finding points of local maxima above a specified threshold value. Once all potential points in all channels of all hybridizations were obtained, dots were matched to potential barcode partners in all other channels of all other hybridizations using a 3-pixel search radius to find symmetric nearest neighbors. The number of each barcode was then counted in each of the assigned segmented cells. Signals were decoded using the designed sequences of colors that should uniquely represent each targeted gene (Table S6).
The antibody staining quantification was performed with maximum z-projections for each channel. Average pixel intensities were quantified within individual cell segmentations, subtracted by average background intensity acquired in dummy segmentations (no cells) in the same fields of view, and multiplied by area to estimate the total signal. Because the quantification was performed after subtraction of background intensity, the total signal quantitation is not sensitive to segmentation accuracy or area size.
C1™-Fluidigm Smartseq2 Single Cell RNA-seq
ETP-DN2a cells were purified as a continuum as described above (Fig. S1c), except that no DN3 cells were pooled in for C1 analysis. The cells were then washed and resuspended to 250,000 cells/mL concentration in HBH buffer; 12 μL of this suspension was added to 8 μL of Fluidigm Cell Suspension Reagent for loading on the Fluidigm IFC (5–10 μm size). Cells were visually inventoried for doublets and empty chambers, and returned to the C1 for lysis, reverse transcription and amplification using the SMART-Seq v4 protocol. All amplified cDNA samples were quantified on Qubit and a subset were selected for BioAnalyzer sizing based on yield and chamber occupancy. The cDNA libraries were then tagmented using the Nextera XT DNA sample prep kit and Nextera XT indices. After tagmentation and amplification, libraries were pooled, cleaned up with Ampure XP beads (0.9× volume), quantified on Qubit and sized on the BioAnalyzer. Following the library preparation, the sequencing was performed with single read sequencing of 50nt on HiSeq2500 with a sequencing depth of 1.5×10⁶ reads per cell. The reads were mapped onto the GRCm38/mm10 mouse genome assembly.
10X Chromium V2 Single Cell RNA-seq
The DN thymocytes were enriched as described above, the ETP-DN2 population was sorted together as a continuum as shown in Fig. S1c, and DN3 cells were sorted separately. A small aliquot of DN3 cells representing ~10% of the total ETP-DN2 cells was added into the ETP-DN2 sample as a developmental endpoint internal reference. The sample was then washed and resuspended to 1 million cells/mL concentration in HBSS supplemented with 10% FBS and 10 mM HEPES, 17,400 cells were loaded into each 10X Chromium v2 lane, and the subsequent preparation was conducted following the instruction manual of 10X Chromium v2. The cDNA library and final library after index preparation were checked with bioanalyzer (High Sensitivity DNA reagents, Agilent Technology #5067–4626; Agilent 2100 Bioanalyzer) for quality control. Following the library preparation, the sequencing was performed with paired-end sequencing of 150nt each end on one lane of HiSeq4000 per sample, by Fulgent Genetics, Inc. (Temple City, CA). The reads were mapped onto the mouse genome Ensembl gene model file Mus_musculus.GRCm38.gtf using a standard CellRanger pipeline. Cells were sequenced to an average depth of 40,000–50,000 reads per cell (target 4×10⁸ reads per lane).
Cell Hashing with Single Cell RNAseq
DN cells were purified as described above, pooling thymus from eight female B6.Bcl11byfp/yfp mice, 5.5-weeks old. The 4 subsets of ETP cells (pops 1, 3, 4, 6) were sorted 4-way using the gates described in Fig. S8d. The sorted cells (total yield ~2000 per gate) were concentrated and each subset was incubated individually with TotalSeq A (Biolegend) anti-Mouse Hashtag 1, 2, 3, or 4 (1:50), respectively. A sorted reference population of ETP-DN2 continuum plus 10%DN3 cells, as in Fig. S1c, was tagged in parallel with anti-Mouse Hashtag 5. The samples were then washed 3 times with HBSS supplemented with 10% FBS and 10 mM HEPES, and pooled to load onto one lane of a 10X Chromium V3 chip. The cDNA preparation was performed following the instruction manual of 10X Chromium v3, and the hashtag library was prepared following the Biolegend TotalseqA guide. The cDNA, tag library, and final library after index preparation were checked with bioanalyzer (High Sensitivity DNA reagents, Agilent Technology #5067–4626; Agilent 2100 Bioanalyzer) for quality control. The cDNA final library was sequenced on NovaSeq 6000, and the tag library was sequenced on HiSeq4000, by Fulgent Genetics, Inc.. Cells were sequenced to an average depth of ~50,000 reads per cell for cDNA and ~2,500 reads per cell for hashtags.
Single Cell Expression Profile Data Analysis
Analytical Pipelines
The analysis methods applied and the relationships between different datasets and methods are abbreviated in the schematics in Fig.S1b. Specifically, the software/packages Seurat v2.3.4 and 3.0.1(Butler et al., 2018; Stuart et al., 2019), Monocle v2(Qiu et al., 2017a, 2017b), Velocyto v0.17.8 (La Manno et al., 2018), and SPRING (Weinreb et al., 2018) were used in this study, and 10X raw reads were mapped and assigned by Cell Ranger. Unsupervised analysis of low dimensional representations (tSNE, UMAP, SPRING), RNA velocity, and clustering were performed with gene sets filtered as described below.
Supervised clustering and pseudotime analysis of 10X data were performed based on the curated list of genes in Table S2, using quality control (QC)-trimmed 10X datasets from which the DN3b and granulocyte precursor clusters were computationally removed. For trajectory analysis, this improves developmental connectivity and T lineage relevance. For seqFISH analysis, data from the cells were QC trimmed as described below, and for high dimensional analysis, the expression was further normalized by RNA content/size, as described below.
Gene and Cell Filtering: Quality Control
In seqFISH analysis, cells with less than 250 barcoded transcripts detected (total from 54 barcoded genes) were omitted. In PCA and clustering analysis, similar to scRNAseq, the cells were first size-normalized to estimated RNA content. The RNA content in individual cells was estimated by total number of mRNA signals detected in one barcoding hybridization round without decoding. Applying the Quality Control (QC) filter resulted in 4551 cells from 4-week-old animals, 7150 cells from 5-week-old animals and 2598 cells from 8-week-old animals being presented in this study.
The C1 Fluidigm-Smartseq2 analysis was performed based on data filtered on cells that visually appeared to be single cells observed under the microscope in the Fluidigm chip, with at least 3600 genes expressed, less than 11% mitochondrial content, and with detectable expression of genes that are differentially expressed in bulk analysis described in Fig. 1d. The filter resulted in 193 cells presented in this study.
Unless otherwise specified, both supervised and unsupervised analysis of 10X Chromium V2 scRNAseq was based on data filtered on cells with at least 1200 genes expressed (transcript count over 1); outliers with more than 4500 genes were also removed (potential doublet), and only genes that were found expressed in at least 3 cells were kept in the analysis. For clustering, the cells were further cleaned to keep only cells with mitochondrial content of less than 5%, with signals normalized to total number of UMI and mitochondrial content as recommended by Seurat2. The QC filter resulted in 4627 cells in replicate 1 and 7076 cells in replicate 2 being presented in this study. The RNA velocity and pseudo-time analysis with Velocyto and Monocle 2, respectively, were performed on the cells that passed the filtering steps described above, and also with DN3b cluster and granulocyte precursor cluster removed (cluster 13 in unsupervised analysis, both replicates).
Unsupervised clustering analysis of 10X scRNAseq data was performed after log normalization and scaling, with 4307 variable genes identified in Seurat2 (average expression between 0.0125 and 3, and minimum dispersion of 0). Note that the dispersion filter was set low to allow capture of subtle features of the developmental continuum.
Inter-technique Comparison
We calculated the average raw gene expression levels in comparable cell input populations between different techniques in their own measurement units. The general expression levels were found to agree, allowing that the target genes mainly encode transcription factors and are expressed at very low levels. Overall, seqFISH was approximately tenfold more sensitive than 10X Chromium v2, in terms of estimated transcript counts per gene (Fig. S2b) and in a greatly reduced dropout rate, as shown for the functionally essential developmental regulatory genes in Fig. S2d. This finding is consistent with the previously described 10% sampling rate of 10X Chromium v2, at the sequencing depth being used (Islam et al., 2014; Kolodziejczyk et al., 2015). The discrepancies between the C1-Smartseq2 and 10X systems (Spearman correlation=0.68, Pearson correlation=0.57) are likely due to the difference in UMI and non-UMI based measurement unit, as amplification steps in Smartseq2 could result in biased readout of some genes. Aside from sensitivity differences, the biggest qualitative differences between sequencing based (C1-Smartseq2 and 10X) and seqFISH measurements on the selected genes are likely due to the fact that seqFISH by-passes any poly(A)-based reverse transcription-amplification step and probes directly at the exon regions of mRNAs. This can lead to the following: a) seqFISH can also probe the pre-mRNAs of genes of interest that have not been poly-adenylated; b) when the reverse transcription step in scRNAseq is inefficient that will lead to dropouts, such that sequencing would more robustly detect genes that are expressed at high levels; and c) miscalling of transcripts in seqFISH can occur due to crowded transcript signals in limited-sized lymphocytes. Indeed, the expression patterns of genes between seqFISH and 10X showed general agreement but were still only moderately correlated, as represented by Spearman correlation of 0.73 and Pearson correlation of 0.45 on the lowly-expressed regulatory gene transcripts (Fig S2b).
PU.1 and Bcl11b Perturbation data
The pseudotime model is compared with recently determined functional targets of PU.1 and Bcl11b, in Table S4 and Fig. 5f. Lists of genes activated or repressed by PU.1 were taken from the overlap of acute perturbation data for PU.1 gain and loss of function in DN2a-DN2b pro-T cells [Table S6B in (Ungerbäck et al., 2018)]. Specifically, the 326 PU.1-activated genes showed both enhanced activation 48h after exogneous PU.1 was introduced into DN2b cells and reduced expression 4d after endogenous Spi1 was disrupted from DN2a cells (p.adj<0.1). The 237 PU.1-repressed genes showed both downregulation in response to the exogenous PU.1 and upregulation when endogenous Spi1 was disrupted (p.adj<0.1). The 747 Bcl11b-repressed genes and 394 Bcl11b-dependent genes were defined from the intersection of genes responding significantly (p.adj < 0.05, at least twofold change) in the same direction in at least two different types of loss of function perturbations affecting DN2b-stage cells: in vivo deletion by Vav1-iCre, in vivo deletion by pLck-Cre, and/or in vitro acute deletion by Cas9 and guide RNA in DN2b cells [Supplementary Table 3 in (Hosokawa et al., 2018a)].
QUANTIFICATION AND STATISTICAL ANALYSIS
Experiments and techniques were carried out independently at least twice. Three independent seqFISH experiments were carried out, two independent 10X analyses were carried out on completely separate biological samples, and cell hashing 10X analysis of ETP subsets was carried out on a third completely independent biological sample. C1 data were pooled from ETP-DN2a cells sorted onto the chips in three separate experiments. While analyses shown in the paper are primarily from one of the three seqFISH replicates (in most cases the 4 wk old mouse sample) or one of the two 10X replicates (mostly replicate 1, which yielded greater sequencing depth per cell), the data were highly consistent between independently generated samples using the same technique, and highly consistent with the C1 analysis, as shown in Figs. S2 and S3. Cell culture experiments were carried out three to four times independently with concordant results as indicated in Fig.6 and Supplementary Figures S4, S5, and S8. Only the single-cell sorted experiments in Fig. 6f–h, which corroborate other data in Figs. 5, 6c–e, and S8, were not repeated as such. Cloning data in Fig. 1 (>60 clones) and Fig. 6f (>300 clones) each came from one experiment.
The statistical tests and specific settings used for each comparison are indicated in the individual figure and table legends.
DATA AND CODE AVAILABILITY
All sequence data generated in this study have been deposited in Gene Expression Omnibus and are available under accession numbers GSE130812 and GSE 137165. Sources for code used in this study are indicated in the Key Resources Table.
Supplementary Material
Figure S1: related to Figs. 1, 2, 3, 4, 5, 6, and 7
Figure S2: related to Fig. 2
Figure S3: related to Fig. 4
Figure S4: related to Figs. 2, 3, and 4
Figure S5: related to Figs. 2, 3, and 4
Figure S6: related to Fig. 4
Figure S7: related to Fig. 5
Figure S8: related to Fig. 6
Supplementary Table S1: related to Fig. 1
Supplementary Table S3: related to Fig. 2
Supplementary Table S5: related to Fig. 5
Supplementary Table S6: related to Fig. 2 and STAR Methods
Highlights.
Individual T-progenitors co-express legacy stem-cell and induced T-cell regulators
Three single-cell methods reveal transcription factor and whole-genome expression
Pseudotime cell ordering reveals single continuum, transient regulatory gene waves
In vitro developmental assays confirm pseudotime model and multilineage priming
ACKNOWLEDGMENTS
We thank Jeff Park, Paul Rivaud and Sisi Chen from the Caltech Single Cell Profiling and Engineering Center for help with the 10X Genomics samples, Andres Collazo and the Biological Imaging facility of Caltech for clonal live imaging support, Sean Upchurch and Diane Trout for C1 bioinformatic support, and members of the Rothenberg, Wold, and Cai labs for advice. We also thank Rochelle Diamond and members of the Caltech Flow Cytometry facility for sorting, Ingrid Soto for mouse care, Igor Antoshechkin and Vijaya Kumar of the Caltech Jacobs Genomics Facility and Xiwei Wu and the Integrative Genomic Core of City of Hope for Smartseq2 and bulk RNA sequencing. Support for this project came from USPHS grants (R01HL119102 and R01HD076915) to E.V.R., The Beckman Institute at Caltech for support of all the Caltech facilities, the Biology and Biological Engineering Division Bowes Leadership Chair Fund, the Louis A. Garfinkle Memorial Laboratory Fund, the Al Sherman Foundation, and the Albert Billings Ruddock Professorship to E.V.R.
Footnotes
Publisher's Disclaimer: This is a PDF file of an unedited manuscript that has been accepted for publication. As a service to our customers we are providing this early version of the manuscript. The manuscript will undergo copyediting, typesetting, and review of the resulting proof before it is published in its final form. Please note that during the production process errors may be discovered which could affect the content, and all legal disclaimers that apply to the journal pertain.
DISCLOSURE STATEMENT: L.C. is a co-founder and B.J.W. is a consultant of Spatial Genomics Inc. The authors declare no other conflicts of interest.
References
- Bell JJ, and Bhandoola A (2008). The earliest thymic progenitors for T cells possess myeloid lineage potential. Nature 452, 764–767. [DOI] [PubMed] [Google Scholar]
- Besseyrias V, Fiorini E, Strobl LJ, Zimber-Strobl U, Dumortier A, Koch U, Arcangeli M-L, Ezine S, MacDonald HR, and Radtke F (2007). Hierarchy of Notch–Delta interactions promoting T cell lineage commitment and maturation. J. Exp. Med 204, 331–343. [DOI] [PMC free article] [PubMed] [Google Scholar]
- Boudil A, Skhiri L, Candéias S, Pasqualetto V, Legrand A, Bedora-Faure M, Gautreau-Rolland L, Rocha B, and Ezine S (2013). Single-cell analysis of thymocyte differentiation: identification of transcription factor interactions and a major stochastic component in αβ-lineage commitment. PLoS One 8, e73098. [DOI] [PMC free article] [PubMed] [Google Scholar]
- Butler A, Hoffman P, Smibert P, Papalexi E, and Satija R (2018). Integrating single-cell transcriptomic data across different conditions, technologies, and species. Nat. Biotechnol 36, 411. [DOI] [PMC free article] [PubMed] [Google Scholar]
- Chen KH, Boettiger AN, Moffitt JR, Wang S, and Zhuang X (2015). RNA imaging. Spatially resolved, highly multiplexed RNA profiling in single cells. Science 348, aaa6090. [DOI] [PMC free article] [PubMed] [Google Scholar]
- De Obaldia ME, and Bhandoola A (2015). Transcriptional regulation of innate and adaptive lymphocyte lineages. Annu Rev Immunol 33, 607–642. [DOI] [PubMed] [Google Scholar]
- Del Real MM, and Rothenberg EV (2013). Architecture of a lymphomyeloid developmental switch controlled by PU.1, Notch and Gata3. Development. 140, 1207–1219. [DOI] [PMC free article] [PubMed] [Google Scholar]
- Evrard M, Kwok IWH, Chong SZ, Teng KWW, Becht E, Chen J, Sieow JL, Penny HL, Ching GC, Devi S, et al. (2018). Developmental Analysis of Bone Marrow Neutrophils Reveals Populations Specialized in Expansion, Trafficking, and Effector Functions. Immunity 48, 364–379.e8. [DOI] [PubMed] [Google Scholar]
- Franco CB, Scripture-Adams DD, Proekt I, Taghon T, Weiss AH, Yui MA, Adams SL, Diamond RA, and Rothenberg EV (2006). Notch/Delta signaling constrains reengineering of pro-T cells by PU.1. Proc. Natl. Acad. Sci. U. S. A 103, 11993–11998. [DOI] [PMC free article] [PubMed] [Google Scholar]
- García-Ojeda ME, Klein Wolterink RGJ, Lemaître F, Richard-Le Goff O, Hasan M, Hendriks RW, Cumano A, and Di Santo JP (2013). GATA-3 promotes T-cell specification by repressing B-cell potential in pro-T cells in mice. Blood 121, 1749–1759. [DOI] [PubMed] [Google Scholar]
- Germar K, Dose M, Konstantinou T, Zhang J, Wang H, Lobry C, Arnett KL, Blacklow SC, Aifantis I, Aster JC, et al. (2011). T-cell factor 1 is a gatekeeper for T-cell specification in response to Notch signaling. Proc. Natl. Acad. Sci. U. S. A 108, 20060–20065. [DOI] [PMC free article] [PubMed] [Google Scholar]
- Giladi A, Paul F, Herzog Y, Lubling Y, Weiner A, Yofe I, Jaitin D, Cabezas-Wallscheid N, Dress R, Ginhoux F, et al. (2018). Single-cell characterization of haematopoietic progenitors and their trajectories in homeostasis and perturbed haematopoiesis. Nat. Cell Biol 20, 836–846. [DOI] [PubMed] [Google Scholar]
- Gwin KA, Shapiro MB, Dolence JJ, Huang ZL, and Medina KL (2013). Hoxa9 and Flt3 signaling synergistically regulate an early checkpoint in lymphopoiesis. J. Immunol 191, 745–754. [DOI] [PMC free article] [PubMed] [Google Scholar]
- Heinzel K, Benz C, Martins VC, Haidl ID, and Bleul CC (2007). Bone marrow-derived hemopoietic precursors commit to the T cell lineage only after arrival in the thymic microenvironment. J Immunol 178, 858–868. [DOI] [PubMed] [Google Scholar]
- Hosokawa H, Romero-Wolf M, Yui MA, Ungerbäck J, Quiloan MLG, Matsumoto M, Nakayama KI, Tanaka T, and Rothenberg EV (2018a). Bcl11b sets pro-T cell fate by site-specific cofactor recruitment and by repressing Id2 and Zbtb16. Nat. Immunol 19, 1427–1440. [DOI] [PMC free article] [PubMed] [Google Scholar]
- Hosokawa H, Ungerbäck J, Wang X, Matsumoto M, Nakayama KI, Cohen SM, Tanaka T, and Rothenberg EV (2018b). Transcription Factor PU.1 Represses and Activates Gene Expression in Early T Cells by Redirecting Partner Transcription Factor Binding. Immunity 48, 1119–1134.e7. [DOI] [PMC free article] [PubMed] [Google Scholar]
- Hosoya T, Kuroha T, Moriguchi T, Cummings D, Maillard I, Lim K-C, and Engel JD (2009). GATA-3 is required for early T lineage progenitor development. J. Exp. Med 206, 2987–3000. [DOI] [PMC free article] [PubMed] [Google Scholar]
- Hu G, Cui K, Fang D, Hirose S, Wang X, Wangsa D, Jin W, Ried T, Liu P, Zhu J, et al. (2018). Transformation of Accessible Chromatin and 3D Nucleome Underlies Lineage Commitment of Early T Cells. Immunity 48, 227–242.e8. [DOI] [PMC free article] [PubMed] [Google Scholar]
- Hu M, Krause D, Greaves M, Sharkis S, Dexter M, Heyworth C, and Enver T (1997). Multilineage gene expression precedes commitment in the hemopoietic system. Genes Dev. 11, 774–785. [DOI] [PubMed] [Google Scholar]
- Ikawa T, Hirose S, Masuda K, Kakugawa K, Satoh R, Shibano-Satoh A, Kominami R, Katsura Y, and Kawamoto H (2010). An Essential Developmental Checkpoint for Production of the T Cell Lineage. Science 329, 93–96. [DOI] [PubMed] [Google Scholar]
- Ishizuka IE, Chea S, Gudjonson H, Constantinides MG, Dinner AR, Bendelac A, and Golub R (2016). Single-cell analysis defines the divergence between the innate lymphoid cell lineage and lymphoid tissue-inducer cell lineage. Nat Immunol 17, 269–276. [DOI] [PMC free article] [PubMed] [Google Scholar]
- Islam S, Zeisel A, Joost S, La Manno G, Zajac P, Kasper M, Lönnerberg P, and Linnarsson S (2014). Quantitative single-cell RNA-seq with unique molecular identifiers. Nat. Methods 11, 163–166. [DOI] [PubMed] [Google Scholar]
- Karamitros D, Stoilova B, Aboukhalil Z, Hamey F, Reinisch A, Samitsch M, Quek L, Otto G, Repapi E, Doondeea J, et al. (2018). Single-cell analysis reveals the continuum of human lympho-myeloid progenitor cells. Nat. Immunol 19, 85–97. [DOI] [PMC free article] [PubMed] [Google Scholar]
- Knapp DJHF, Hammond CA, Hui T, van Loenhout MTJ, Wang F, Aghaeepour N, Miller PH, Moksa M, Rabu GM, Beer PA, et al. (2018). Single-cell analysis identifies a CD33+ subset of human cord blood cells with high regenerative potential. Nat. Cell Biol 20, 710–720. [DOI] [PubMed] [Google Scholar]
- Kolodziejczyk AA, Kim JK, Svensson V, Marioni JC, and Teichmann SA (2015). The Technology and Biology of Single-Cell RNA Sequencing. Mol. Cell 58, 610–620. [DOI] [PubMed] [Google Scholar]
- Kueh HY, Champhekar A, Champhekhar A, Nutt SL, Elowitz MB, and Rothenberg EV (2013). Positive feedback between PU.1 and the cell cycle controls myeloid differentiation. Science 341, 670–673. [DOI] [PMC free article] [PubMed] [Google Scholar]
- Kueh HY, Yui MA, Ng KK, Pease SS, Zhang JA, Damle SS, Freedman G, Siu S, Bernstein ID, Elowitz MB, et al. (2016). Asynchronous combinatorial action of four regulatory factors activates Bcl11b for T cell commitment. Nat Immunol 17, 956–965. [DOI] [PMC free article] [PubMed] [Google Scholar]
- La Manno G, Soldatov R, Zeisel A, Braun E, Hochgerner H, Petukhov V, Lidschreiber K, Kastriti ME, Lönnerberg P, Furlan A, et al. (2018). RNA velocity of single cells. Nature 560, 494–498. [DOI] [PMC free article] [PubMed] [Google Scholar]
- Laiosa CV, Stadtfeld M, Xie H, de Andres-Aguayo L, and Graf T (2006). Reprogramming of committed T cell progenitors to macrophages and dendritic cells by C/EBPα and PU.1 transcription factors. Immunity 25, 731–744. [DOI] [PubMed] [Google Scholar]
- Li L, Leid M, and Rothenberg EV (2010). An Early T Cell Lineage Commitment Checkpoint Dependent on the Transcription Factor Bcl11b. Science 329, 89–93. [DOI] [PMC free article] [PubMed] [Google Scholar]
- Longabaugh WJR, Zeng W, Zhang JA, Hosokawa H, Jansen CS, Li L, Romero-Wolf M, Liu P, Kueh HY, Mortazavi A, et al. (2017). Bcl11b and combinatorial resolution of cell fate in the T-cell gene regulatory network. Proc. Natl. Acad. Sci 114, 5800–5807. [DOI] [PMC free article] [PubMed] [Google Scholar]
- Lubeck E, Coskun AF, Zhiyentayev T, Ahmad M, and Cai L (2014). Single-cell in situ RNA profiling by sequential hybridization. Nat Methods 11, 360–361. [DOI] [PMC free article] [PubMed] [Google Scholar]
- Mercer EM, Lin YC, Benner C, Jhunjhunwala S, Dutkowski J, Flores M, Sigvardsson M, Ideker T, Glass CK, and Murre C (2011). Multilineage Priming of Enhancer Repertoires Precedes Commitment to the B and Myeloid Cell Lineages in Hematopoietic Progenitors. Immunity 35, 413–425. [DOI] [PMC free article] [PubMed] [Google Scholar]
- Mingueneau M, Kreslavsky T, Gray D, Heng T, Cruse R, Ericson J, Bendall S, Spitzer MH, Nolan GP, Kobayashi K, et al. (2013). The transcriptional landscape of αβ T cell differentiation. Nat. Immunol 14, 619–632. [DOI] [PMC free article] [PubMed] [Google Scholar]
- Ng KK, Yui MA, Mehta A, Siu S, Irwin B, Pease S, Hirose S, Elowitz MB, Rothenberg EV, and Kueh HY (2018). A stochastic epigenetic switch controls the dynamics of T-cell lineage commitment. eLife 7, e37851. [DOI] [PMC free article] [PubMed] [Google Scholar]
- Olariu V, Yui MA, Krupinski P, Zhou W, Deichmann J, Rothenberg EV, and Peterson C (2019). Multi-scale dynamical modelling of T-cell development from an early thymic progenitor state to lineage commitment. bioRxiv 667709. [DOI] [PMC free article] [PubMed] [Google Scholar]
- Olsson A, Venkatasubramanian M, Chaudhri VK, Aronow BJ, Salomonis N, Singh H, and Grimes HL (2016). Single-cell analysis of mixed-lineage states leading to a binary cell fate choice. Nature 537, 698–702. [DOI] [PMC free article] [PubMed] [Google Scholar]
- Orkin SH (2003). Priming the Hematopoietic Pump. Immunity 19, 633–634. [DOI] [PubMed] [Google Scholar]
- Paul F, Arkin Y, Giladi A, Jaitin DA, Kenigsberg E, Keren-Shaul H, Winter D, Lara-Astiaso D, Gury M, Weiner A, et al. (2015). Transcriptional heterogeneity and lineage commitment in myeloid progenitors. Cell 163, 1663–1677. [DOI] [PubMed] [Google Scholar]
- Pina C, Fugazza C, Tipping AJ, Brown J, Soneji S, Teles J, Peterson C, and Enver T (2012). Inferring rules of lineage commitment in haematopoiesis. Nat Cell Biol 14, 287–294. [DOI] [PubMed] [Google Scholar]
- Porritt HE, Gordon K, and Petrie HT (2003). Kinetics of steady-state differentiation and mapping of intrathymic-signaling environments by stem cell transplantation in nonirradiated mice. J. Exp. Med 198, 957–962. [DOI] [PMC free article] [PubMed] [Google Scholar]
- Pui JC, Allman D, Xu L, DeRocco S, Karnell FG, Bakkour S, Lee JY, Kadesch T, Hardy RR, Aster JC, et al. (1999). Notch1 expression in early lymphopoiesis influences B versus T lineage determination. Immunity 11, 299–308. [DOI] [PubMed] [Google Scholar]
- Qiu X, Mao Q, Tang Y, Wang L, Chawla R, Pliner HA, and Trapnell C (2017a). Reversed graph embedding resolves complex single-cell trajectories. Nat. Methods 14, 979–982. [DOI] [PMC free article] [PubMed] [Google Scholar]
- Qiu X, Hill A, Packer J, Lin D, Ma Y-A, and Trapnell C (2017b). Single-cell mRNA quantification and differential analysis with Census. Nat. Methods 14, 309–315. [DOI] [PMC free article] [PubMed] [Google Scholar]
- Radtke F, Wilson A, Stark G, Bauer M, van Meerwijk J, MacDonald HR, and Aguet M (1999). Deficient T cell fate specification in mice with an induced inactivation of Notch1. Immunity 10, 547–558. [DOI] [PubMed] [Google Scholar]
- Raj A, Peskin CS, Tranchina D, Vargas DY, and Tyagi S (2006). Stochastic mRNA synthesis in mammalian cells. PLoS Biol 4, e309. [DOI] [PMC free article] [PubMed] [Google Scholar]
- Ramond C, Berthault C, Burlen-Defranoux O, de Sousa AP, Guy-Grand D, Vieira P, Pereira P, and Cumano A (2014). Two waves of distinct hematopoietic progenitor cells colonize the fetal thymus. Nat Immunol 15, 27–35. [DOI] [PubMed] [Google Scholar]
- Rothenberg EV, Moore JE, and Yui MA (2008). Launching the T-cell-lineage developmental programme. Nat. Rev. Immunol 8, 9–21. [DOI] [PMC free article] [PubMed] [Google Scholar]
- Rothenberg EV, Ungerbäck J, and Champhekar A (2016). Forging T-Lymphocyte Identity: Intersecting Networks of Transcriptional Control. Adv. Immunol 129, 109–174. [DOI] [PMC free article] [PubMed] [Google Scholar]
- Sambandam A, Maillard I, Zediak VP, Xu L, Gerstein RM, Aster JC, Pear WS, and Bhandoola A (2005). Notch signaling controls the generation and differentiation of early T lineage progenitors. Nat. Immunol 6, 663. [DOI] [PubMed] [Google Scholar]
- Saran N, Lyszkiewicz M, Pommerencke J, Witzlau K, Vakilzadeh R, Ballmaier M, von Boehmer H, and Krueger A (2010). Multiple extrathymic precursors contribute to T-cell development with different kinetics. Blood 115, 1137–1144. [DOI] [PMC free article] [PubMed] [Google Scholar]
- Schilham MW, Wilson A, Moerer P, Benaissa-Trouw BJ, Cumano A, and Clevers HC (1998). Critical involvement of Tcf-1 in expansion of thymocytes. J. Immunol 161, 3984–3991. [PubMed] [Google Scholar]
- Schmitt TM, and Zúñiga-Pflücker JC (2002). Induction of T cell development from hematopoietic progenitor cells by Delta-like-1 in vitro. Immunity 17, 749–756. [DOI] [PubMed] [Google Scholar]
- Scripture-Adams DD, Damle SS, Li L, Elihu KJ, Qin S, Arias AM, Butler RR, Champhekar A, Zhang JA, and Rothenberg EV (2014). GATA-3 dose-dependent checkpoints in early T cell commitment. J. Immunol 193, 3470–3491. [DOI] [PMC free article] [PubMed] [Google Scholar]
- Shah S, Lubeck E, Schwarzkopf M, He TF, Greenbaum A, Sohn CH, Lignell A, Choi HM, Gradinaru V, Pierce NA, et al. (2016a). Single-molecule RNA detection at depth by hybridization chain reaction and tissue hydrogel embedding and clearing. Development 143, 2862–2867. [DOI] [PMC free article] [PubMed] [Google Scholar]
- Shah S, Lubeck E, Zhou W, and Cai L (2016b). In Situ Transcription Profiling of Single Cells Reveals Spatial Organization of Cells in the Mouse Hippocampus. Neuron 92, 342–357. [DOI] [PMC free article] [PubMed] [Google Scholar]
- Stoeckius M, Zheng S, Houck-Loomis B, Hao S, Yeung BZ, Mauck WM, Smibert P, and Satija R (2018). Cell Hashing with barcoded antibodies enables multiplexing and doublet detection for single cell genomics. Genome Biol. 19, 224. [DOI] [PMC free article] [PubMed] [Google Scholar]
- Strasser A, Harris AW, and Cory S (1991). bcl-2 transgene inhibits T cell death and perturbs thymic self-censorship. Cell 67, 889–899. [DOI] [PubMed] [Google Scholar]
- Stuart T, Butler A, Hoffman P, Hafemeister C, Papalexi E, Mauck WM, Hao Y, Stoeckius M, Smibert P, and Satija R (2019). Comprehensive Integration of Single-Cell Data. Cell 177, 1888–1902.e21. [DOI] [PMC free article] [PubMed] [Google Scholar]
- Taghon TN, David ES, Zúñiga-Pflücker JC, and Rothenberg EV (2005). Delayed, asynchronous, and reversible T-lineage specification induced by Notch/Delta signaling. Genes Dev 19, 965–978. [DOI] [PMC free article] [PubMed] [Google Scholar]
- Ting CN, Olson MC, Barton KP, and Leiden JM (1996). Transcription factor GATA-3 is required for development of the T-cell lineage. Nature 384, 474–478. [DOI] [PubMed] [Google Scholar]
- Tusi BK, Wolock SL, Weinreb C, Hwang Y, Hidalgo D, Zilionis R, Waisman A, Huh JR, Klein AM, and Socolovsky M (2018). Population snapshots predict early haematopoietic and erythroid hierarchies. Nature 555, 54–60. [DOI] [PMC free article] [PubMed] [Google Scholar]
- Ungerbäck J, Hosokawa H, Wang X, Strid T, Williams BA, Sigvardsson M, and Rothenberg EV (2018). Pioneering, chromatin remodeling, and epigenetic constraint in early T-cell gene regulation by SPI1 (PU.1). Genome Res. 28, 1508–1519. [DOI] [PMC free article] [PubMed] [Google Scholar]
- van Galen P, Kreso A, Wienholds E, Laurenti E, Eppert K, Lechman ER, Mbong N, Hermans K, Dobson S, April C, et al. (2014). Reduced Lymphoid Lineage Priming Promotes Human Hematopoietic Stem Cell Expansion. Cell Stem Cell 14, 94–106. [DOI] [PubMed] [Google Scholar]
- Velten L, Haas SF, Raffel S, Blaszkiewicz S, Islam S, Hennig BP, Hirche C, Lutz C, Buss EC, Nowak D, et al. (2017). Human haematopoietic stem cell lineage commitment is a continuous process. Nat. Cell Biol 19, 271–281. [DOI] [PMC free article] [PubMed] [Google Scholar]
- Wada H, Masuda K, Satoh R, Kakugawa K, Ikawa T, Katsura Y, and Kawamoto H (2008). Adult T-cell progenitors retain myeloid potential. Nature 452, 768–772. [DOI] [PubMed] [Google Scholar]
- Waltman L, and van Eck NJ (2013). A smart local moving algorithm for large-scale modularity-based community detection. Eur. Phys. J. B 86, 471. [Google Scholar]
- Wang H, Zang C, Taing L, Arnett KL, Wong YJ, Pear WS, Blacklow SC, Liu XS, and Aster JC (2014). NOTCH1-RBPJ complexes drive target gene expression through dynamic interactions with superenhancers. Proc. Natl. Acad. Sci. U. S. A 111, 705–710. [DOI] [PMC free article] [PubMed] [Google Scholar]
- Weber BN, Chi AW-S, Chavez A, Yashiro-Ohtani Y, Yang Q, Shestova O, and Bhandoola A (2011). A critical role for TCF-1 in T-lineage specification and differentiation. Nature 476, 63–68. [DOI] [PMC free article] [PubMed] [Google Scholar]
- Weinreb C, Wolock S, and Klein AM (2018). SPRING: a kinetic interface for visualizing high dimensional single-cell expression data. Bioinformatics 34, 1246–1248. [DOI] [PMC free article] [PubMed] [Google Scholar]
- Yui MA, and Rothenberg EV (2014). Developmental gene networks: a triathlon on the course to T cell identity. Nat Rev Immunol 14, 529–545. [DOI] [PMC free article] [PubMed] [Google Scholar]
- Yui MA, Feng N, and Rothenberg EV (2010). Fine-Scale Staging of T Cell Lineage Commitment in Adult Mouse Thymus. J. Immunol 185, 284–293. [DOI] [PMC free article] [PubMed] [Google Scholar]
- Zandi S, Åhsberg J, Tsapogas P, Stjernberg J, Qian H, and Sigvardsson M (2012). Single-cell analysis of early B-lymphocyte development suggests independent regulation of lineage specification and commitment in vivo. Proc Natl Acad Sci U A 109, 15871–15876. [DOI] [PMC free article] [PubMed] [Google Scholar]
- Zhang JA, Mortazavi A, Williams BA, Wold BJ, and Rothenberg EV (2012). Dynamic transformations of genome-wide epigenetic marking and transcriptional control establish T cell identity. Cell 149, 467–482. [DOI] [PMC free article] [PubMed] [Google Scholar]
- Zheng S, Papalexi E, Butler A, Stephenson W, and Satija R (2018). Molecular transitions in early progenitors during human cord blood hematopoiesis. Mol. Syst. Biol 14, e8041. [DOI] [PMC free article] [PubMed] [Google Scholar]
Associated Data
This section collects any data citations, data availability statements, or supplementary materials included in this article.
Supplementary Materials
Figure S1: related to Figs. 1, 2, 3, 4, 5, 6, and 7
Figure S2: related to Fig. 2
Figure S3: related to Fig. 4
Figure S4: related to Figs. 2, 3, and 4
Figure S5: related to Figs. 2, 3, and 4
Figure S6: related to Fig. 4
Figure S7: related to Fig. 5
Figure S8: related to Fig. 6
Supplementary Table S1: related to Fig. 1
Supplementary Table S3: related to Fig. 2
Supplementary Table S5: related to Fig. 5
Supplementary Table S6: related to Fig. 2 and STAR Methods
Data Availability Statement
All sequence data generated in this study have been deposited in Gene Expression Omnibus and are available under accession numbers GSE130812 and GSE 137165. Sources for code used in this study are indicated in the Key Resources Table.