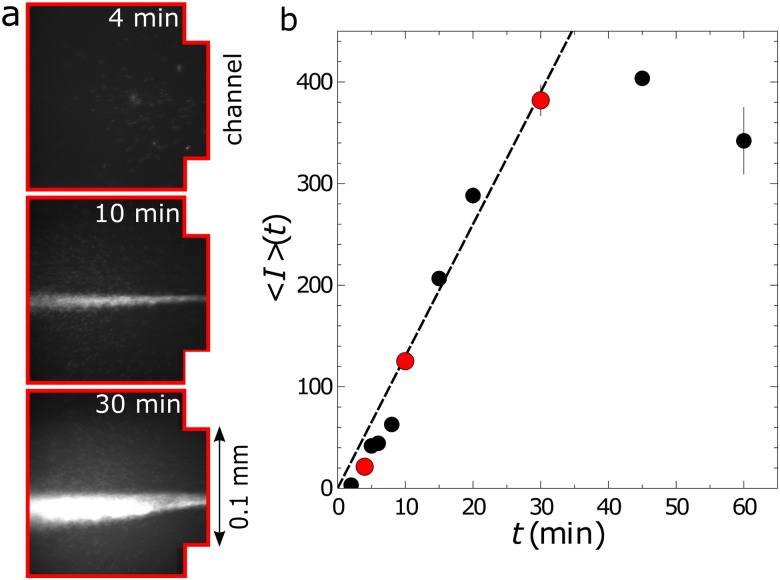
FIG. 2.
(a) Microscopy images showing the buildup of DNA at the inlet to the channel at three different times for in. ( and ) and solution 8. The images were collected at the inlet of the channel [red area in Fig. 1(a)]. (b) Mean intensity as a function of time at the inlet for the same conditions as the images. The red circles correspond to the mean intensities from the images in (a).

