Abstract
Tumor-derived circulating exosomes have been recognized as a promising biomarker source for cancer diagnosis via a less invasive procedure. The integration of isolation and detection of exosomes in routine clinical settings is still challenging. In this study, we developed a new microfluidic device for immunomagnetic separation and detection of blood exosomes in situ. The microfluidic device may empower the integration of target exosome analysis via high surface to volume ratios of immunomagnetic beads and highly precise fluid control with the aid of microvalves. The obtained microfluidic device was capable of on-chip isolation and detection of circulating exosomes within 1.5 h. The captured exosomes could be directly visualized with an inverted fluorescence microscope in situ by tetramethylbenzidine-based colorimetric sensing. It was revealed that a statistically significant increase (p < 0.01) in EpCAM-positive exosomes was captured for cancer patients (n = 10) on the device when compared to healthy individuals (n = 10). The device also demonstrated high predicting accuracy for tumor exosomal markers with a sensitivity of 90% and a specificity of >95% using receiver operating characteristic curves. The microfluidic device might provide a new platform to assist cancer diagnosis and molecular classification in an automated and simple fashion.
I. INTRODUCTION
Exosomes are a distinct population of small microvesicles with a diameter of 30–150 nm, which can be actively released by most cell types.1 Cancer cell-derived exosomes carry a variety of tumor-specific cargos (e.g., proteins, mRNAs, miRNAs), which play important roles in the initiation and the in-transit spread of tumor metastasis.2,3 Such cell-secreted exosomes have also been found to be abundant in various bodily fluids, such as blood plasma, saliva, amniotic fluid, breast milk, and urine.4–7 These bodily fluids are easy to obtain and will not cause any damage to the body during the sampling process. Thus, cancer cell-derived exosomes have emerged as highly promising noninvasive markers for early cancer diagnosis and the prediction of cancer prognosis.8–10
Despite their potential for diagnostic applications, analysis of exosomes is highly challenging due to their nanoscale size range and overlapping features with other extracellular vesicles. The most common procedure for purifying exosomes involves a series of high-speed ultracentrifugation steps in order to remove cell debris and pellet exosomes.11,12 Large cells or vesicles can be separated using standard centrifugation (<20 000 g), whereas ultracentrifugation (>100 000 g) must be used to purify exosomes from protein contaminates. This complicated procedure is time-consuming (∼5 h),11 requires rigorous technical training, and results in relatively low recovery (5%–25%).11,13 Enzyme-linked immunosorbent assay (ELISA) and western blot analysis are widely used as standard methods for exosome detection; however, they are limited by large sample demand and multistep operations.14,15 Moreover, current exosome analysis requires lengthy overnight incubations and are vulnerable to contaminations, leading to significant discrepancies in the results.16 As a consequence, it is desirable to develop novel platforms to realize the integration of isolation and detection of exosomes with the characteristics of rapid, accurate, and less exosome loss.
Microfluidics provides an effective platform for manipulating small quantities of exosomal samples with enhanced purity capabilities and precision.17,18 The techniques developed so far for microfluidics-based exosomal isolation are based on physical characteristics (size,19–23 density,24 and electrical properties25–27) and/or biological characteristics (antibody–antigen reaction28–30 and aptamers31,32). Although physical microfluidic techniques have shown unique advantages for label-free and high-throughput isolation, these approaches have not completely distinguished exosomes as a specific population apart from other vesicles with similar sizes and densities.33 Immunoaffinity-based microfluidic approach utilizes antibody/aptamer coated magnetic beads or the inner surface to capture exosomes that contain specific markers (e.g., CD63, CD81, and MHC I) in body fluids.28,30 This method allows a specific subpopulation of exosomes to be isolated, but downstream detection generally needs several preparatory procedures such as incubation with antibodies and several washing steps.31 It is desirable to the integration of multistep operations on this single platform in a simple manner.
In this report, we present a new microfluidic device that enables on-chip immunoisolation and in situ protein analysis of exosomes directly from the blood of cancer patients. The microfluidic device may empower the integration of isolation, staining, and detection of target exosomes via highly precise fluid control with the aid of microvalves. The purified exosomes being fixed in the device are beneficial for further analysis, such as immunoassay, western blot analysis, and electron microscopy imaging. Spike-in tests and clinical tests have also been performed with whole blood from healthy donors and patients to verify the practicability of the device for exosome analysis.
II. MATERIALS AND METHODS
A. Design and fabrication of the integrated microfluidic device
The microfluidic device was assembled in six parts including a cover plate, a sealing layer, a chamber layer, a channel layer, a magnet, and a mounting plate. The cover plate and the mounting plate each were connected with six gas channels. The chamber layer and the sealing layer were customized from Dalian Huaye Hardware Products Co., Ltd, China, and the chamber layer had six chambers corresponding to the sealing layer and the cover layer. The channel layer was fabricated by two polydimethylsiloxane (PDMS) chips that were prepared using standard photolithography. The thickness of the two PDMS chips was 1.5 mm. Before sealing, 5% polyvinyl pyrrolidone (PVP) (Sigma-Aldrich, Germany) in alcohol was used to modify the valves to avoid linking, and a surface treatment for the PDMS chips' channels was applied to avoid nonspecific adsorption using a hydrophobic reagent (2% Perfluoroctyl trichlorosilane, Macklin, China) in FC40. Then, they bonded with each other permanently after surface cleaning with UV Ozone (Tonson, China).
B. On-chip magnetic field simulation
The interaction between the magnet and immunomagnetic beads on the microfluidic device was simulated using COMSOL. The magnet was a cylinder with a radius of 3 mm and a height of 4 mm. A sphere with a radius of 1 μm was used to simulate the immunomagnetic beads. The relative permeability was 4000. The magnetic force on the beads was calculated when the beads in the microchannel were at different distances from the magnet. The time when the beads transferred onto the magnet was calculated when we assumed that the magnetic force was constant.
C. Sample preparation
The human breast cancer cell line MCF-7 was cultured in Dulbecco's Modified Eagle's Medium supplemented with 10% exosome-depleted fetal bovine serum (FBS), 1% nonessential amino acid, 1% glutaMAX, 1% penicillin-streptomycin, and 0.01 mg/ml insulin at 37 °C in a humid atmosphere with 5% CO2. The exosome-depleted FBS was prepared by differential centrifugation in a SW32 Ti rotor (Beckman Coulter, Inc., USA) as reported.34 Cell medium was refreshed when cells covered 80% of the culture dishes and harvested after 48 h. Exosomes were purified from the modified media using a method described previously.35 In brief, 200 ml of MCF-7 cell culture media were harvested and centrifuged at 2000g at 4 °C for 20 min to remove cell debris; then, the supernatant was centrifuged at 10 000g for 30 min to remove large microvesicles in order to concentrate on the exosomes in a cell culture medium. After filtering through a commercial 0.22 μm filter, the filtrate was centrifuged at 4 °C for 90 min in a SW32 Ti rotor to precipitate the exosomes. The pellet was washed with 20 ml PBS two times by repeating the centrifugation conditions of the last step. The resulting pellet was resuspended in 100 μl phosphate buffer saline (PBS) and stored at −80 °C for future use.
Twenty discarded clinical blood samples were obtained from the First Affiliated Hospital of Dalian Medical University according to a protocol approved by the university’s Institutional Review Board. Cells and cell debris were removed by centrifuging at 2000g at 4 °C for 20 min. The supernatant was collected and centrifuged at 10 000g at 4 °C for 30 min to remove the microvesicles. The clear supernatant as a serum was then filtered through a commercial 0.22 μm filter and stored immediately at −80 °C until use.
D. Device operation for exosome enrichment and analysis
Exosome enrichment on the integrated microfluidic device was based on the immunoaffinity approach described previously.17 Before exosomal analysis, the blank microfluidic device was measured at a wavelength of 370 nm using a spectrophotometer in order to get the background value. Then, the magnetic beads labeled with streptavidin (Invitrogen, USA), which had a diameter of 1–1.5 μm and a concentration of 5 × 10⁷ particles/ml, were conjugated with biotinylated EpCAM antibodies (Abcam, UK, mouse) for target-specific exosome enrichment. After incubating with modified magnetic beads, the prepared samples were transferred into the chamber of the microfluidic device, and PBS, EpCAM first antibody (Abcam, UK, rabbit), horseradish peroxidase (HRP) labeled secondary antibody (Beyotime, China, rabbit), and tetramethylbenzidine (TMB) substrate (Beyotime, China), which could produce blue soluble products under the catalysis of horseradish peroxidase, were transferred into the relative chambers subsequently. Then, the microfluidic device was run following the previously prepared programs. The programs contained seven steps including immunomagnetic bead capture, PBS washing, primary antibody incubation, PBS washing, horseradish peroxidase labeled secondary antibody incubation, PBS washing, and color development. For the reagents introduced, each step was run for 5 s, stopped for 20 s, and cycled for 5 times, and 20 min incubation time existed after the primary and secondary antibodies were introduced. After color development, the device was incubated at ambient temperature for 15 min in darkness. The optical density (OD) value of the microfluidic device was measured at a wavelength of 370 nm using a spectrophotometer with the negative control of PBS, and the change in OD value (ΔOD value) was obtained by subtracting the background value of the blank microfluidic device.
E. Fluorescence characterization and western blot analysis
Immunofluorescent assay was used to see whether the immunomagnetic beads had captured exosomes. Fetal bovine serum (ZSGB-BIO, China) was used to avoid nonspecific adsorption after samples were incubated with modified magnetic beads. EpCAM-FITC antibody (Abcam, UK, rabbit) with a concentration of 2 μg/ml was incubated with the samples at 4 °C overnight. After washing with PBS, a fluorescence microscope (Leica, Germany) was used to observe the fluorescence of the samples. An exosome concentration assay kit (Bioruo, China) was also used to quantify the enrichment of the microfluidic device.
Exosomes from the cell culture medium (undiluted, serially diluted to 1:2, 1:4, 1:8, 1:16) were lysed in a protein lysis buffer (1% RMSF and 1% protease inhibitor in RIPA). Protein lysates were resolved by sodium dodecyl sulfate polyacrylamide gel electrophoresis (SDS-PAGE) and then were transferred onto polyvinylidene fluoride (PVDF) membranes and immunoblotted with antibody against EpCAM, which was used at a 1:1000-fold dilution. Following incubation with horseradish peroxidase-conjugated secondary antibody (1:5000-fold dilution), chemiluminescence was used for immunodetection. All of the western blot analysis reagents were obtained from Beyotime, China.
F. Scanning electron microscopy imaging
All samples were fixed with 4% paraformaldehyde (Tianjin Damao, China) in PBS and washed twice with PBS. After dehydration in a series of increasing alcohol concentrations (10%, 30%, 50%, 60%, 70%, 80%, 90%, 95%, 100% in PBS), samples were dried at ambient temperature for 30 min and subsequently coated with gold using a sputter coater (KYKY Technology Co. LTD., China) before imaging with a scanning electron microscope (Jeol Ltd., Japan).
G. Statistical analyses
A two-sided Student t-test was performed for the indicated assays, in which a p value less than 0.01 was considered statistically significant. Box-Whisker analysis was performed using Origin 8.0. A receiver operator characteristic curve was plotted for assessment of sensitivity and specificity. Error bars indicated standard deviation, and every sample was measured three times individually.
III. RESULTS AND DISCUSSION
A. Microfluidic device design and fabrication
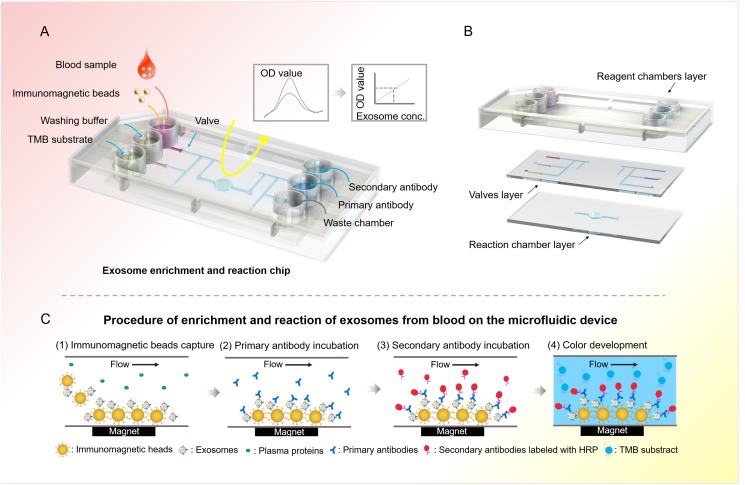
Exosome contains various surface markers originating from their host cell types. It is essential to evaluate the disease-responsive circulating exosomes by selective isolation and specific analysis.36 To this end, the integrated microfluidic device is designed to specifically isolate disease-responsive exosomes and measure a panel of tumor markers. The integrated microfluidic device consisted of six microwells (0.8 cm in diameter) to reserve the reagent, six microvalves for reagent delivery, and a reaction chamber (4 mm in diameter) with a replaceable magnet for fixation and detection of exosomes [Fig. 1(a)]. The microchannel in the device was 300 μm wide and 50 μm deep. As shown in Fig. 1(b), the integrated microfluidic chip was composed of three parts, the reagent chamber layer, the valve control layer, and the reaction chamber layer. The operation was simply driven by programmable micropumps and microvalves with microliter resolution. Briefly, the plasma sample was premixed with immunomagnetic beads in the sample reservoir. Magnetic beads with bound exosomes were then pumped into the reaction chamber and retained as a tight aggregate with the aid of magnetic force. The number of beads retained in the chamber was proportional to the injection volume, allowing for quantitative isolation and detection of exosomes.37 Total analysis was completed with as low as 2 μl plasma samples in 1.5 h. Compared with the traditional ultracentrifugation methods that usually take more than 6 h and have a complex ultracentrifugation process, this microfluidic approach is much faster and can be performed with conventional sample processing steps. Meanwhile, the beads could be released by removing the magnet and collected from the chip to obtain purified exosomes for downstream analysis, such as western blot analysis and electron microscopy imaging. As shown in Fig. 1(c), the enriched exosomes captured in the reaction chamber were incubated with a primary antibody for 20 min, followed by a 20 min incubation with a secondary antibody labeled with horseradish peroxidase (HRP). After each immunoreaction, exosomes were washed twice with a washing buffer, and excess antibody and buffer in each step were removed. Finally, a TMB solution was added and the OD value was measured at 370 nm using a spectrophotometer.
FIG. 1.
Schematic showing the immunomagnetic separation and detection of exosomes from blood using the integrated microfluidic device. (a) Layout of the integrated microfluidic device. The integrated microfluidic device consisted of six microwells to reserve the reagent, six microvalves for reagent delivery, and a reaction chamber with a replaceable magnet for fixation and detection of exosomes. (b) Schematic diagram of the microfluidic chip. (c) The schematic overview of immunomagnetic separation and detection of exosomes from blood on the microfluidic device. Exosomes incubated with immunomagnetic beads were initially adsorbed onto the bottom of the reaction chamber by the magnet, followed by primary antibody and secondary antibody incubation; then, the TMB substrate would be added into the reaction chamber and a color change would be analyzed using the spectrophotometer.
B. Microfluidic operation for isolation and quantification of exosomes
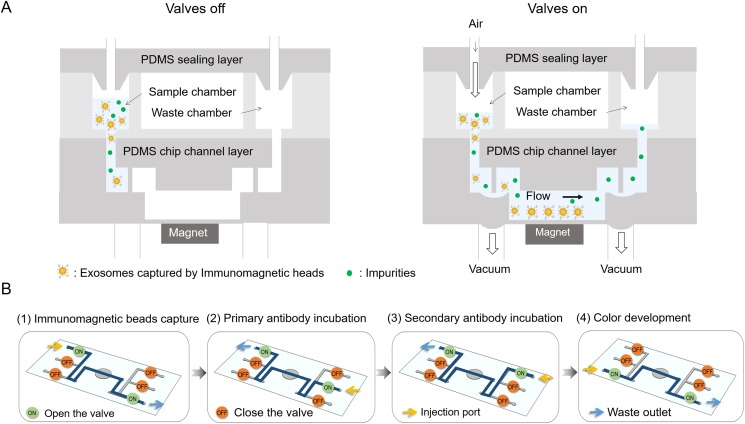
For selective exosome isolation and identification, the exosome samples, immunomagnetic beads, washing buffer (1× PBS), EpCAM antibody, horseradish peroxidase labeled secondary antibody, and TMB substrate were loaded into the microfluidic device in a correct sequence by simply opening the microvalves [Fig. 2(a)]. The exosome samples were premixed with the immunomagnetic beads and then pumped from the sample reservoir to the center reservoir by the valves. The enrichment step immunomagnetically separated the exosomes expressing EpCAM protein from the samples in the center reservoir with the help of a magnet, so that subsequent analyses could be performed on the separated specific exosomes [Fig. 2(b)]. The collected exosomes were then incubated with the primary antibody and the horseradish peroxidase labeled secondary antibody in order. After washing with PBS, the TMB substrate was transferred into the reaction chamber. For the reagents introduced, each step was run for 5 s, stopped for 20 s, and cycled for 5 times, and 20 min incubation time existed after the primary and secondary antibodies were introduced. The color of the reaction chamber would change after incubation for 15 min in darkness, and the degree of color change was positively correlated with the concentration of exosomes. The OD value of the microfluidic device was measured at a wavelength of 370 nm using a spectrophotometer. Compared with the routine immunomagnetic exosomal analysis protocol, the integrated microfluidic device covered all the steps from enriching the exosomes to analyzing them, resulting in much less manual effort and less turnaround time.
FIG. 2.
Illustration of the operation of the microfluidic device. (a) Schematic diagrams of the microfluidic device when valves were in and out. Magnetic beads with bound exosomes were then pumped into the reaction chamber and retained as a tight aggregate with the aid of magnetic force. Gas pressure was used to drive fluid, and vacuum was used to open the valves. (b) The switch state of valves during different processes.
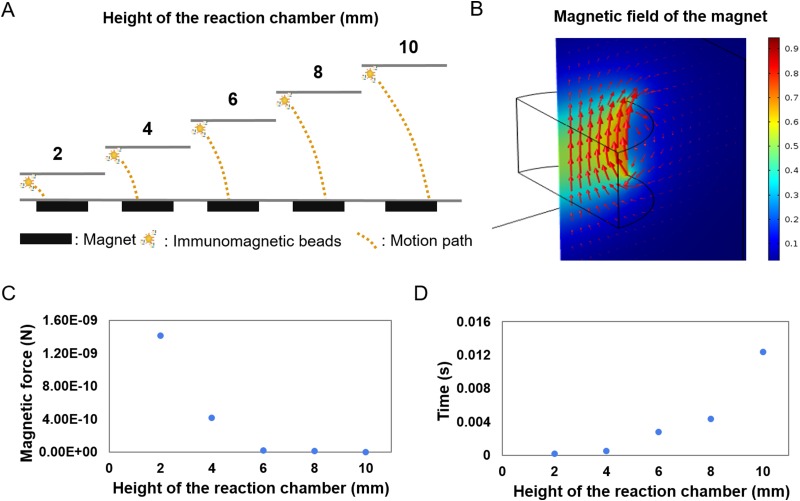
The other essential design factor, crucial to ensure a large final capture efficiency of exosomes, was the optimization of the magnetic flux density gradients produced by permanent magnets placed immediately next to the microfluidic device. The crucial design points that needed to be carefully studied were the detailed positioning of the permanent magnets [Fig. 3(a)]. The magnetic field force of immunomagnetic beads was calculated by COMSOL, and the time for the immunomagnetic beads to be absorbed to the bottom of the reaction chamber from different distances was calculated when the acceleration is by default constant [Fig. 3(b)]. The result showed that the further the distance, the more the time was needed, and it needed less than 0.015 s when the distance between immunomagnetic beads and magnet was 0.01 m [Figs. 3(c) and 3(d)].
FIG. 3.
Characterization and simulation of the magnetic field of the microfluidic device. (a) Diagrammatic sketch of the motion path of the exosomes captured by immunomagnetic beads at different heights of the reaction chamber. (b) Simulation of the magnetic field of the microfluidic device. Color represented magnetic flux density norm, and arrow volume represented magnetic flux density. (c) Relationship of exosomes captured by immunomagnetic beads' distance from the magnet and the magnetic force they received. (d) Relationship of exosomes captured by immunomagnetic beads' distance from the magnet, and the time needed to arrive at its surface when acceleration remained the same.
C. Characterization of isolating tumor-derived exosomes
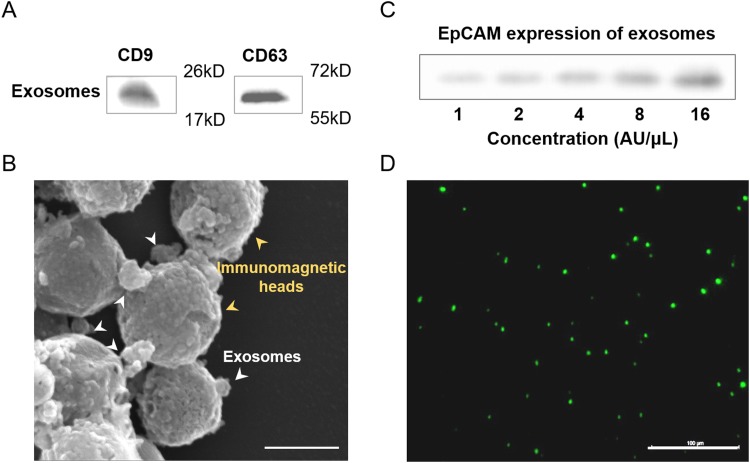
Specificity for isolating and characterizing tumor cells derived from normal cells was essential for blood-based cancer diagnosis.29 The multiple behaviors of exosomes from breast cancer were systematically characterized for efficient exosome isolation. To determine whether the isolated vesicles were indeed exosomes, western blot analysis was commonly used to characterize the exosomal proteins. Figure 4(a) showed the presence of CD63 and CD9 in the exosomes, which were commonly enriched. Transmission electron microscopy (TEM) images of the recovered exosomes from the integrated device exhibited an intact morphology with 100 nm in diameter [Fig. 4(b)].
FIG. 4.
Characterization of immunomagnetic capture in the microfluidic device. (a) Expression of CD9 and CD63 protein of exosomes using western blot analysis. (b) Scanning election micrographs of immunomagnetic beads after immunoaffinity capture. Scale bar: 100 nm. (c) Expression of EpCAM protein of exosomes (undiluted, serially diluted to 1:2, 1:4, 1:8, 1:16) isolated from the cell culture medium using western blot analysis. The initial concentration was defined as 16 AU/μl. (d) Fluorescence image of exosomes after being captured by immunomagnetic beads. The exosomes were signed using EpCAM-FITC before being observed by a fluorescence microscope. Scale bar: 100 μm.
The epithelial cell adhesion molecule EpCAM is a cargo protein, which has been found to be overexpressed in carcinomas and cancer-initiating cells.38 Western blot analysis was used to determine the relationship between the EpCAM protein expression and the concentration of exosomes [Fig. 4(c)]. The result showed that the amount of EpCAM protein had a positive correlation with the concentration of exosomes. The exosomes enriched by the magnetic beads were also analyzed by fluorescence imaging following incubation with EpCAM-FITC antibody [Fig. 4(d)]. The results on the morphology and exosomal marker proteins presented a striking resemblance to those previously reported,29,39 suggesting the specificity of the used exosomes enriched from the integrated device.
D. Characterization of the microfluidic device
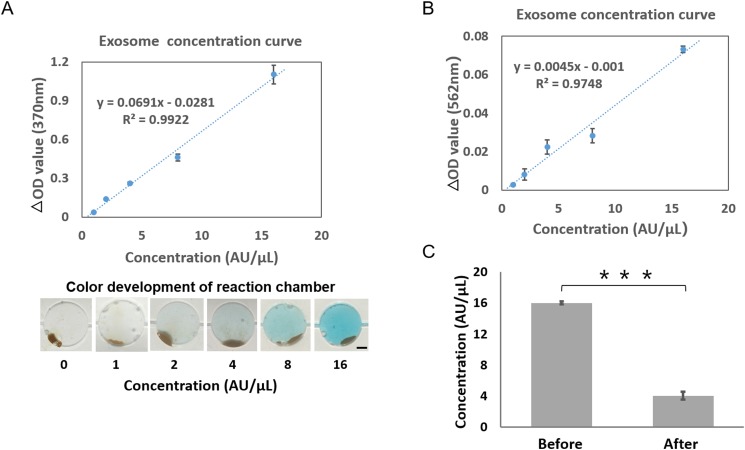
To assess the specificity and accuracy of exosome enrichment and detection on the microfluidic device, the different concentrations of exosomes (1:2 to 1:16 in PBS) enriched from MCF-7 cell culture were quantified. The initial concentration was defined as 16 AU/μl, and 2 μl of exosome solution was used and run on the integrated device under optimal conditions. The result showed that the microfluidics-based device was developed with a linearity of 0.99 (R2) [Fig. 5(d)]. A color development could be observed during detection, which had a positive correlation with the concentration of exosomes. The results also suggested high accessibility of the binding sites of EpCAM on the exosomes, enabling the detection of antibodies to react with exosomes dispersed in the solution.
FIG. 5.
Quantification of the exosomes isolated from the cell culture medium using the microfluidic device. (a) Detection of exosomes (undiluted, serially diluted to 1:2, 1:4, 1:8, 1:16) isolated from the cell culture medium using the microfluidic device. The initial concentration was defined as 16 AU/μl, and 2 μl of exosome solution was used for each detection (R2 = 0.99). Images of the reaction chamber are presented at the bottom for each standard concentration. Scale bar: 1 mm. (b) Detection of exosomes isolated from the cell culture medium using the exosome quantitative kit. The initial concentration was defined as 16 AU/μl, and 2 μL of exosome solution was used for each detection (R2 = 0.95). (c) Comparison of the concentration of initial and handling by the microfluidic device samples. The concentration of the exosomes was quantified using commercial exosome quantitative kits. A two-sided Student t-test was used to analyze the statistical difference between the two groups. *** indicates statistical significance (p < 0.001). Error bars indicate standard deviation, and every sample was measured three times individually.
Additionally, the enrichment efficiency of exosomes on the device was evaluated using commercial exosome quantitative kits. The different concentrations of exosomes (1:2 to 1:16 in PBS) enriched from the MCF-7 cell culture was used to establish the standard curve [Fig. 5(b)]. Then, the total level of exosomes was confirmed before and after the on-chip exosome enrichment [Fig. 5(c)]. The results showed that the concentration of exosomes reduced from 16 ± 0.19 AU/μl to 4.05 ± 0.51 AU/μl after on-chip enrichment. The calculations indicated that the enrichment efficiency of EpCAM-positive exosomes was 74.17% from the device, which was consistent with the literature reports of 74.2%.20 While such enrichment efficiency is comparable with that of the previously reported immunomagnetic exosomal analysis,28–30 our device has the features of flexible control and high integration due to the highly precise fluid control with the aid of microvalves.
E. Integrated exosome analysis for the detection of cancer biomarkers
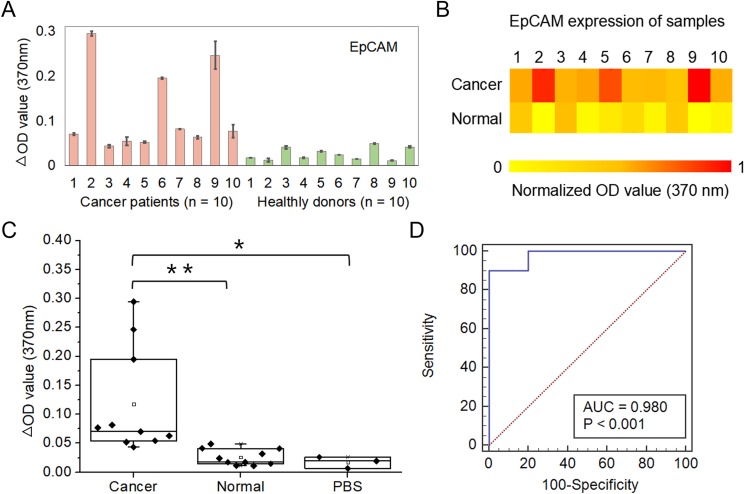
Circulating exosomes, enriched with a group of tumor antigens, provide a unique opportunity for cancer diagnosis. To this end, we employed an integrated device for blood-based diagnosis of breast cancer. A total of 20 human subjects (nbreast cancer = 10, nhealthy = 10) were chosen for evaluating diagnostic accuracy [Figs. 6(a) and 6(b)]. The microfluidic-based assay showed a significantly increased level of exosome EpCAM proteins from breast cancer patients compared with healthy controls [Fig. 6(c), p < 0.01]. To determine the diagnostic accuracy of the integrated microfluidic assay, we analyzed the sensitivity and specificity using receiver operating characteristic (ROC) curves. The receiver operating characteristic curve showed that the sensitivity of the microfluidic device was 90%, and the specificity was more than 95% [Fig. 6(d)]. The results were consistent with recent reports showing that counting exosomes alone was insufficient for cancer diagnosis and targeting specific exosome phenotypes could markedly improve the diagnostic accuracy.40 By ROC analysis, the integrated microfluidic assay was highly accurate in discriminating plasma exosomes from breast cancer patients vs healthy individuals, which was consistent with our previous results and literature reports.39,41,42 The above results suggested that the developed device was reliable and enabled sensitive exosomal marker detection for noninvasive, blood-based diagnosis of cancer with significant predictive power.
FIG. 6.
Clinical validation of blood exosomes for differentiating breast cancer patients from healthy individuals. (a) OD values of exosomes isolated from blood samples collected from breast cancer patients (n = 10) and healthy controls (n = 10) using the microfluidic device. Error bars indicate standard deviation, and every sample was measured three times individually. (b) Heatmap of the EpCAM expression of different samples. The color intensity is based on a single measurement of EpCAM expression of exosomes. (c) Comparison of the OD value of breast cancer patients and healthy controls in a box plot. A two-sided Student t-test was used to analyze the statistical difference between the two groups. * indicates statistical significance (p < 0.05) and ** indicates statistical significance (p < 0.01). (d) The receiver operating characteristic (ROC) curve was plotted for the assessment of sensitivity and specificity. The sensitivity, specificity, and area under the ROC curve (AUROC) were analyzed using MedCalc. The results demonstrated that this integrated device had a sensitivity of 90% and a specificity of >95%.
IV. CONCLUSIONS
We developed a new integrated microfluidic device for immunomagnetic separation and the detection of blood exosomes in situ. The microfluidic device may empower the integration of isolation, staining, and quantification of target exosomes via highly precise fluid control with the aid of microvalves, resulting in much less manual effort and less turnaround time (∼1.5 h). Under optimized conditions, the enriching efficiency for tumor-derived exosomes was greater than 74% due to the high surface to volume ratios of immunomagnetic beads. The purified exosomes being fixed on the beads were beneficial for further downstream analysis, such as immunoassay, western blot analysis, and electron microscopy imaging. In addition, we showed that the integrated microfluidic device could differentiate breast cancer patients from healthy controls with high sensitivity (90%) and specificity (>95%), making this strategy applicable to the analysis of clinical specimens. We believe that the integrated microfluidic device is a promising platform that could contribute to the development of exosome-based disease diagnostics.
ACKNOWLEDGMENTS
This research was supported by the National Key R&D Program of China (Grant No. 2017YFB0405404), the National Natural Science Foundation of China (NNSFC) (Grant Nos. 21607151, 31971373, 31671038, and 81573394), the Strategic Priority Research Program of the Chinese Academy of Sciences (Grant Nos. XDA16020900, XDB29050301, and XDBS01030200), the National Science and Technology Major Project (Grant No. 2018ZX09201017-001-001), and the Innovation Program of Science and Research from the DICP, CAS (Grant Nos. DICP TMSR201601 and DICP I201934).
Note: This paper is part of the special issue on Microfluidics, Circulating Biomarkers and Cancer.
Contributor Information
Wentao Su, Email: .
Jianhua Qin, Email: .
REFERENCES
- 1.Robbins P. D. and Morelli A. E., Nat. Rev. Immunol. 14(3), 195 (2014). 10.1038/nri3622 [DOI] [PMC free article] [PubMed] [Google Scholar]
- 2.Kahlert C. and Kalluri R., J. Mol. Med. 91(4), 431–437 (2013). 10.1007/s00109-013-1020-6 [DOI] [PMC free article] [PubMed] [Google Scholar]
- 3.Yáñez-Mó M., Siljander P. R.-M., Andreu Z., Bedina Zavec A., Borràs F. E., Buzas E. I., Buzas K., Casal E., Cappello F., and Carvalho J., J. Extracell. Vesicles 4(1), 27066 (2015). 10.3402/jev.v4.27066 [DOI] [PMC free article] [PubMed] [Google Scholar]
- 4.Ashcroft B. A., de Sonneville J., Yuana Y., Osanto S., Bertina R., Kuil M. E., and Oosterkamp T. H., Biomed. Microdevices 14(4), 641–649 (2012). 10.1007/s10544-012-9642-y [DOI] [PMC free article] [PubMed] [Google Scholar]
- 5.Dalton A. J., J. Natl. Cancer Inst. 54(5), 1137–1148 (1975). 10.1093/jnci/54.5.1137 [DOI] [PubMed] [Google Scholar]
- 6.Wei M., Yang T., Chen X., Wu Y., Deng X., He W., Yang J., and Wang Z., Oncotarget 8(26), 42262 (2017). 10.18632/oncotarget.15040 [DOI] [PMC free article] [PubMed] [Google Scholar]
- 7.Yasui T., Yanagida T., Ito S., Konakade Y., Takeshita D., Naganawa T., Nagashima K., Shimada T., Kaji N., Nakamura Y., Thiodorus I. A., He Y., Rahong S., Kanai M., Yukawa H., Ochiya T., Kawai T., and Baba Y., Sci. Adv. 3(12), e1701133 (2017). 10.1126/sciadv.1701133 [DOI] [PMC free article] [PubMed] [Google Scholar]
- 8.An T., Qin S., Xu Y., Tang Y., Huang Y., Situ B., Inal J. M., and Zheng L., J. Extracell. Vesicles 4(1), 27522 (2015). 10.3402/jev.v4.27522 [DOI] [PMC free article] [PubMed] [Google Scholar]
- 9.Shao H., Chung J., Balaj L., Charest A., Bigner D. D., Carter B. S., Hochberg F. H., Breakefield X. O., Weissleder R., and Lee H., Nat. Med. 18(12), 1835–1840 (2012). 10.1038/nm.2994 [DOI] [PMC free article] [PubMed] [Google Scholar]
- 10.Shao Y., Shen Y., Chen T., Xu F., Chen X., and Zheng S., Oncotarget 7(37), 60736 (2016). 10.18632/oncotarget.11177 [DOI] [PMC free article] [PubMed] [Google Scholar]
- 11.Momen-Heravi F., Balaj L., Alian S., Mantel P.-Y., Halleck A. E., Trachtenberg A. J., Soria C. E., Oquin S., Bonebreak C. M., Saracoglu E., Skog J., and Kuo W. P., Biol. Chem. 394(10), 1253–1262 (2013). 10.1515/hsz-2013-0141 [DOI] [PMC free article] [PubMed] [Google Scholar]
- 12.Théry C., Amigorena S., Raposo G., and Clayton A., Curr. Protoc. Cell Biol. 30(1), 3–22 (2006). 10.1002/0471143030.cb0322s30 [DOI] [PubMed] [Google Scholar]
- 13.Lamparski H. G., Metha-Damani A., Yao J.-Y., Patel S., Hsu D.-H., Ruegg C., and Le Pecq J.-B., J. Immunol. Methods 270(2), 211–226 (2002). 10.1016/S0022-1759(02)00330-7 [DOI] [PubMed] [Google Scholar]
- 14.Yoshioka Y., Kosaka N., Konishi Y., Ohta H., Okamoto H., Sonoda H., Nonaka R., Yamamoto H., Ishii H., and Mori M., Nat. Commun. 5(1), 3591 (2014). 10.1038/ncomms4591 [DOI] [PMC free article] [PubMed] [Google Scholar]
- 15.Zhang P., He M., and Zeng Y., Lab Chip 16(16), 3033–3042 (2016). 10.1039/C6LC00279J [DOI] [PMC free article] [PubMed] [Google Scholar]
- 16.Taylor D. D., Zacharias W., and Gercel-Taylor C., Serum/Plasma Proteomics (Springer, 2011), pp. 235–246. [DOI] [PubMed] [Google Scholar]
- 17.Chen C., Skog J., Hsu C.-H., Lessard R. T., Balaj L., Wurdinger T., Carter B. S., Breakefield X. O., Toner M., and Irimia D., Lab Chip 10(4), 505–511 (2010). 10.1039/B916199F [DOI] [PMC free article] [PubMed] [Google Scholar]
- 18.Nahavandi S., Baratchi S., Soffe R., Tang S.-Y., Nahavandi S., Mitchell A., and Khoshmanesh K., Lab Chip 14(9), 1496–1514 (2014). 10.1039/C3LC51124C [DOI] [PubMed] [Google Scholar]
- 19.Davies R. T., Kim J., Jang S. C., Choi E.-J., Gho Y. S., and Park J., Lab Chip 12(24), 5202–5210 (2012). 10.1039/c2lc41006k [DOI] [PubMed] [Google Scholar]
- 20.Liang L.-G., Kong M.-Q., Zhou S., Sheng Y.-F., Wang P., Yu T., Inci F., Kuo W. P., Li L.-J., Demirci U., and Wang S., Sci. Rep. 7(1), 46224 (2017). 10.1038/srep46224 [DOI] [PMC free article] [PubMed] [Google Scholar]
- 21.Woo H.-K., Sunkara V., Park J., Kim T.-H., Han J.-R., Kim C.-J., Choi H.-I., Kim Y.-K., and Cho Y.-K., ACS Nano 11(2), 1360–1370 (2017). 10.1021/acsnano.6b06131 [DOI] [PubMed] [Google Scholar]
- 22.Wunsch B. H., Smith J. T., Gifford S. M., Wang C., Brink M., Bruce R. L., Austin R. H., Stolovitzky G., and Astier Y., Nat. Nanotechnol. 11(11), 936–940 (2016). 10.1038/nnano.2016.134 [DOI] [PubMed] [Google Scholar]
- 23.Smith J. T., Wunsch B. H., Dogra N., Ahsen M. E., Lee K., Yadav K. K., Weil R., Pereira M. A., Patel J. V., Duch E. A., Papalia J. M., Lofaro M. F., Gupta M., Tewari A. K., Cordon-Cardo C., Stolovitzky G., and Gifford S. M., Lab Chip 18(24), 3913–3925 (2018). 10.1039/C8LC01017J [DOI] [PubMed] [Google Scholar]
- 24.Yeo J. C., Kenry, Z. Zhao, P. Zhang, Z. Wang, and C. T. Lim, Biomicrofluidics 12(2), 024103 (2018). 10.1063/1.5019983 [DOI] [PMC free article] [PubMed] [Google Scholar]
- 25.Cho S., Jo W., Heo Y., Kang J. Y., Kwak R., and Park J., Sens. Actuators. B Chem. 233, 289–297 (2016). 10.1016/j.snb.2016.04.091 [DOI] [Google Scholar]
- 26.Heineck D. P., Lewis J. M., and Heller M. J., Electrophoresis 38(11), 1475–1482 (2017). 10.1002/elps.201600563 [DOI] [PubMed] [Google Scholar]
- 27.Marczak S., Richards K., Ramshani Z., Smith E., Senapati S., Hill R., Go D. B., and Chang H. C., Electrophoresis 39(15), 2029–2038 (2018). 10.1002/elps.201700491 [DOI] [PMC free article] [PubMed] [Google Scholar]
- 28.Tang M., Wen C. Y., Wu L. L., Hong S. L., Hu J., Xu C. M., Pang D. W., and Zhang Z. L., Lab. Chip 16(7), 1214–1223 (2016). 10.1039/C5LC01555C [DOI] [PubMed] [Google Scholar]
- 29.Zhao Z., Yang Y., Zeng Y., and He M., Lab Chip 16(3), 489–496 (2016). 10.1039/C5LC01117E [DOI] [PMC free article] [PubMed] [Google Scholar]
- 30.Kanwar S. S., Dunlay C. J., Simeone D. M., and Nagrath S., Lab Chip 14(11), 1891–1900 (2014). 10.1039/C4LC00136B [DOI] [PMC free article] [PubMed] [Google Scholar]
- 31.Jiang Y., Shi M., Liu Y., Wan S., Cui C., Zhang L., and Tan W., Angew. Chem. Int. Ed. 56(39), 11916–11920 (2017). 10.1002/anie.201703807 [DOI] [PMC free article] [PubMed] [Google Scholar]
- 32.Jin D., Yang F., Zhang Y., Liu L., Zhou Y., Wang F., and Zhang G.-J., Anal. Chem. 90(24), 14402–14411 (2018). 10.1021/acs.analchem.8b03959 [DOI] [PubMed] [Google Scholar]
- 33.Théry C., Zitvogel L., and Amigorena S., Nat. Rev. Immunol. 2(8), 569 (2002). 10.1038/nri855 [DOI] [PubMed] [Google Scholar]
- 34.Xiang X., Poliakov A., Liu C., Liu Y., Deng Z.-B., Wang J., Cheng Z., Shah S. V., Wang G.-J., Zhang L., Grizzle W. E., Mobley J., and Zhang H.-G., Int. J. Cancer 124(11), 2621–2633 (2009). 10.1002/ijc.24249 [DOI] [PMC free article] [PubMed] [Google Scholar]
- 35.Gyoergy B., Szabo T. G., Pasztoi M., Pal Z., Misjak P., Aradi B., Laszlo V., Pallinger E., Pap E., Kittel A., Nagy G., Falus A., and Buzas E. I., Cell. Mol. Life Sci. 68(16), 2667–2688 (2011). 10.1007/s00018-011-0689-3 [DOI] [PMC free article] [PubMed] [Google Scholar]
- 36.Kalra H., Adda C. G., Liem M., Ang C.-S., Mechler A., Simpson R. J., Hulett M. D., and Mathivanan S., Proteomics 13(22), 3354–3364 (2013). 10.1002/pmic.201300282 [DOI] [PubMed] [Google Scholar]
- 37.He M., Crow J., Roth M., Zeng Y., and Godwin A. K., Lab Chip 14(19), 3773–3780 (2014). 10.1039/C4LC00662C [DOI] [PMC free article] [PubMed] [Google Scholar]
- 38.Maetzel D., Denzel S., Mack B., Canis M., Went P., Benk M., Kieu C., Papior P., Baeuerle P. A., Munz M., and Gires O., Nat. Cell Biol. 11(2), 162–171 (2009). 10.1038/ncb1824 [DOI] [PubMed] [Google Scholar]
- 39.Fang S., Tian H., Li X., Jin D., Li X., Kong J., Yang C., Yang X., Lu Y., Luo Y., Lin B., Niu W., and Liu T., PLoS One 12(4), e0175050 (2017). 10.1371/journal.pone.0175050 [DOI] [PMC free article] [PubMed] [Google Scholar]
- 40.Melo S. A., Luecke L. B., Kahlert C., Fernandez A. F., Gammon S. T., Kaye J., LeBleu V. S., Mittendorf E. A., Weitz J., Rahbari N., Reissfelder C., Pilarsky C., Fraga M. F., Piwnica-Worms D., and Kalluri R., Nature 523(7559), 177–182 (2015). 10.1038/nature14581 [DOI] [PMC free article] [PubMed] [Google Scholar]
- 41.Rabinowits G., Gercel-Taylor C., Day J. M., Taylor D. D., and Kloecker G. H., Clin. Lung Cancer 10(1), 42–46 (2009). 10.3816/CLC.2009.n.006 [DOI] [PubMed] [Google Scholar]
- 42.Silva J., Garcia V., Rodriguez M., Compte M., Cisneros E., Veguillas P., Garcia J. M., Dominguez G., Campos-Martin Y., Cuevas J., Pena C., Herrera M., Diaz R., Mohammed N., and Bonilla F., Gene Chromosome Cancer 51(4), 409–418 (2012). 10.1002/gcc.21926 [DOI] [PubMed] [Google Scholar]


