

Abstract
Background:
DBA/2J kidney allografts, but not heart allografts, are spontaneously accepted indefinitely in C57BL/6 (B6) mice, through regulatory tolerance mechanism dependent on Foxp3+ cells. In contrast, B6 kidneys are rejected within a week in DBA/2J recipients. We hypothesized that the tolerogenic difference of the kidneys might be due to differences in number or function of plasmacytoid dendritic cells (pDCs), since these cells are potent inducers of Foxp3+ cells.
Methods:
pDCs from murine bone marrow, native kidneys, and spontaneously accepted kidney allografts were analyzed using flow cytometry and immunohistochemical staining. Naïve T cells were co-cultured with pDCs in specific strain combinations and analyzed for FoxP3 induction and functionality. MEK/ERK and NFκB inhibitors were used to assess the Treg induction pathways. pDCs and T cell cultures were adoptively transferred prior to heterotopic heart transplantation to assess allograft survival.
Results:
DBA/2J pDCs were more potent in inducing Foxp3+ in B6 T cells than the reverse combination, correlating with survival of the kidney allografts. Foxp3 induction by pDCs in vitro was dependent on pDC viability, immaturity, and class II MHC mismatch, and blocked by MEK/ERK and NFκB inhibition. pDC-induced Foxp3+ T cells suppressed proliferation of B6 T cells in vitro, and adoptive transfer into B6 recipients two weeks prior to heterotopic DBA/2J heart transplantation resulted in prolonged allograft survival.
Conclusions:
These data suggest that pDC-induced Tregs are dependent on down-stream signaling effects and strain-dependent, MHC class II disparity with naïve T cells, which may explain organ and strain specific differences in spontaneous tolerance.
Introduction
Mouse kidney allografts are spontaneously accepted in select donor-recipient strain combinations without any treatment.1 We have shown that DBA/2 to B6 spontaneously accepted kidney allografts developed localized aggregates of lymphocytes around the small arteries of the graft.2 These structures are shown to be consistently present in accepted kidney allografts, and absent in rejected allografts.2 These structures contain prominent Foxp3+ regulatory T cells (Tregs), and have hence been named Treg-rich organized lymphoid structures (TOLS). Depletion of Tregs from recipients results in dissolution of TOLS, and acute rejection of the graft.2
We hypothesize that dendritic cells, specifically plasmacytoid dendritic cells (pDCs), are involved in spontaneous acceptance of murine kidney allografts because of their known role in allo- and self-tolerance.3–5 In the periphery, pDCs have been shown to drive production of naturally-occurring Tregs, which are distinct from conventional dendritic cell (cDC)-induced Tregs by their greater production of IL-10.6 Hadeiba and colleagues have shown that CCR9+ pDCs induce Foxp3+ Tregs and prevent GVHD.7 In addition, pDCs express Siglec-H on their cell surface and it has been shown that this endocytic receptor is capable of internalizing various proteins from the environment8 and inhibit Th cell and Ab responses in an antigen specific manner.9
In this manuscript, we show that pDCs isolated from an accepted kidney allografts not only express higher levels of Siglec-H when compared to pDCs from native kidneys, but are able to induce greater Foxp3 expression in vitro when compared to resident pDCs isolated from a native, untransplanted kidney. We further show that Foxp3 induction by pDCs in vitro correlated with strain combinations that led to kidney allograft survival. Foxp3 induction is dependent on pDC viability, immaturity, cell-cell contact, and class II but not class I differences at the H2-I-Ab locus, and abrogated by MEK/ERK and NFκB inhibition. Our findings suggest an explanation for the strain specific spontaneous acceptance of kidney allografts observed in mice.
Materials and Methods
Mice
The C57BL/6 (B6, H2b), DBA/2J (DBA/2, H2d), C3H/HeJ (C3H, H2k), B6.Foxp3-GFP, and B6.C-H2d/bByJ strains were purchased from Jackson Laboratories (Bar Harbor, ME). All mice were maintained under pathogen-free conditions in filter-top cages with an automatic water system and were cared for according to methods approved by the American Association for the Accreditation of Laboratory Animal Care.
Histological and Immunopathological Features
Sagittal sections of allografts were fixed in formalin, and sections were stained for hemotoxylin and eosin; Periodic acid-Schiff sections were scored according to Banff criteria. All arteries present in two full sagittal sections of the kidney were scored for endarteritis (mean 16.5 ± 4.4; range, 11 to 25). Sections were stained for Foxp3 (JK-16S; eBiosciences, San Diego, CA) and PDCA-1 (BST2, Novus Biologicals). Light microscopic imaging was performed with a microscope (Eclipse 50i; Nikon, Tokyo, Japan) equipped with a digital camera (Spot RT KE; Diagnostics Instruments, Sterling Heights, MI). All figures from immunohistochemistry staining are representative of the tissue as a whole.
Isolation of CD4+CD25+ and CD4+CD25− T cells
CD4+CD25− and CD4+CD25+ T cells were isolated from splenocytes by magnetic cell sorting system utilizing the Mouse CD4+CD25+ Regulatory T cells Isolation Kit protocol (Miltenyi Biotec, Auburn CA). Cells were resuspended in complete media (RPMI with 1% L--glutamine, 10% FBS, 1% sodium pyruvate, 1% penicillin/streptinomycin, 1% non-essential amino acids, and 0.65% beta-mercaptoethanol).
Isolation of Plasmacytoid Dendritic cells
Plasmacytoid dendritic cells (pDCs) were harvested from femur and tibia bone marrow (BM) of DBA/2, B6 and C3H mice. pDCs were isolated using the Plasmacytoid Dendritic Cell Isolation Kit II by elimination of non-pDCs (negative selection) (Miltenyi Biotec, Auburn, CA). pDCs were also isolated from the kidneys of DBA/2 to B6 allogeneic allografts, B6 to B6 syngeneic allografts, and naïve DBA/2 kidneys. Kidneys were procured, manually pulverized, resuspended in sterile RPMI and collagenase, and allowed to digest in a 42° C bath for 30 minutes. Cold RPMI was added afterwards to stop the reaction. The solution was centrifuged and filtered to eliminate large debris. The pDCs were isolated from the resulting solution using the Plasmacytoid Dendritic Cell Isolation Kit II as used above.
In vitro culture of CD4+CD25− T cells and pDC
1.5 × 10⁵ CD4+ CD25− T cells and 5.0 × 10⁴ BM pDCs (3:1) were cultured in 96 well U-bottom polystyrene plates (Sigma-Aldrich Co., St Louis, MO) in the presence of recombinant interleukin-2 (IL-2) (final: 10 ng/1ml) (R&D systems, Minneapolis, MN) and platelet-derived tissue growth factor-β (TGF) (final: 10 ng/1ml) (R&D systems, Minneapolis, MN) at 37°C for 4 days. T cell/pDC ratio and time points are considered optimal for induction (unpublished data). To analyze for proliferative changes during culture, T cells were stained with Cell Proliferation Dye eFluor® 670 (eBiosciences, San Diego, CA) before culture at a 5 nM concentration. After 4 days in culture, cells were analyzed for FACS or for in vivo studies by adoptive transfer. All groups in in vitro experiments were done in triplicate. Cell cultures for adoptive transfer were upscaled by a factor of 2 i.e (3.0 × 10⁵ CD4+ CD25− T cells and 1.0 ×10⁵ BM pDCs) in the presence of doubled amount of IL-2 and TGF- β for 4 days incubation.
Flow cytometry
Cells were collected at scheduled time points and stained with PerCP-Cy5.5-conjugated anti-CD3 (145-2C11; eBiosciences, San Diego, CA). Intracellular staining was performed utilizing the Foxp3 staining buffer set (eBioscience, San Diego, CA) and stained with APC-conjugated anti-Foxp3 (FJK-16s; eBiosciences, San Diego, CA). The purity of pDCs was confirmed by staining: Ab of PerCP-eFluor 710 CCR9 (eBioCW-1.2; eBiosciences, San Diego, CA), Ab of FITC-conjugated B220 (RM4-5; BioLegend, San Diego, CA), Ab of PE-conjugated CD317 (PDCA-1, BST2) (eBio129c eBiosciences, San Diego, CA). For negative controls, unstained cells or cells stained with each isotype-controlled mAb were utilized. All samples were analyzed on Accuri C6 FTM (BD Biosciences) or FACSverse (BD Biosciences) with FlowJo software (Tree Star). Figures from flow cytometry are representative of the triplicate samples.
Mixed lymphocyte reaction
CD4+CD45+ T cells were isolated from C57BL/6 mouse spleens as described above. Cells were then labeled with the Vybrant® CFDA-SE Cell Tracer Kit at 1 μM concentration (Life Technologies, Gaithersburg, MD). Labeled cells of 1.5 × 10⁵ were plated in 96 well plates, cultured for 96 hours and analyzed for CFSE fluorescence by FACS. For proliferation assays, cells were stimulated with anti-CD3/anti-CD28 Dynabeads® (Life Technologies, Gaithersburg, MD) plated in a 1:1 ratio to labeled cells. To test whether T-cells were sensitized to allogeneic antigens, allogeneic splenocytes irradiated at 2000 rads were added instead of beads at 5.0 × 10⁵ cells/well. Labeled cells in culture media without any form of allogeneic stimulus (medium added) were utilized as a negative control. To analyze for suppressive capacity, iTregs cultured as described above were added to MLRs at the time of labeled cell plating. Briefly, cell cultures containing iTregs, CD4+CD25− T cells, and allogeneic pDCs were washed twice with complete media (to remove cytokines from culture). They were resuspended in complete media and transferred to wells containing CFDA labelled splenic B6 CD4+CD25− T cells. Suppressive capacity was determined as diminished proliferative response to anti-CD3/anti-CD28 stimulus or allogeneic irradiated splenocyte stimulus. 1 μM of active/inactive kinase inhibitors were added at the start of the in vitro induction assay. MEK inhibitors, U0126 (active) and U0124 (inactive), GSK-3β inhibitors BIO (active) and MeBIO (inactive), and the NFκB inhibitor, IT901, were purchased from Techne Corporation, Minneapolis, MN.
Transwell Assay
5.0 × 10⁴ BM pDCs were plated on a 6.5mm transwell insert. Membrane pore size was sufficiently small to impede pDC migration. 1.5 × 10⁵ CD4+ CD25− T cells were plated in the bottom of each well of a 24-well plate and filled with 1mL of growth media with recombinant interleukin-2 (IL-2) (final: 10 ng/1ml) (R&D systems, Minneapolis, MN) and platelet derived tissue growth factor-β (TGF) (final: 10 ng/1ml) (R&D systems, Minneapolis, MN). The transwell inserts were placed and the assay was incubated at 37°C for 4 days. After incubation, flow cytometry analysis was performed as detailed above.
Adoptive Cell Transfer
Cell cultures from two groups (DBA pDCS + B6 CD4+CD25− T-cells, DBA pDCS + B6 CD4+CD25− T-cells + IL-2/TGF-β) were centrifuged to remove cytokines and dead cells as described above. They were resuspended in RPMI and then injected intravenously into the recipient through the tail vein or the penile vein. Mice were anesthetized before injection by Tribromoethanol. Injections occurred at 2 weeks, 1 week, or both 2 weeks and 1 week before heterotopic heart transplant.
Study approval and ethics statement
All surgical procedures and pre/post-operative care of animals were performed in accordance with methods approved by the American Association for the Accreditation of Laboratory Animals and approved by the Massachusetts General Hospital Institutional Animal Care and Use Committee.
Heterotopic heart transplantation
DBA/2 to B6 heterotopic murine heart transplantation was performed according to our previously described microsurgical technique.10 In brief, the aorta and pulmonary artery of DBA/2J heart grafts were anastomosed to the B6 recipient infra-renal aorta and inferior vena cava, respectively, in an end-to-side fashion. Cold ischemic times of less than 25 min were maintained throughout. The survival of grafts was monitored daily by abdominal palpation (scoring 1-3) until the cessation of cardiac contraction.
Kidney transplantation
Kidney transplantation was performed in the same way described in a previous report.2 In brief, kidney allografts were prepared with the cuff of aorta and inferior vena cava. Anastomoses were performed in an end-to-side manner. The ureter was anastomosed to the urinary bladder. Bilateral nephrectomy was also simultaneously performed.
Statistical analysis
Results are given as the mean ± 95% C.I.. Variables among groups were compared using Student’s t test, with P < 0.05 considered significant. Allograft survival curves were constructed by the Kaplan and Meier method and comparisons were performed using the log-rank test. These analyses were performed with Prism ver.5 (GraphPad Software Inc., CA).
Results
pDC Population and Phenotype in Normal Kidneys and Hearts.
Flow cytometry of CD11c+ cells isolated from native DBA/2 kidneys contain CD11c+PDCA+B220+ cell populations which are not detectable in hearts from the same strain (Figure 1A). Similar organ differences are seen in the BALB/c strain, whose kidneys are also spontaneously accepted in B6 mice, but not hearts, long term. Normal kidney pDCs have consistently low expression of the tolerogenic marker Siglec-H9, whereas bone marrow (BM) pDCs are Siglec-Hhi (Figure 1B).
Figure 1. pDC populations and phenotypes in normal murine kidney and hearts.
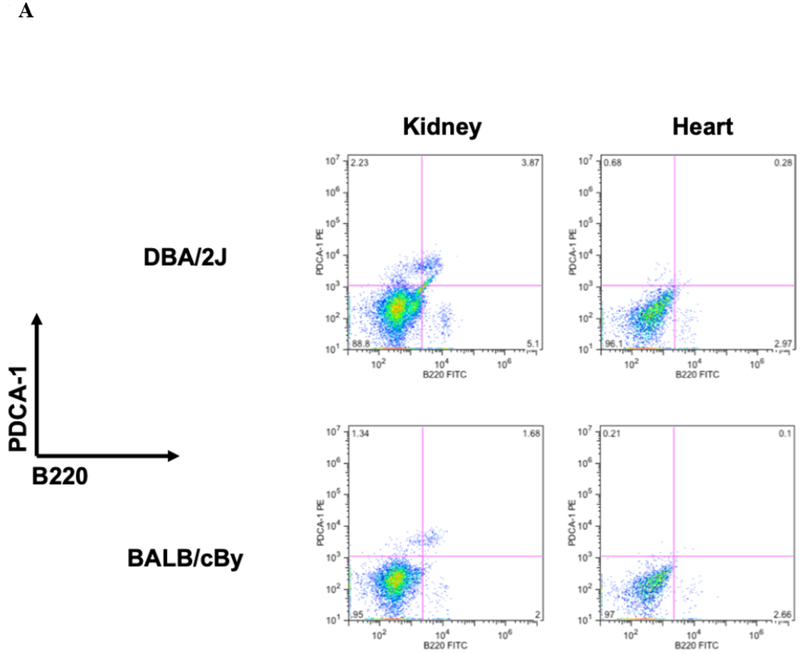
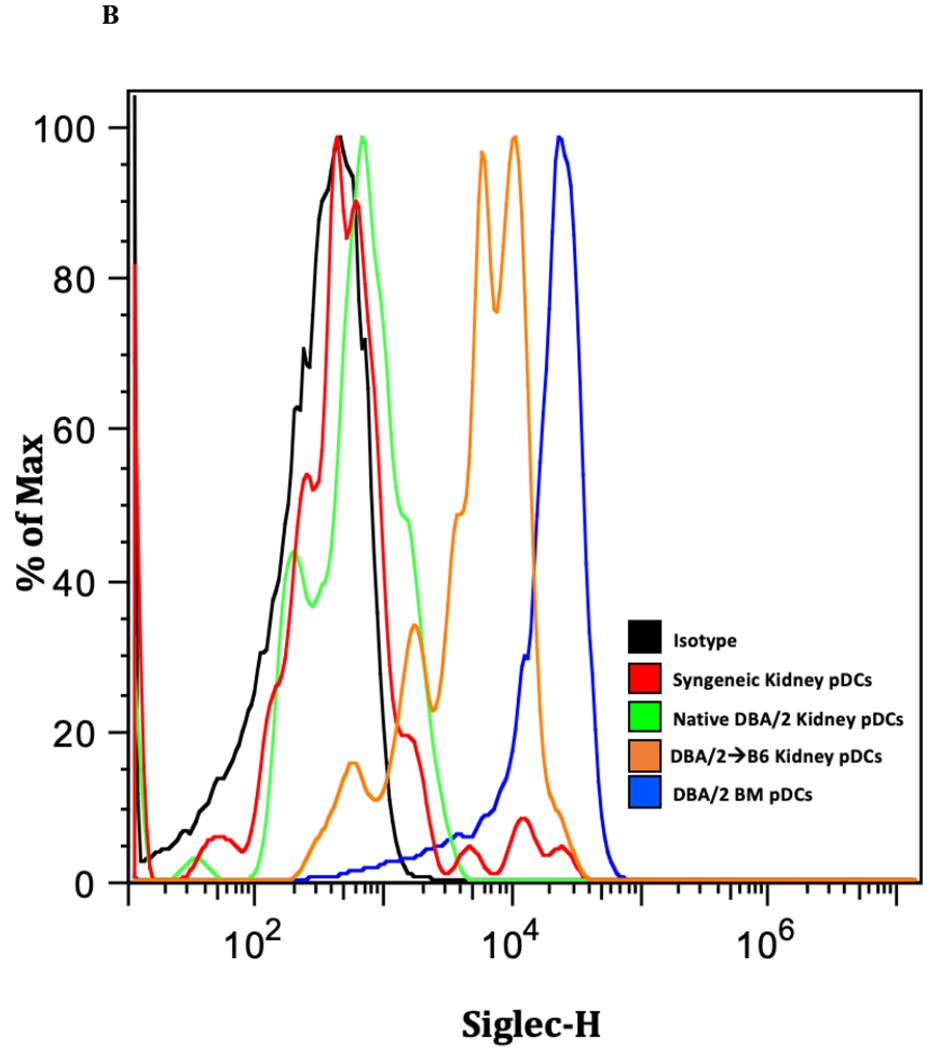
A) CD11c+ cells were isolated from naïve kidneys and heart from DBA/2J and BALB/cBy mice and co-stained for PDCA −1 and B220 and analyzed by flow cytometry. We observe the presence of pDCs in the kidney but fail to detect a resident population in the heart.B) Siglec-H expression is increased in allogeneic transplanted, murine kidney pDCs. Siglec-H levels were measured in various kidney samples using flow cytometry. Bone marrow pDCs (blue) express Siglec-H, as described in the literature. Interestingly, Siglec-H in native kidneys and syngeneic transplants have low expression of Siglec-H, whereas accepted allogeneic kidney pDCs demonstrate Siglec-H+ phenotype.
pDC Phenotype in Kidney Allografts.
Immunohistochemical analysis of DBA/2 to B6 spontaneously accepted kidney allografts at six weeks post-transplantation reveals aggregates of lymphocytes around arteries that are rich in CD3+/Foxp3 positive cells (TOLS) (Figure 2A) and PDCA-1+ cells, a specific marker for pDCs in mice (Figure 2B). In contrast, B6 to DBA/2 transplanted kidneys, which are rejected with a survival time of 8 days (Figure 2C), had diffuse infiltration of leukocytes and lymphocytes (Figure 2D) and significantly decreased pDCs and no TOLS formation (Figure 2E). In accepted kidney allografts, pDCs are Siglec-Hhi (Figure 1B), and enriched in TOLS as early as one week after transplantation (Figure 2F). Co-staining with Siglec-H and Foxp3 demonstrate frequent “capping” of Siglec-H between pDC and Foxp3+ cells, suggesting a cellular interaction between pDCs positive for the tolerogenic Siglec-H molecule and Foxp3+ Tregs (Figure 2G). Phosphorylated ERK is present within TOLS of spontaneously accepted kidneys, suggesting the activation of MEK/ERK signaling pathways in Foxp3+ cells (Figure 2H).
Figure 2. pDC phenotype in kidney allografts.
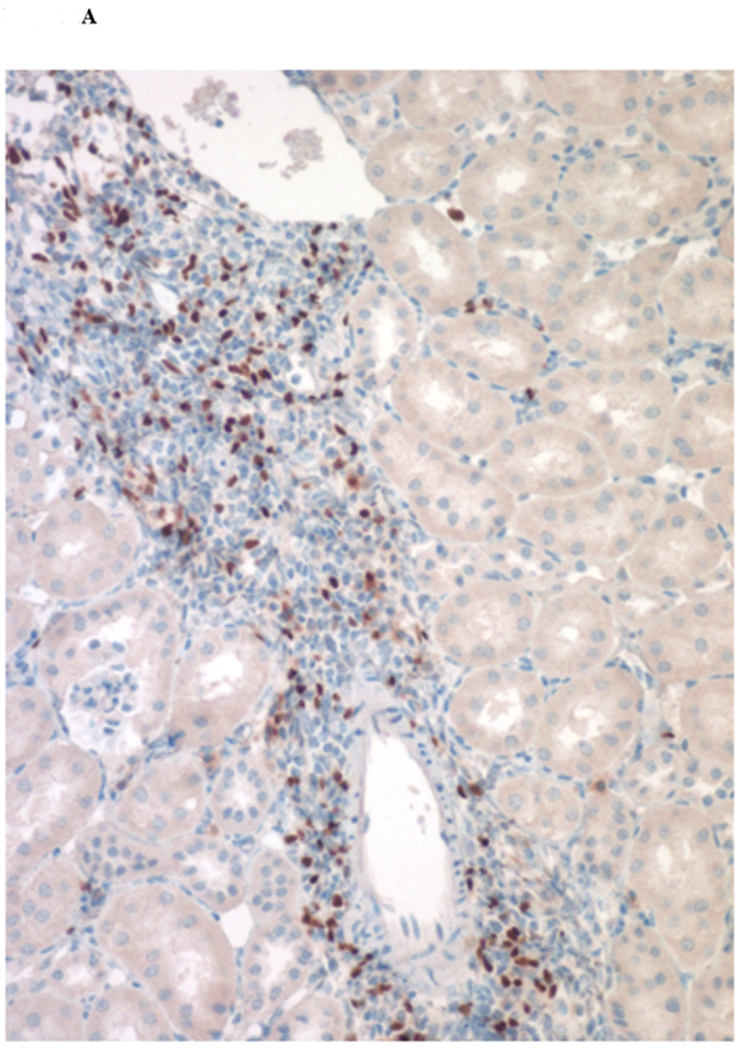
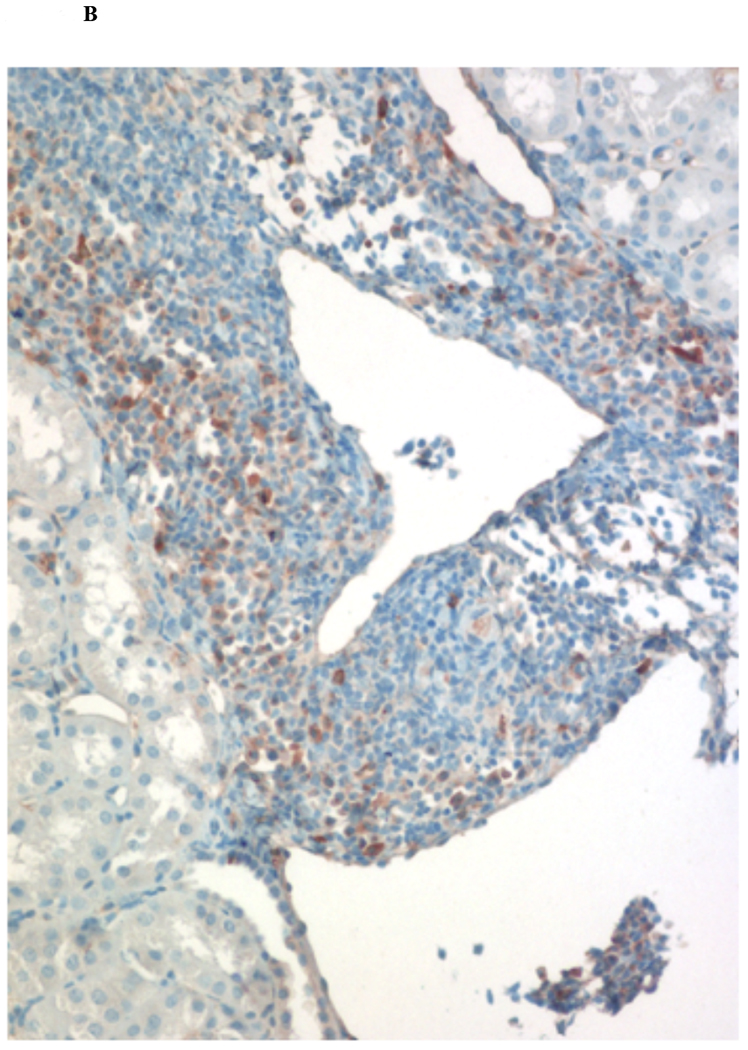
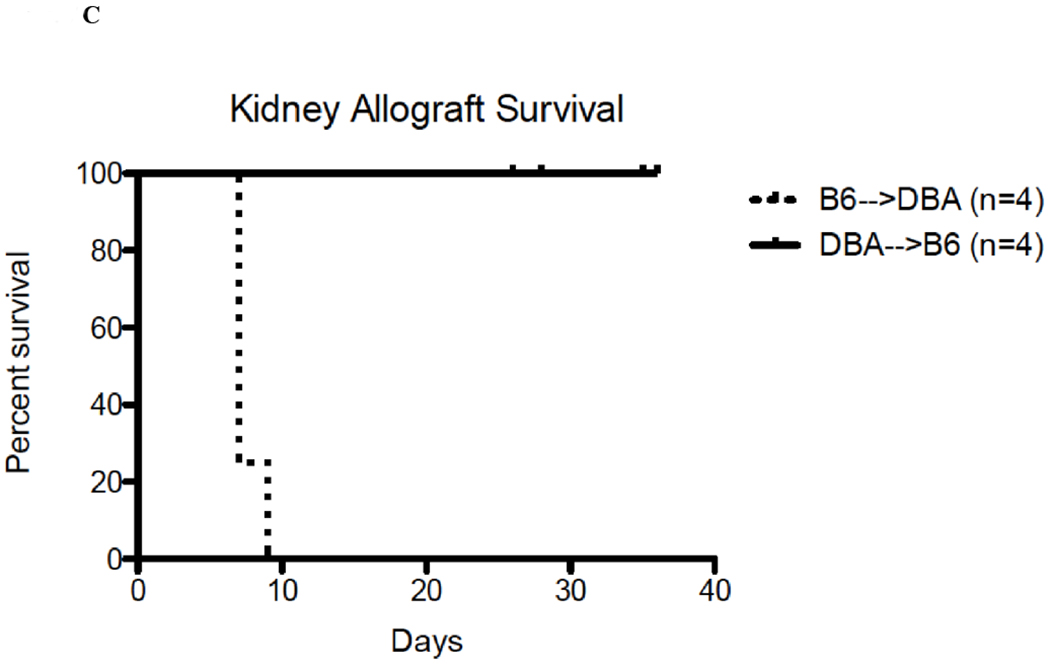
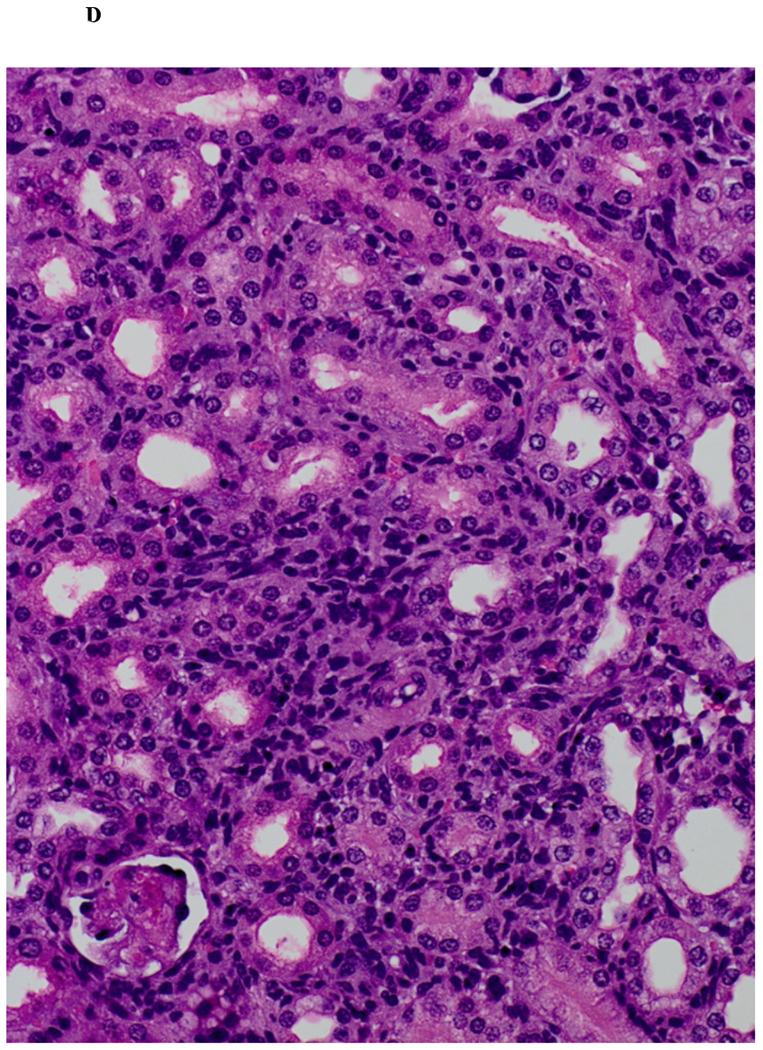
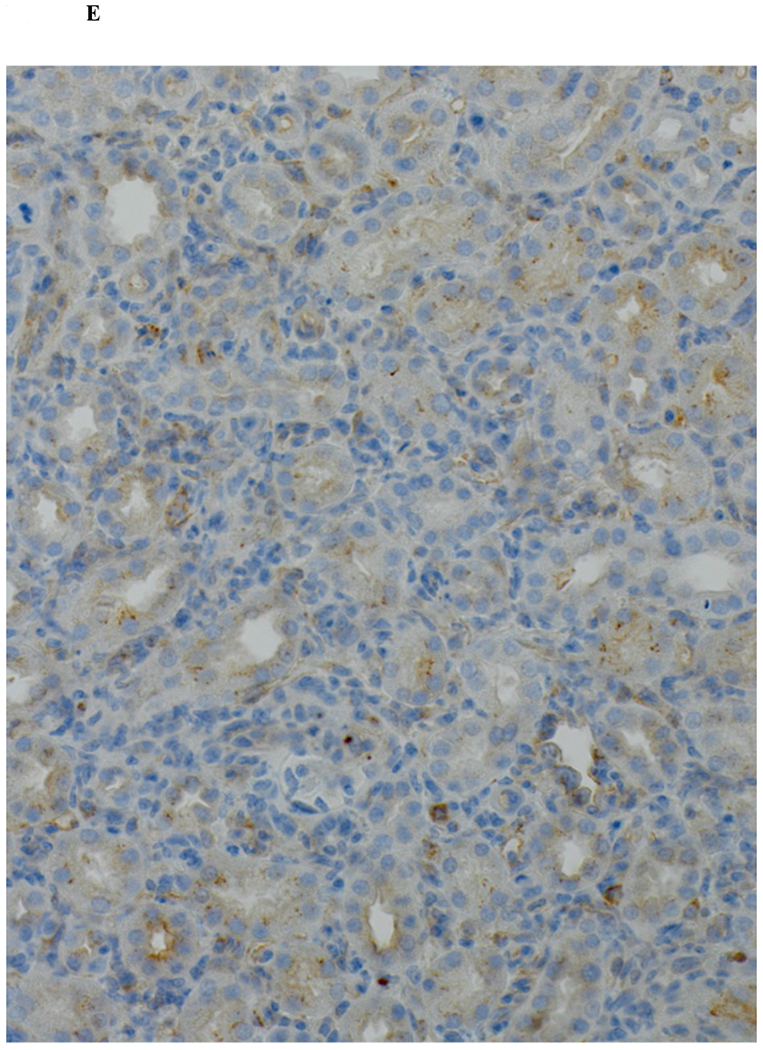
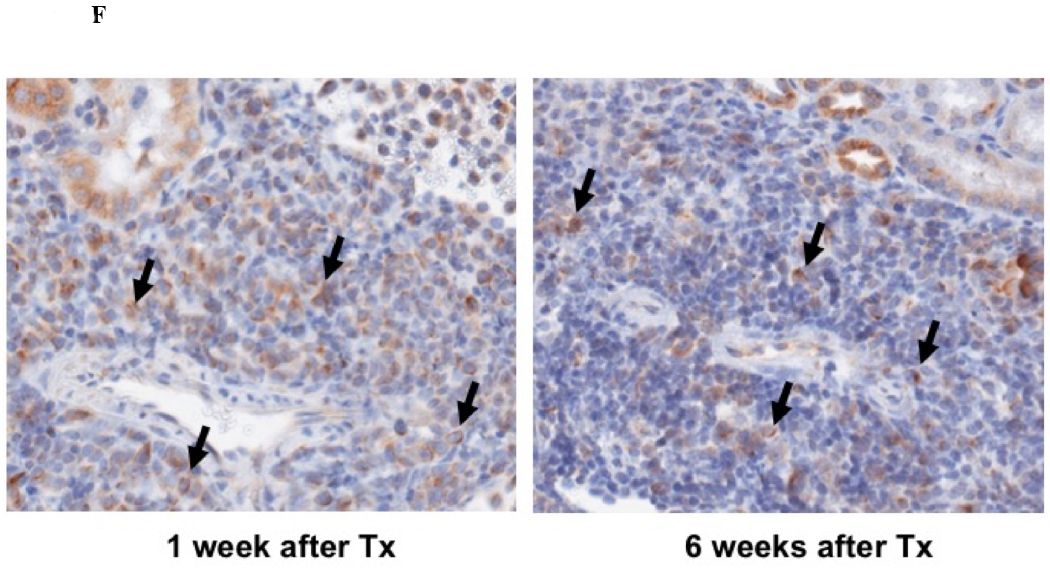
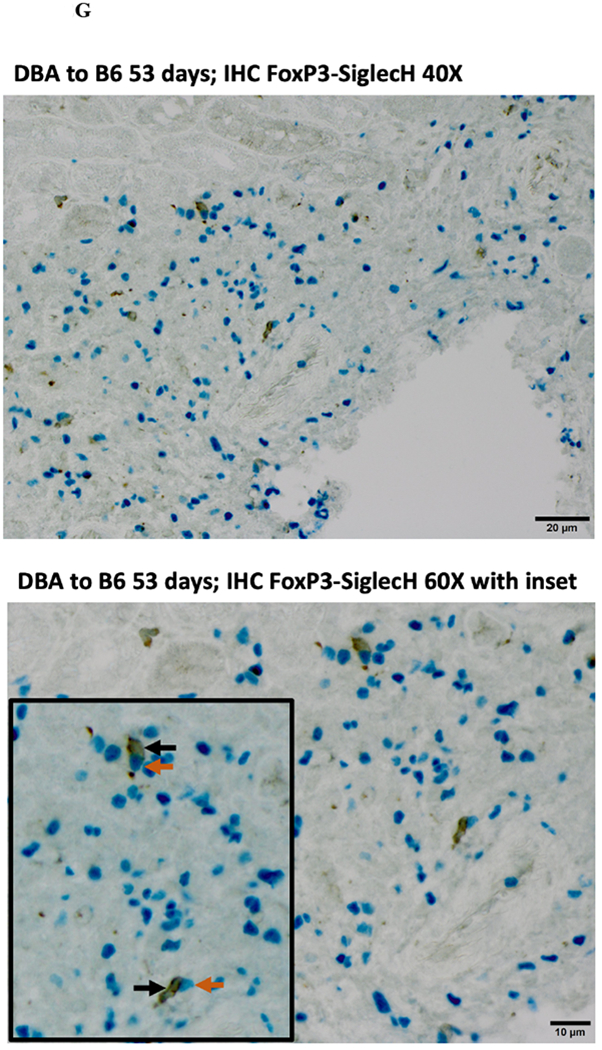
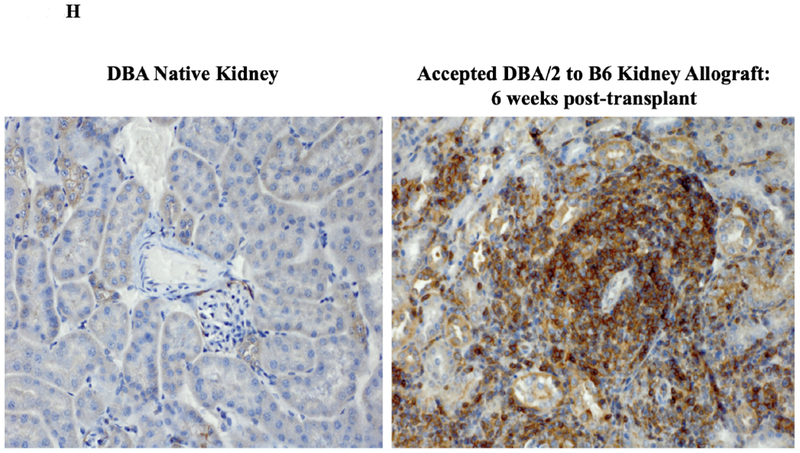
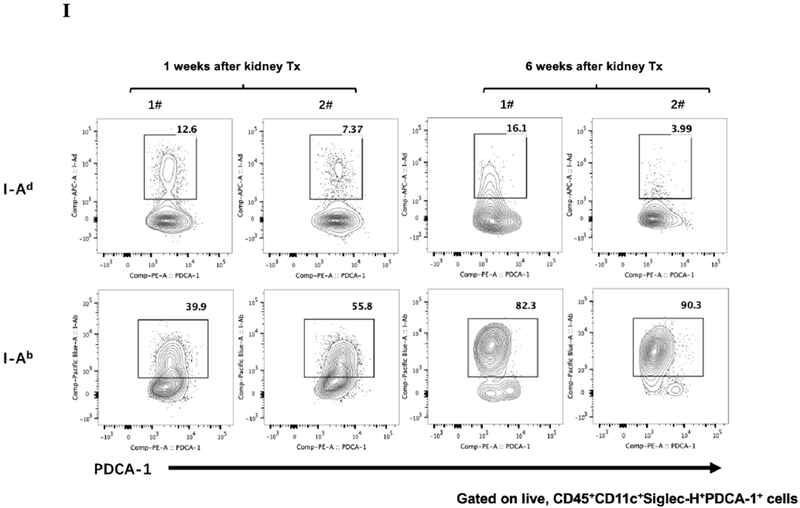
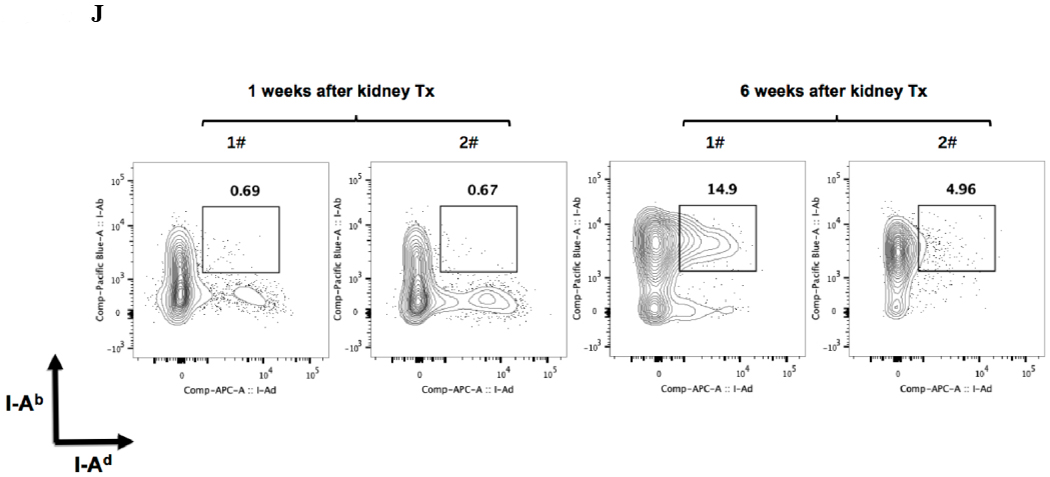
A) Representative Foxp3 stain view of Treg Organized Lymphocyte Structures (TOLS) located around arterioles within spontaneously accepted DBA/2J to B6 kidney allografts (200x). B) PDCA-1 stain of a separate arteriole within the same allograft showing pDCs within the TOLS (200x). C) Kidney allografts are spontaneously accepted in a DBA/2J to B6 strain combination while rejected in a B6 to DBA/2J strain combination. D) Representative hematoxylin and eosin stain view of rejected B6 to DBA/2J kidney allografts on post-transplant day 9. Rejected allografts demonstrate an increase in polymorphonuclear leukocytes and lymphocytes consistent with acute rejection (400x). E) PDCA-1 stain view of the same allograft demonstrating significantly decreased pDCs, observed in all rejecting allografts (400x). F) Siglec-H (arrows) staining within TOLS of accepted DBA/2 kidney allografts at 1- and 6-weeks post transplantation (400x). G) Siglec-H (brown) and Foxp3 (blue) co-staining of an accepted DBA/2 allograft kidney 53 days post-transplantation shows a number of Siglec-H+ cells proximate to Foxp3+ cells (400x). Localized magnification of the staining is included to show clearer cell-cell proximity (arrows, 600x). H) Immunohistochemical staining of phospho-ERK reveals the presence of phosphorylated ERK proteins in cells making up TOLS in spontaneously accepted kidneys indicating an activation of the MEK/ERK signaling pathways (400x). I) Isolated CD45+CD11c+Siglec-H+PDCA-1+ cells from accepted DBA/2J to B6 kidney allografts, post-transplant week 1 and week 6. We observed an increase in the population of I-Ab+ pDCs from week 1 to week 6, whereas the population of I-Ad+ pDCs in the same allograft were unchanged. J) Further analysis of pDCs from accepted DBA/2J to B6 kidney allografts demonstrate a population of I-Ab+ pDCs expressing both I-Ab and I-Ad on post-transplant week 6.
At one week post-transplant both donor and recipient pDCs are found in the allograft, as judged by single staining for either I-Ad, or I-Ab. An average of 10% were donor derived and 47% recipient derived (Figure 2I). At 6 weeks post-transplant, an average of 86% of the pDCs were from the recipient (Figure 2I). The majority, if not all, of the pDCs that displayed I-Ad (donor) were positive for Ab (recipient) (Figure 2J) suggesting “cross dressing” of recipient pDC. No detectable cross-dressing was observed at 1 week (Figure 2J).
Functional Activity of pDCs from Accepted Kidney Allografts.
pDCs isolated from native DBA/2 kidneys, syngeneic B6 kidneys and accepted DBA/2 allografts from B6 recipients on day 31 and 52 post-transplant were tested for their ability to induce Foxp3+ expression in vitro in CD4+CD25− T cells. pDCs from accepted DBA/2 kidneys induced more T cells expressing Foxp3 than pDC from normal DBA/2 kidneys or syngeneic B6 kidneys (mean 3.36% ± 0.07% vs 1.09% ± 0.23% vs 0.80% ± 0.09%, respectively) (Figure 3). There was no significant difference in Foxp3 induction by pDCs from accepted post-transplants day 31 and day 52 (3.35% ± 0.43% vs 3.36% ± 0.07%, respectively) (Figure 3).
Figure 3. Functional activity of pDCs from accepted kidney allografts.
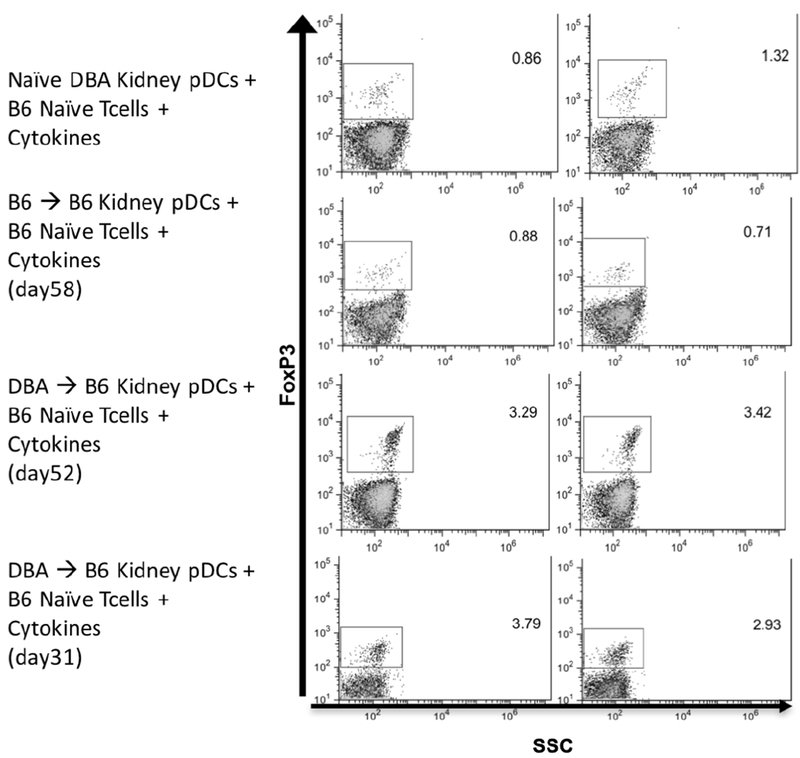
Isolated pDCs from naïve DBA/2 kidney, syngeneic B6 to B6 kidney, and spontaneously accepted DBA/2 to B6 kidney were co-cultured with B6 T CD4+CD25− T cells and IL-2/TGFβ. After a 4-day incubation period, Foxp3 expression was induced in naïve B6 T cells in greater levels by pDCs from spontaneously accepted allografts when compared to pDCs from naïve and syngeneic kidney. There was no difference between pDCs isolated from allografts at different post-transplant days.
Strain Specific Differences in Foxp3 Induction Potency.
We hypothesized that pDCs from donor mouse strains whose kidneys were spontaneously accepted would be more effective in promoting Foxp3 induction than strains whose kidneys are rejected. pDCs were isolated from BM to maximize the number of conditions we could include in each assay. BM-derived pDCs derived from naive DBA/2 mice were positive for pDC markers PDCA-1, and B220 as well as the pDC immaturity marker CCR9 (Figure 4A).4 When cocultured with CD4+CD25− naïve B6 T cells in the presence of IL-2 and TGF-β, these cells induced substantial Foxp3 expression, as measured by the percent of intracellular staining for Foxp3 among all CD3+ cells (Figure 4B and 4C). This expression was greater than that in the absence of pDCs (mean 27.2% vs 1.75%, p<.0001), or in cells co-cultured with syngeneic pDCs (mean 2.53%, p<.0001) (Figure 4B and 4C). In contrast, BM-derived pDCs from B6 mice were unable to induce Foxp3 expression in DBA/2 naïve T cells when co-cultured for 4 days with IL2 and TGFβ (Figure 4D) and although BM-derived pDCs from C3H mice could induce Tregs in a dose-dependent manner, DBA/2 BM pDCs induced significantly more Foxp3+ cells than C3H at any cell ratio (p < 0.01) (Figure 4E). For instance, DBA/2 BM pDCs at a pDC:T cell culture ratio of 1:15 induced significantly greater Foxp3 expression than C3H BM pDCs at a pDC:T cell ratio of 1:3 (20 vs 13%, respectively, p < 0.02). Thus, the ability of BM-derived pDC to induce Foxp3+ varied with strain. The pDC potency correlated with the strain whose kidney allografts were spontaneously accepted (Figure 4E).
Figure 4. Strain specific differences in Foxp3+ induction.
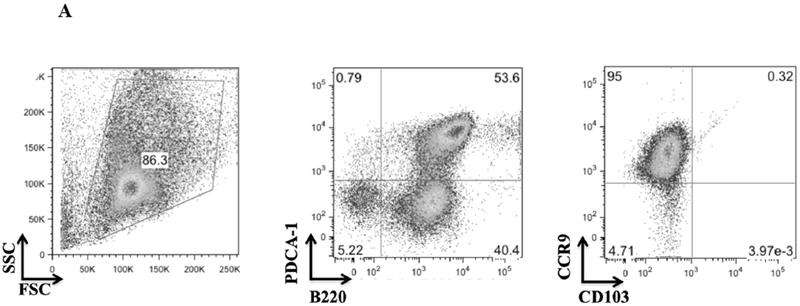
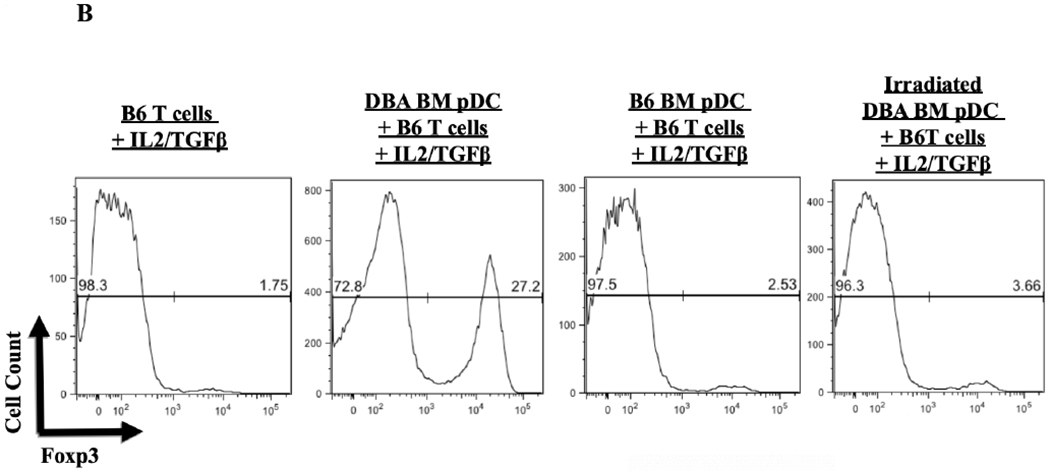
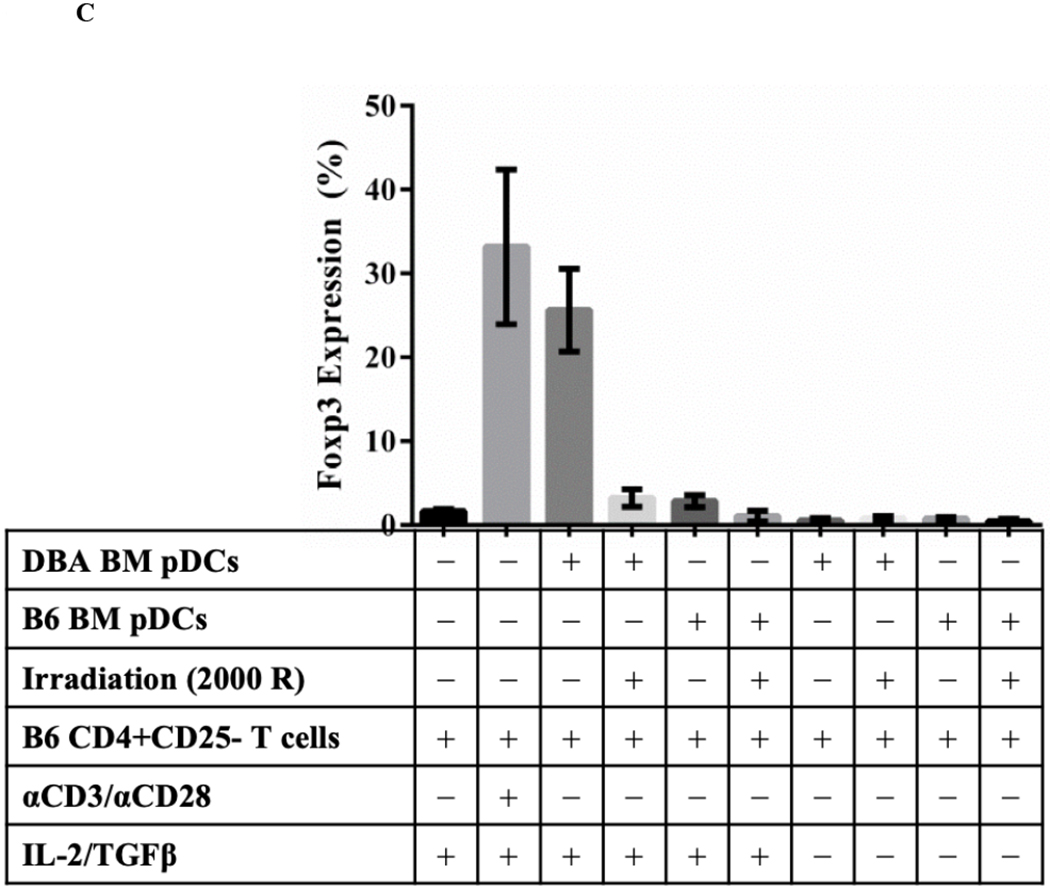
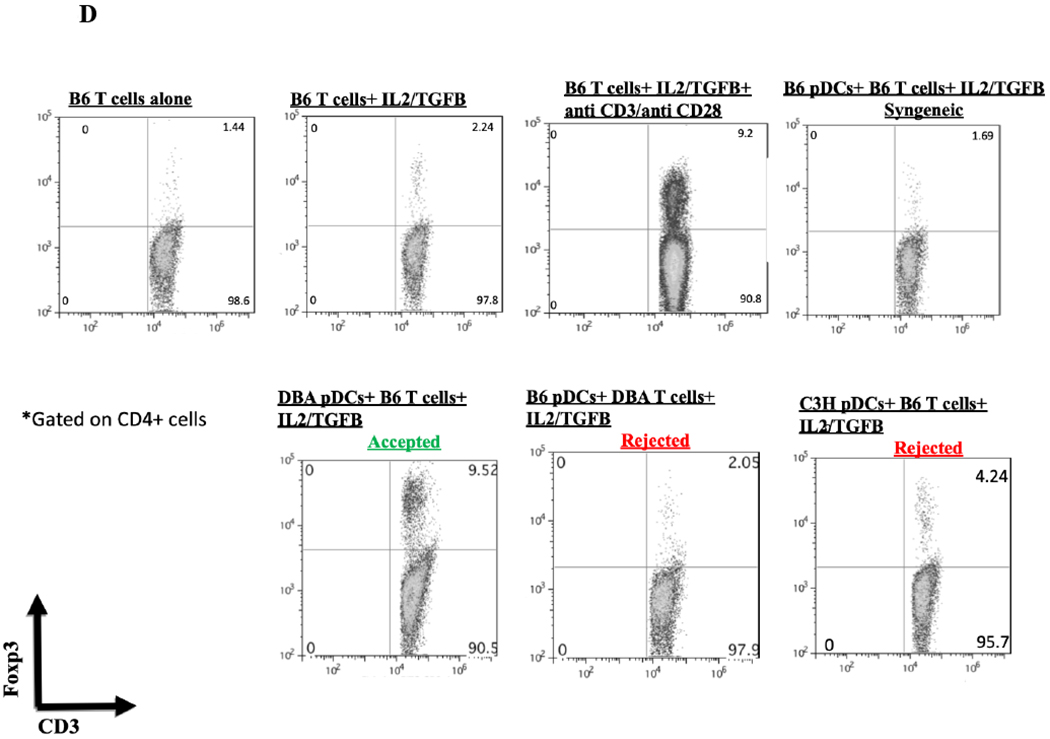
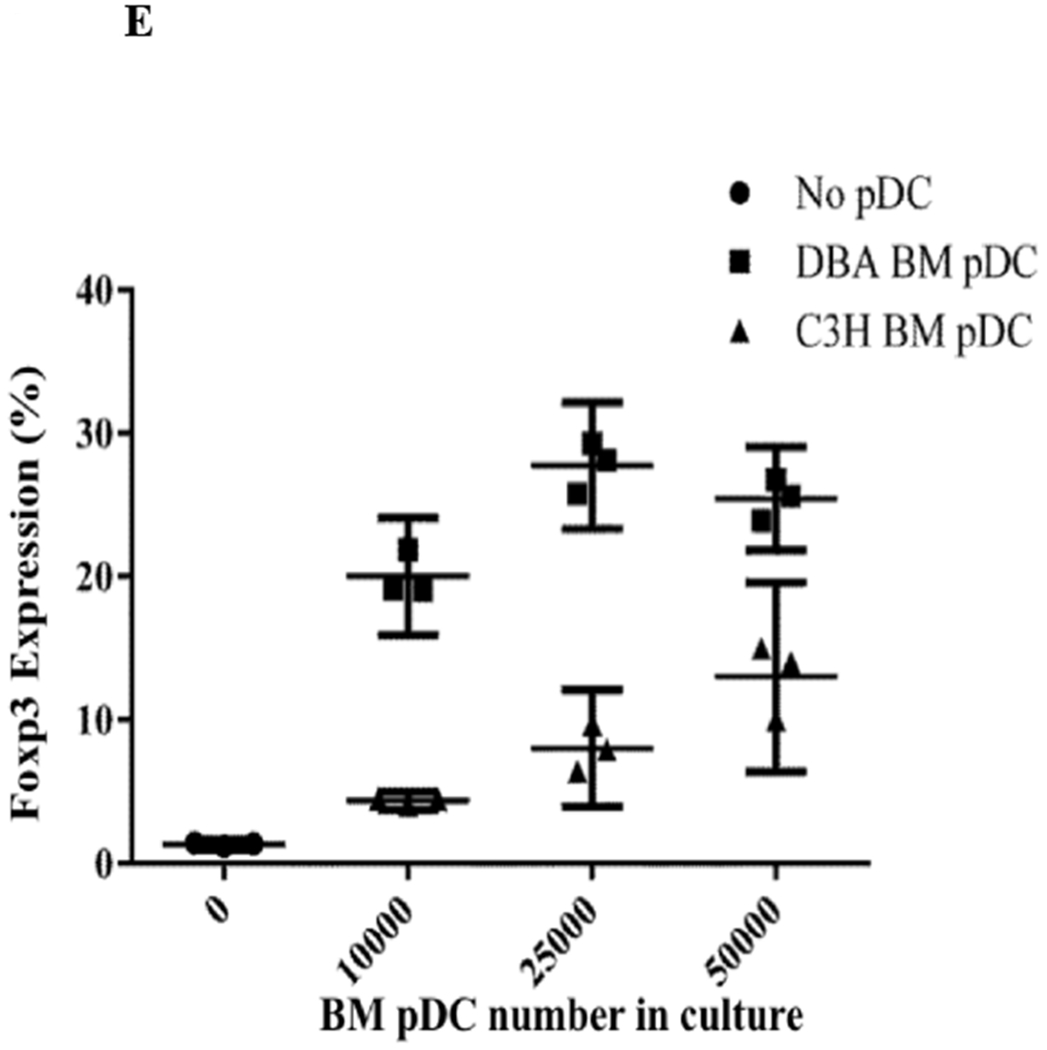
A) FACS analysis of DBA/2 BM pDCs isolated by MACs separation. Cells were gated on FSC vs SSC to exclude dead cell debris. DBA/2 BM pDCs were B220, PDCA-1 and CCR9 positive but CD103 negative. B) After 4 days of culture with IL-2 and TGFβ, splenic derived CD4+CD25− B6 T cells show little Foxp3 expression in CD3+ cells. Including BM derived DBA/2 pDCs in the in vitro culture significantly increased Foxp3 expression compared to T cells cultured with IL-2 and TGFβ (25.6% vs 1.65%, p < 0.001) even with the addition of syngeneic B6 BM pDCs (mean 25.6% vs 2.86%, p < 0.001). Induction was ablated by irradiation of pDCs with 2000 rads before co-culture (p < 0.001). C) Foxp3 induction among CD4+CD25− B6 T cell cultures utilizing various culture combinations. D) Foxp3+ expression among CD3+ cells after occurred in allogenic strain combinations that correlate with spontaneous kidney allograft acceptance. E) Separate 4-day cultures of 150,000 splenic derived CD4+CD25− B6 T cells with IL-2 and TGFβ with 0 (circle), 10,000, 25,000 or 50,000 BM pDCs from DBA/2 (square) or C3H (triangle) mice (p < 0.01). The experiments were performed in triplicates and what is shown is representative of the data.
Requirements for Foxp3 Induction by pDC.
The induction of Foxp3 required the presence of viable pDCs, as irradiated DBA/2 BM pDCs lost their viability to induce Foxp3 (Figures 4B and 4C). Furthermore, because of the capping of SiglecH, we tested whether cell-cell contact was necessary for induction of Foxp3. Using Transwells, with DBA/2 BM pDCs and B6 CD4+CD25− T cells on opposite sides of the membrane. We found that T cells were not induced to express Foxp3+ (Figure 5). Interestingly, Luminex analyses of the supernatant from the in vitro FoxP3 induction assay at day 4 revealed no detectable differences in the levels of IL-4, 6, 10, and 17a, indicating that these cytokines are unlikely to play a role in Fox3 induction by pDCs, at least at day 4 (data not shown).
Figure 5. Cell-cell contact requirement for pDC-mediated Foxp3 induction.
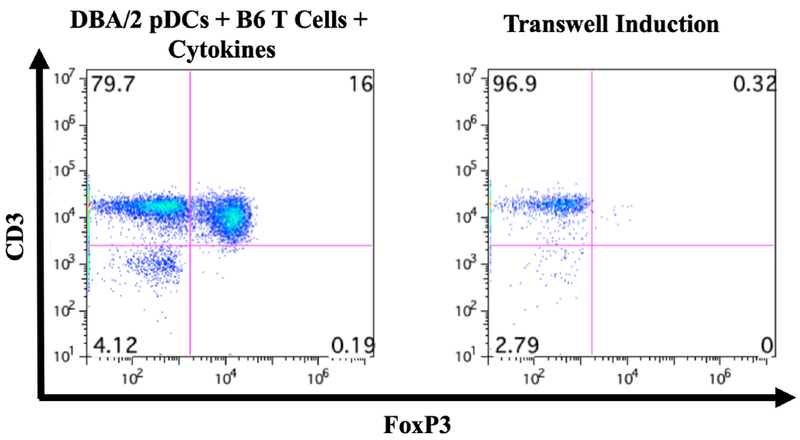
Transwell experiment was performed using DBA/2 pDCs and naïve B6 T cells. CD3+ cells did not increase expression of Foxp3, suggesting the requirement for cell-cell contact in pDC-mediated Foxp3 induction.
The induction of Foxp3 by pDC is dependent on MEK/ERK, GSK-3β, and NFκB pathways.
Previous studies demonstrated that the MEK/ERK, GSK-3β, and NFκB signaling pathways are activated during the induction of Foxp3 expression.11–14. Therefore, we tested whether inhibition of these pathways would influence pDC ability to induce Foxp3 expression. We found that inhibition of MEK½ and NFκB results in the suppression of Foxp3 induction in vitro (Figure 6A). Studies have also shown that Akt activation results in the inhibition of Treg induction in peripheral T cells.15–17 One of the downstream kinases negatively regulated by Akt is GSK-3β. We next asked if direct inhibition of GSK-3β, mimicking Akt activation, would result in the suppression of Foxp3 induction. In Figure 6B we show that treatment of the in vitro Foxp3 induction assay with BIO, a specific inhibitor of GSK-3β, results in the complete reduction of Foxp3 expression.
Figure 6. Foxp3 induction by pDCs dependent on MEK/ERK and NFκB pathways.
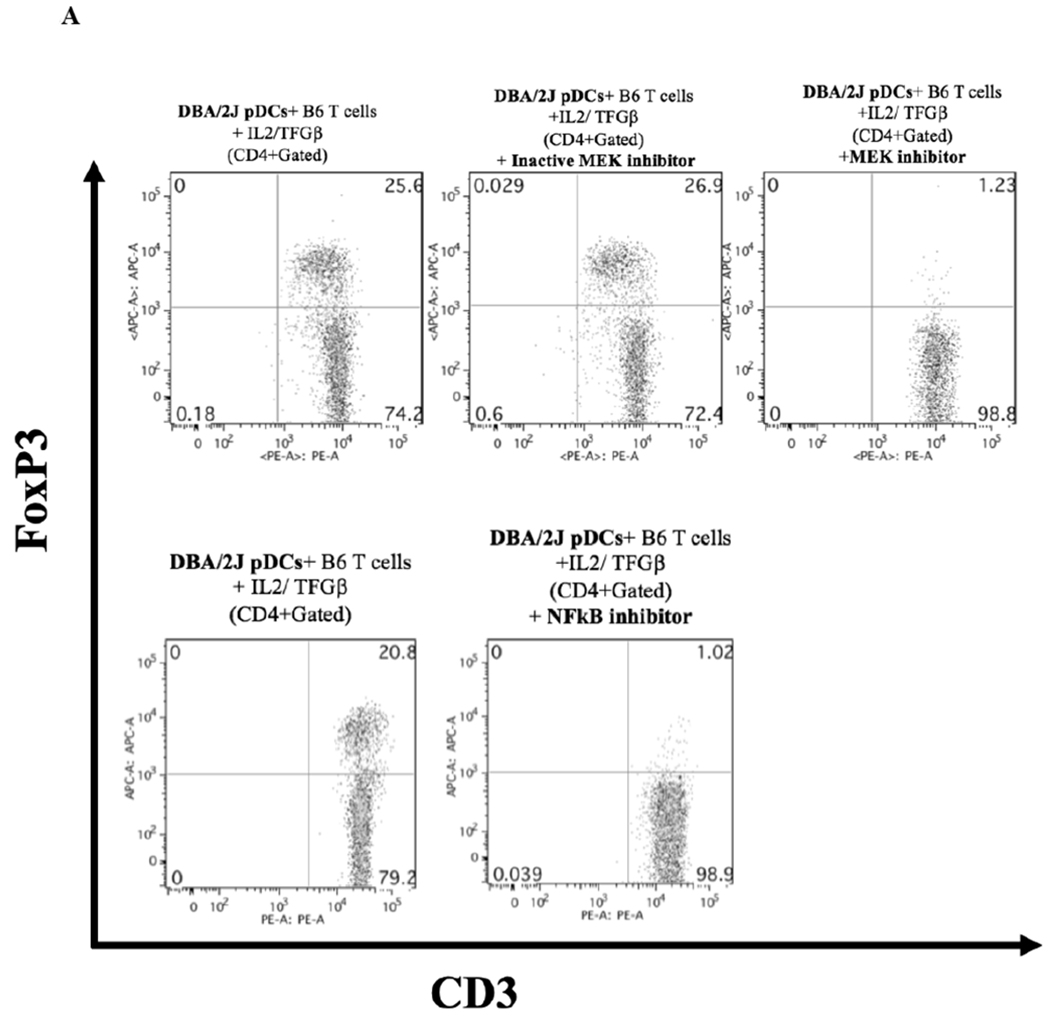
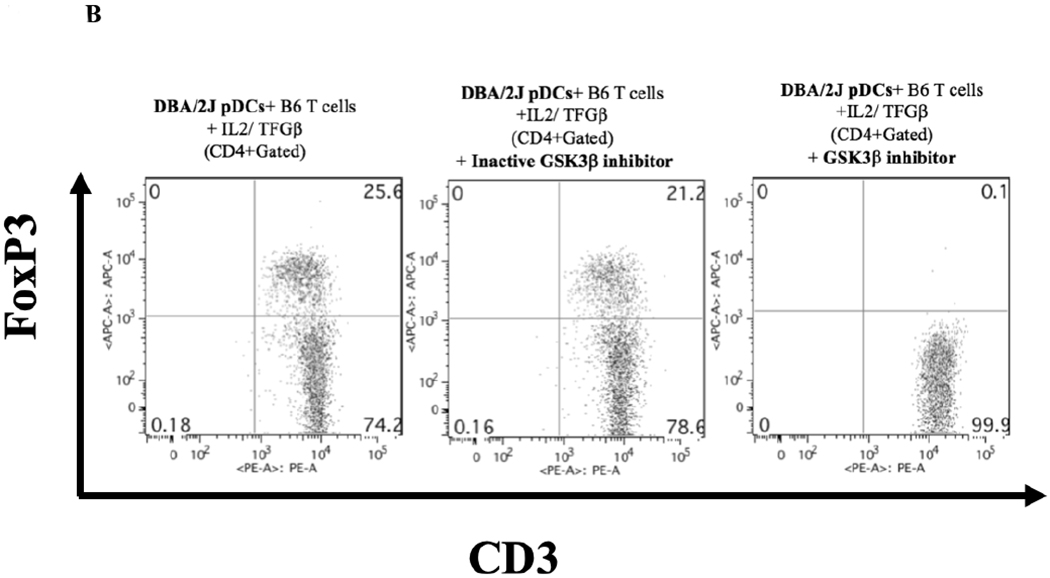
A) Inhibition of MEK/ERK and NFκB signaling pathways result in the suppression of Foxp3 expression in naïve T cells. U0126 (active MEK½ inhibitor) and U0124 (inactive counterpart control) were each used at 1 μM; IT901 (inhibitor of the NFκB pathway) was used at 1 μM. Data presented is representative of two independent experiments done in triplicates. B) Inhibition of GSK-3b signaling pathway results in the suppression of Foxp3 expression in naïve T cells. BIO (active GSK-3b inhibitor) and Me-BIO (inactive counterpart control) were each used at 1 μM. Data presented is representative of two independent experiments done in triplicates.
Maturation of pDCs inhibits their ability to induce Foxp3.
To test whether in vitro maturation of pDCs could prevent Foxp3 induction, pDCs were treated for 24 hours with TLR9 agonist CpG ODN 1668 (Invivogen, San Diego, CA) and then cultured together with B6 CD4+CD25− T cells and IL-2/TGFβ for 4 days. Culturing with CpG stimulated these immature pDCs to upregulate expression of the maturity markers CD80 and CD86: from 0.25% to 2.92% for CD80 and from 4.45% to 20.6% for CD86 (Figure 7A). Compared to untreated fresh and 24-hour untreated BM pDCs, CpG-treated pDCs failed to induce Foxp3 (mean 1.3% Foxp3+ for CpG pDCs treated vs 15.6%, for untreated 24-hour pDCs, p < 0.001) (Figure 7B).
Figure 7. Immaturity requirement for pDC-mediated Foxp3 induction.
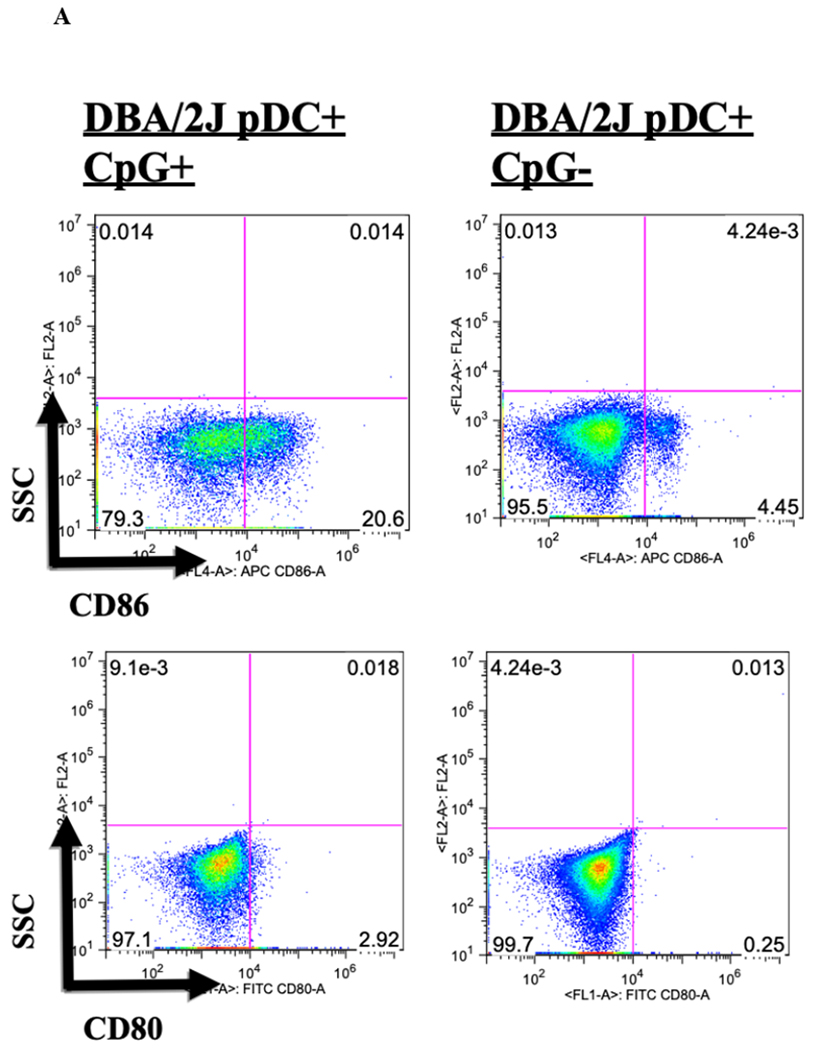
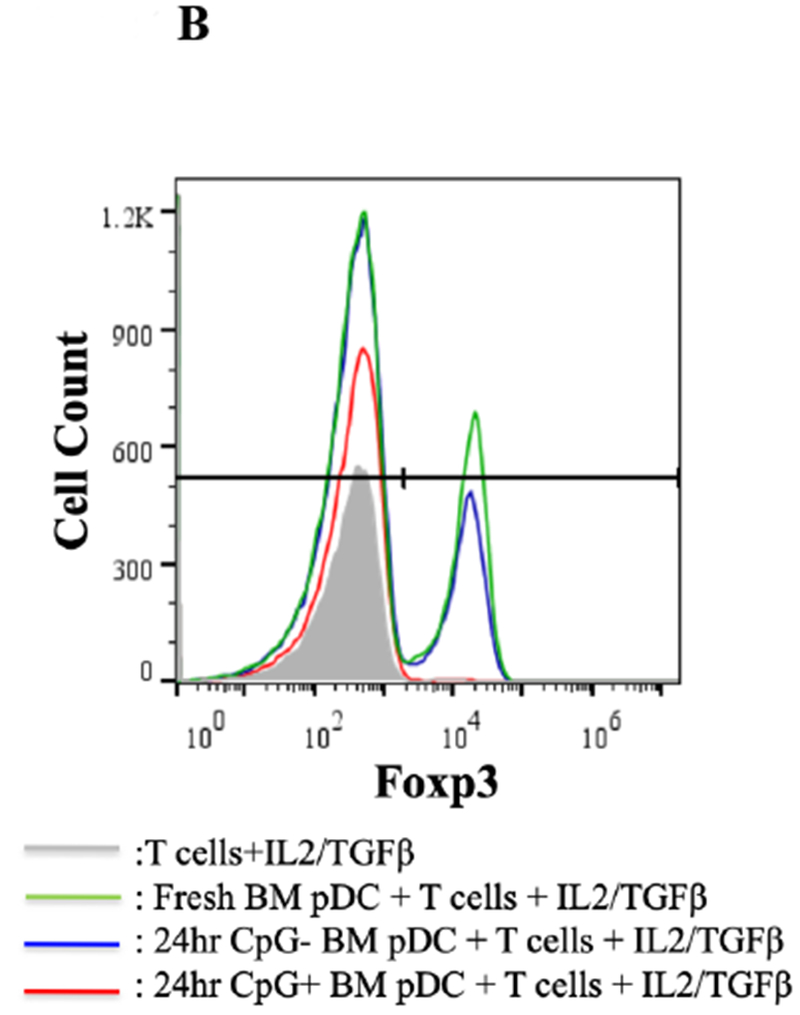
A) DBA/2 BM pDCs were co-cultured for 24 hours with and without CpG and isolated by column separation. Cells were analyzed by FACS, gated on FSC vs. SSC to exclude dead cell debris, and stained for CD80 and CD86. DBA/2 BM pDCs co-cultured with CpG for 24 hours were 20.6% CD86+ compared to 4.5% without CpG. There was no significant difference in levels of CD80 positivity between BM pDCs co-cultured 24 hours with and without CpG. B) DBA/2 BM pDCs co-cultured with CpG for 24 hours failed to induce Foxp3 expression in T cells in the presence of IL-2/TGFβ compared to 24 hour aged BM pDCs (p < 0.01).
Class II, but not class I alloantigens, are sufficient to promote pDC-mediated Foxp3 induction in vitro.
Because syngeneic pDCs induced little or no Foxp3 induction, we postulated that alloantigens promoted Foxp3 expression, and sought to identify the nature of the allogeneic stimulus. We first tested whether a MHC disparity was sufficient, using B6.C (H2d/bByJ [H2d]) pDCs that differ from B6 mice at the MHC locus but not at the minor antigen level. B6.C pDCs induced Foxp3 in B6 CD4+CD25− naïve T cells equally to DBA/2 pDCs (mean 15.5% vs 15.5%, p=0.97) (Figure 8A). Irradiated pDCs of B6.C H2d/bByJ (lost the ability to upregulate Foxp3 expression, thus suggesting the importance of MHC in this induction (data not shown).
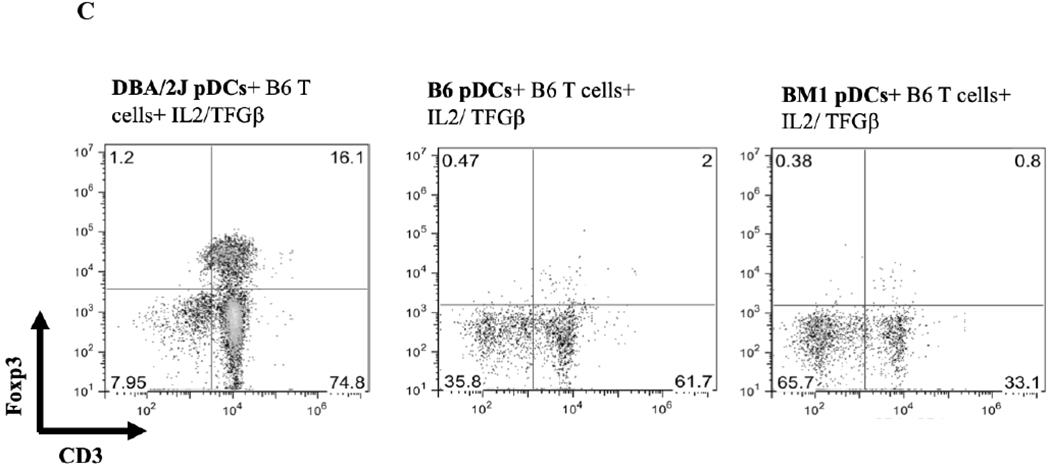
Figure 8. Class II alloantigens are sufficient to promote pDC-mediated Foxp3 induction.
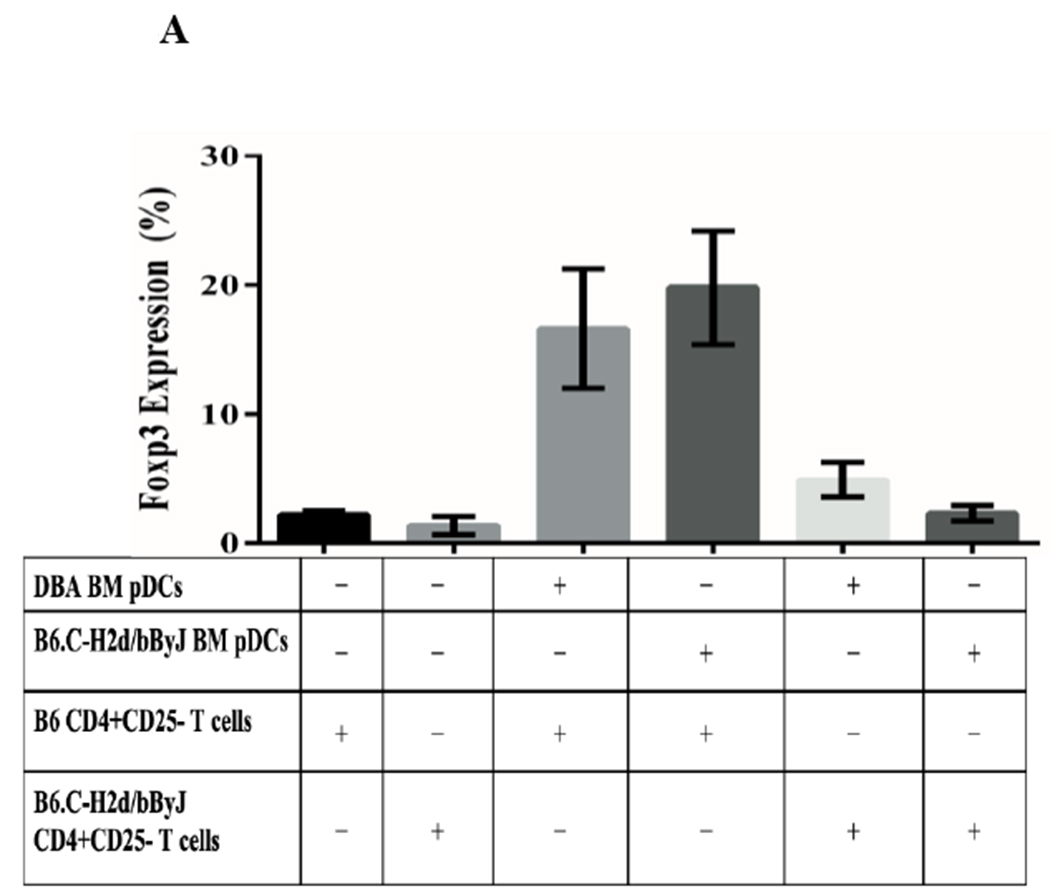
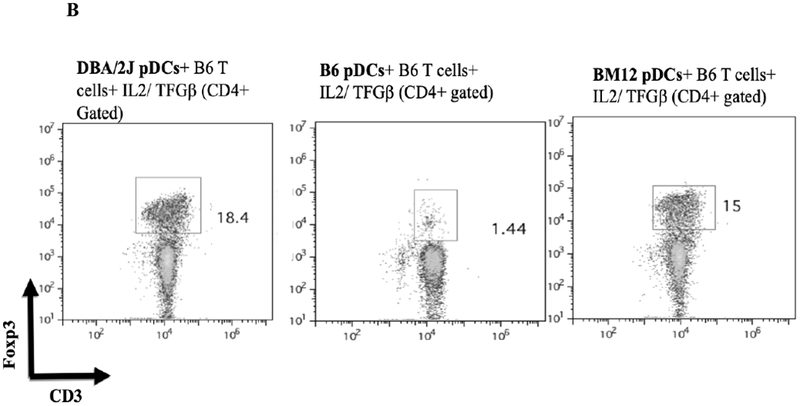
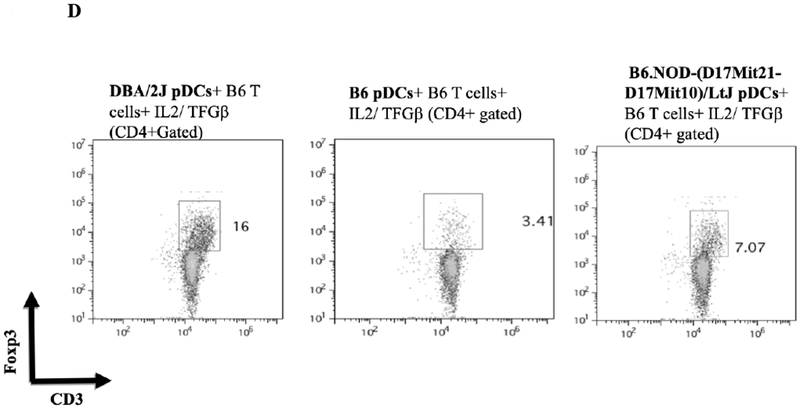
A) B6.C-H2d/bByJ BM derived pDCs (congenic with B6 mice except for the expression of H2d) induced Foxp3 expression to a similar level as DBA/2J BM derived pDCs (mean 19.8% Foxp3+ vs 16.6%, p=.10). DBA/2 BM pDCs had significantly reduced capacity to induce Foxp3 among B6.C-H2d/bByJ T cells compared to B6 T cells (16.6% vs 4.89%, p<.001). Error bars represent 95% confidence intervals. B) bm12 bone marrow derived pDCs (congenic with B6 except for MHC class II disparity) induced a similar induction of CD3+Foxp3+ cells (gated on the CD4+ population of cells) as DBA/2 BM pDCs when co-cultured for 4 days with naïve B6 T cells and IL2/ TGFβ. C) bm1 pDCs (congenic with B6 except for MHC class I disparity) induced little expression of Foxp3, similar to the syngeneic pDC/naïve T cell culture. D) BM pDCs from B6.NOD-(D17Mit21-D17Mit10)LtJ ( which express H2d except for a g7 mutation at the Ab locus of the MHC class II molecule) induce less CD4+CD3+Foxp3+ cells than H2d DBA/2 BM pDCS when co-cultured with naïve B6 T cells and IL2/ TGFβ.
To separate the effects of class I or class II disparities, pDCs from bm1(H2bm1) and bm12 (H2bm12) mice were used. bm12 mice differ from B6 in genetics at only the H2-I-Ab locus of their MHC class II molecules, whereas bm1 mice differ from B6 in their class I genetics. pDCs from bm12 mice induced a relatively similar CD4+CD3+Foxp3+ Treg population as DBA/2J pDCs (mean 15.0% vs 18.4%) (Figure 8B), whereas pDCs from bm1 where unable to induce CD3/Foxp3 positivity from CD4+ naïve T cells (mean 0.8% vs 16.1%) (Figure 8C). These data suggest that a mismatched MHC class II, but not class I, is necessary for pDCs’ ability to produce Tregs from naïve B6 T cells. To further investigate the role of the MHC class II mismatching, we used pDCs from B6.NOD-(D17Mit21-D17Mit10)/LtJ (NOD) mice which have H2d MHC class II genetics at all loci, except for a g7 mutation at the H2-I-Ab locus. Co-culturing BM B6.NOD pDCs with CD4+ naïve B6 T cells with IL2 and TGFB shows that B6.NOD pDCs induced a smaller CD4+ CD3+ Foxp3+ population to that observed with fully H2d DBA/2 BM pDCs (Figure 8D). This suggest that certain mismatching MHC class II molecules, specifically at the H2-I-Ab locus, can alter pDCs’ ability to induce Tregs in vitro. Thus MHC-II but not MHC-I alloantigens are sufficient for in vitro pDC Foxp3 induction.
In Vitro Function of Foxp3+ Cells Induced by pDC.
To assess the function of Foxp3+ T cells induced by DBA/2 pDCs, B6 CD4+Foxp3+ cells, induced by co-culture with DBA/2 BM pDCs in the presence of IL-2/TGF-β, were tested for their ability to inhibit proliferation of T cells from sensitized recipients (B6 recipients that rejected DBA/2 skin or heart allografts). Co-culture of T cells from sensitized recipients activated with either irradiated DBA/2 splenocytes or anti-CD3/anti-CD28 beads resulted in the proliferation of T cells. Addition of Foxp3+ T cells induced by DBA/2 BM pDCs significantly suppressed proliferation caused either by DBA/2 splenocytes (mean 53.7% vs 8.01% proliferating cells, p < 0.001) or anti-CD3/anti-CD28 beads (mean 95.4% vs 34.0% proliferating cells, p < 0.002) (Figure 9A and 9B). This suppression was significantly greater than that seen in controls, including cultures of pDCs with T cells, pDCs with cytokines, and T cells with cytokines (Figure 9A and 9B).
Figure 9. Functionality of Foxp3+ cells induced by pDCs in vitro.
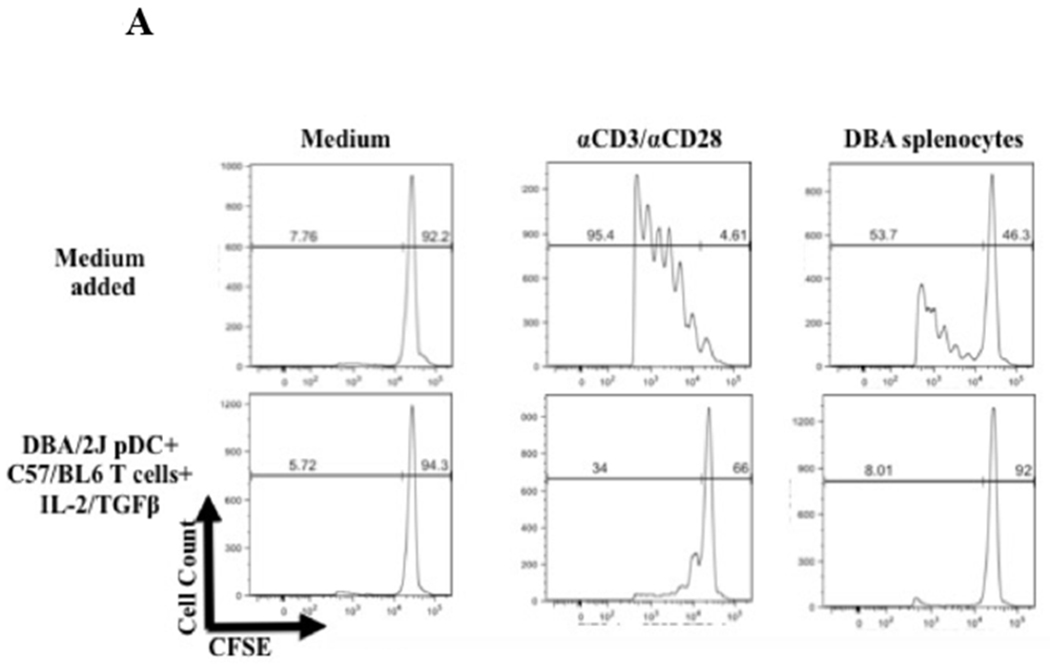
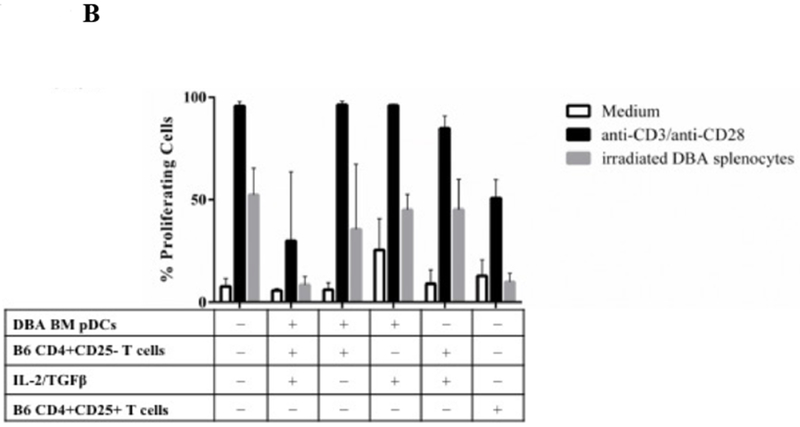
A) CFSE staining of CD4+CD25− responders showing proliferation as measured by CFSE dilution after 4 days in the presence of only medium added or DBA/2 pDCs, B6 T CD4+CD25− T cells and IL-2/TGFβ from a previous 4-day culture. Suppression occurred via the pDC/Treg induction co-culture in response to stimulus including medium (no stimulus), anti-CD3/anti-CD28 beads, and irradiated DBA/2 splenocytes. Histograms represent the percentage of proliferating CFSE stained responders after 4 days after stimulus with medium, anti-CD3/anti-CD28 beads, or irradiated DBA/2 splenocytes. Suppression did not occur with addition of other 4-day cultures, including B6 T CD4+CD25− T cells cultured with DBA/2 pDCs and DBA/2 pDCs cultured with IL-2/TGFβ. Similar suppression occurred with freshly isolated splenic derived CD4+CD25+ T cells cultured in a 1:1 Tresp:Tsupp ratio. B) Bar plots represent proliferating cell populations from the suppression assay including conditions of pDCs with T cells, pDCs with cytokines, and T cells with cytokine.
In Vivo Activity of Foxp3+ Cells Induced by pDC.
To assess for the in vivo suppressive capacity of pDC induced Foxp3+ cells, we transferred 1.0 × 10⁶ cells after culturing DBA BM pDCs and B6 CD4+CD25− T cells in the presence IL2/TGFβ for 4 day in vitro into B6 mice at various times before DBA to B6 heterotopic heart transplantation. Intravenous injection of these cells, after IL2/TGFβ were washed away, significantly prolonged the survival of heterotopic DBA cardiac allografts as assessed by palpation score (n=7, MST=11, p < 0.001) (Figure 10). Cardiac allografts had a median survival time (MST) of 6 days post-transplant without any cell injection (n=6). Transfer of cells that were incubated in vitro for 4 days without the addition of IL2/TGFβ, led to no significant prolongation (n=3, MST=7, p = 0.37). Prolongation also occurred with Foxp3+ cell injection at 1 week before transplantation (n=3, MST=13, p < 0.001). Two injections of cultured cells containing iTreg at 2 weeks and 1 week prior to transplant prolonged allograft survival by 17 days (n=4, MST=24, p < 0.001).
Figure 10. Activity of pDC induced Foxp3+ cells in vivo.
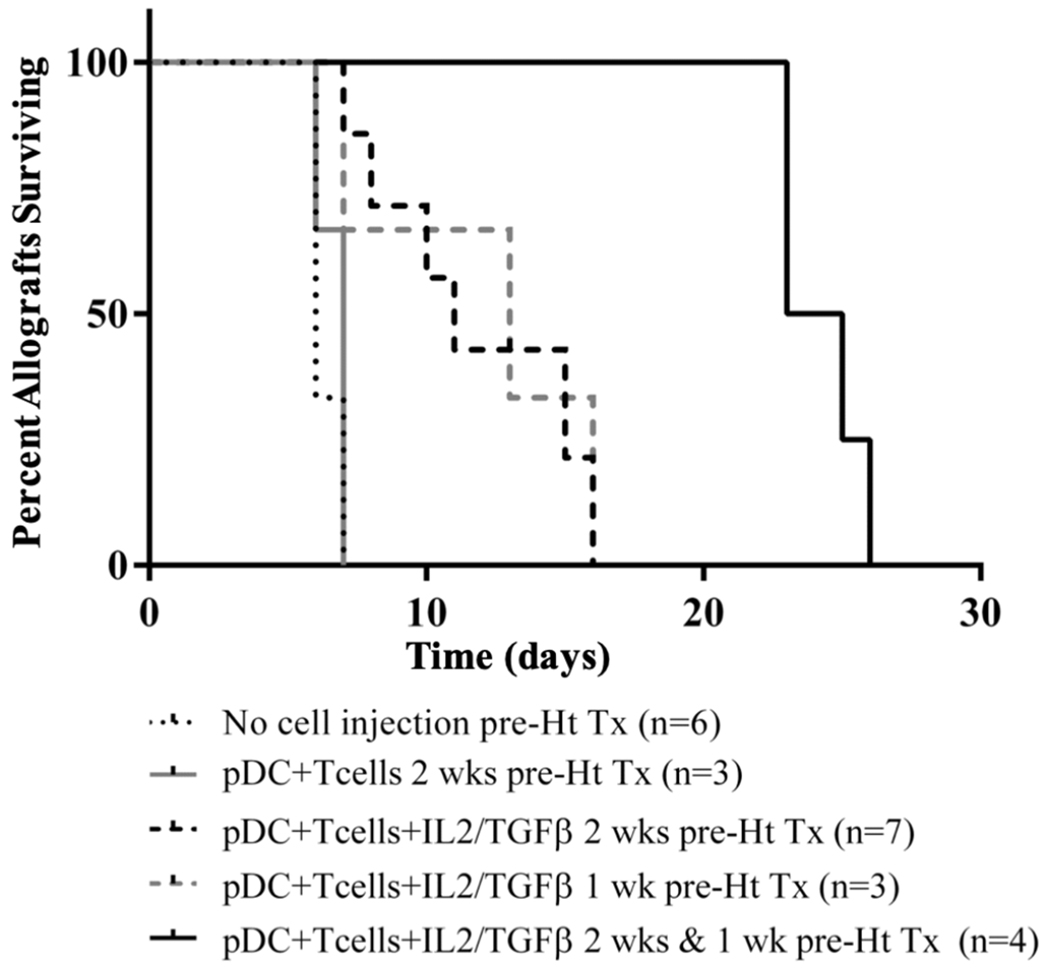
No cell injection lead to rejection around 6 days after transplant. Injecting cultures (DBA pDCS + B6 CD4+CD25− T-cells) where cytokines were not added and thus there was no Foxp3+ induction lead to no prolongation (p=.37). Injecting cell cultures (DBA pDCS + B6 CD4+CD25− T-cells + IL-2/TGFβ) producing Foxp3+ cells prolong allograft survival by a mean of 5 days (MST 11 days) at two weeks before injection (p < 0.001). Prolongation also occurred with injection at 1 week before transplantation (p < 0.001). Injecting cells 2 weeks and 1 week prior to transplant prolong allograft survival by 17 days (p < 0.001).
Discussion
Regulatory or tolerogenic dendritic cells, which include pDCs, have been shown to prolong allograft survival in murine and non-human primate models, but the mechanism of these therapies remain unknown.18,19 Meanwhile, Foxp3+ Tregs are widely known to suppress alloimmune reactions in vitro and in vivo, and hence are of specific interest in cellular therapy.20–22 We sought evidence to test our hypothesis that pDCs are responsible for the expansion of Foxp3+ Tregs in TOLS in vivo and that these Tregs mediate spontaneous acceptance of some kidney allografts. First, we demonstrated the presence of pDCs in murine kidneys, and not hearts, which corroborates our observation of spontaneous acceptance in kidney allografts and rejection in heart allografts. We showed that pDCs and Foxp3+ Tregs, which are both tolerogenic immune cell types, coexist in TOLS of spontaneously accepted kidney allografts. Immunohistochemistry and flow cytometric analyses show that unlike pDCs from native kidneys, pDCs isolated from spontaneously accepted kidneys allografts are Siglec-Hhi and specifically found in TOLS. The increased expression of Siglec-H is consistent with its ability to contribute to tolerance, as previously described.9,23 However, it is unclear the role that increased expression of Siglec-H plays in the antigen presentation process of pDCs and necessity for Treg induction is undetermined in this study and will be the subject of future experiments. Furthermore, pDCs isolated from accepted DBA/2 kidney allografts were able to induce greater Foxp3 expression in naïve B6 T cells in vitro than pDCs isolated from native kidneys. From these data, we postulated that pDCs from certain mouse strains would be better in driving Treg induction and those strains would correlate with the spontaneous acceptance of kidney allografts. Using BM-derived pDCs, we set up an in vitro assay to assess if the relative induction of Tregs by pDCs from various strains corresponded to strain combinations that have been previously reported to manifest spontaneous kidney allograft acceptance.1,24 For example, significantly greater expansion of B6 Foxp3+ Tregs was caused by DBA/2 pDCs (H2d) compared to C3H (H2k) pDCs; DBA/2 kidneys are accepted by B6, while C3H are not. This result is compatible with the hypothesis that pDCs are relevant to local Foxp3 expansion in the graft. Foxp3+ induction in naïve B6 T cells by pDCs was only observed between allogeneic strains; isogeneic pDCs were inactive. We show that the induction of Tregs in vitro by pDCs is dependent on the activation of MEK/ERK, GSK-3β, and NFκB signaling pathways. While we acknowledge that BM pDCs may behave differently when isolated from kidney pDCs from accepted allografts, we found that they both display pDC markers SiglecH and PDCA1, which may indicate a shared phenotype. Further, BM pDCs provide a larger yield that is required for our in vitro experiments.
MHC alloantigen was sufficient for Foxp3+ induction as shown by the ability of H2d congenic B6.C H2d/bByJ BM pDCs to induce Foxp3 expression in B6 CD4+CD25− T cells. Foxp3+ induction was observed with only Class II disparity (bm12 pDC and B6 T cells) and not class I disparity (bm1 pDC and B6 T cells). The reduced in vitro induction of Foxp3 by B6.NOD pDCs, which are H2d except for a g7 mutation at the H2-I-Ab locus, demonstrates the importance of the H2-I-Ab locus. This result is not unexpected since the responding T cells are CD4+ and recognize class II antigens. These results do not rule out other triggers for Foxp3 induction (other class I disparities or non-MHC differences), however they do show that a single class II antigen difference is sufficient. We further show that this data supports the conclusions from our previous studies that the ability of pDCs to induce Foxp3+ cells is predominantly an allogeneic response and strain dependent (Table 1).
Table 1.
| pDC/ Donor Strain | pDC/ Donor MHC Type | Naïve T Cell/ Recipient Strain | Naïve T Cell/Recipient MHC Type | In vitro FoxP3 Induction (% of CD3+CD4+ cells) | Graft Result/Mean Survival Time |
|---|---|---|---|---|---|
| DBA/2J | H2d | B6 | H2b | High, ≥ 10% | Accepted (n = 6) TOLS formed |
| B6 | H2b | DBA/2J | H2d | Low, <10% | Rejected 8 Days +/− 0.25 (n = 4) No TOLS formed |
| C3H | H2k | B6 | H2b | Low, <10% | Rejected 24 Days +/− 11 (n = 3) No TOLS formed |
| BM12 | H2bm12 (H2b with H2-I-Ab bm12 mutation) | B6 | H2b | High, ≥ 10% | Accepted (n = 3) TOLS formed |
| BM1 | H2bm1 (Class I mutation) | B6 | H2b | Low, <10% | Accepted? (n = 3) NO TOLS formed |
We report here that pDCs’ immaturity is critical in their ability to induce Tregs. There has been controversy about whether immature or mature pDCs carry a tolerogenic potential. Previous ex vivo induction experiments utilizing splenic murine or peripherally derived human pDCs have utilized CpG or LPS-matured (i.e. increased CD80/86 expression) pDCs to produce CD4+CD25+ Foxp3+ Tregs from CD4+CD25− T cells an IDO- and contact-dependent mechanism.25–27 IDO is additionally implicated in pDC induced Treg production in the setting of tumors and HIV infection.28,29 Importantly, IDO expression is crucial in spontaneous murine kidney allograft acceptance.30 The present study clearly demonstrates that CpG-matured BM pDCs failed to induce Foxp3 expression achieved by utilizing freshly isolated or unmanipulated, 24-hour untreated BM-derived, CD80/86 low, CCR9+ pDCs thus implying immaturity. Irradiation may have eliminated expression of IDO among BM pDCs and thus prevented induction. It may also have deterred other contact dependent methods of pDC-mediated Treg induction, such as stimulation with ICOS-ligand expression.3,31 The differences between these findings and previously published works may be associated with the importance of the specific MHC mismatching which appears to control induction in this setting.
This study demonstrates that the level of in vitro induction of functional Tregs by pDCs is strain specific and dependent on allogeneic differences. These findings parallel the spontaneous acceptance of kidney allografts that we observe in our mouse transplant models and may explain known organ-specific and strain-specific differences in tolerance induction. While increased pDC and FoxP3+ Tcell populations in TOLS of spontaneously accepted kidneys suggest that pDCs play an important role in this process, we have not yet established direct evidence of in vivo FoxP3+ induction in Tcells by pDCs. However, our findings have laid the groundwork for future studies that aim to elucidate the mechanisms of Foxp3+ Tcell induction by pDCs in vivo. Furthermore, optimizing and stabilizing pDC mediated Treg induction both in vitro and in vivo may provide a future cellular therapy for allograft acceptance.
Acknowledgements
This work was supported by US National Institutes of Health grants RO1 AI081734 (R.B.C.), RO1 HL071932 (J.C.M.), and P01-AI123086 (J.C.M, R.B.C., A.A.), and a NSFC general project grant 81570679 (Q.Y.), Beijing NOVA Program Z161100004916141 (Q.Y.), and a grant from the Roche Organ Transplant Research Foundation (J.C.M.). We would like to thank Dr. A. B. Cosimi for his invaluable input regarding the manuscript.
Abbreviations:
- BM
bone marrow
- IDO
Indoleamine-pyrrole 2,3-dioxygenase
- B6
C57BL/6
- DBA/2
DBA/2J
- C3H
C3H/HeJ
- pDC
plasmacytoid dendritic cell
- TOLS
Treg-rich organized lymphoid structures
- Treg
regulatory T cell
- Ag
antigen
Footnotes
Conflict of Interest Statement
The authors listed below certify that they have NO conflict of interest in the subject matter or materials discussed within the above manuscript:
Nicholas A. Oh
Thomas O’Shea
Dorothy K. Ndishabandi
Qing Yuan
Shanjuan Hong
Jared Gans
Jifu Ge
Sean Gibney
Catharine Chase
Chao Yang
Ivy Rosales
Kazunobu Shinoda
Benjamin Drew
Lisa Kojima
Paul S. Russell
Joren C. Madsen
Robert B. Colvin
Alessandro Alessandrini
Disclosure Statement of Financial Interest
The authors listed below DO NOT have a financial/arrangement or affiliation with one or more organizations in the subject matter or materials discussed within the above manuscript:
Nicholas A. Oh
Thomas O’Shea
Dorothy K. Ndishabandi
Qing Yuan
Shanjuan Hong
Jared Gans
Jifu Ge
Sean Gibney
Catharine Chase
Chao Yang
Ivy Rosales
Kazunobu Shinoda
Benjamin Drew
Lisa Kojima
Paul S. Russell
Joren C. Madsen
Robert B. Colvin
Alessandro Alessandrini
References
- 1.Russell P, Chase C, Colvin R, Plate J. Kidney transplants in mice. An analysis of the immune status of mice bearing long-term, H-2 incompatible transplants. The Journal of Experimental Medicine 1978;147:1449–68. [DOI] [PMC free article] [PubMed] [Google Scholar]
- 2.Miyajima M, Chase CM, Alessandrini A, et al. Early Acceptance of Renal Allografts in Mice Is Dependent on Foxp3 <sup>+</sup> Cells. The American journal of pathology 2011;178:1635–45. [DOI] [PMC free article] [PubMed] [Google Scholar]
- 3.Rogers NM, Isenberg JS, Thomson AW. Plasmacytoid dendritic cells: no longer an enigma and now key to transplant tolerance? American journal of transplantation : official journal of the American Society of Transplantation and the American Society of Transplant Surgeons 2013;13:1125–33. [DOI] [PMC free article] [PubMed] [Google Scholar]
- 4.Hadeiba H, Sato T, Habtezion A, Oderup C, Pan J, Butcher EC. CCR9 expression defines tolerogenic plasmacytoid dendritic cells able to suppress acute graft-versus-host disease. Nature immunology 2008;9:1253–60. [DOI] [PMC free article] [PubMed] [Google Scholar]
- 5.Ochando JC, Homma C, Yang Y, et al. Alloantigen-presenting plasmacytoid dendritic cells mediate tolerance to vascularized grafts. Nature immunology 2006;7:652–62. [DOI] [PubMed] [Google Scholar]
- 6.Martin-Gayo E, Sierra-Filardi E, Corbi AL, Toribio ML. Plasmacytoid dendritic cells resident in human thymus drive natural Treg cell development. Blood 2010;115:5366–75. [DOI] [PubMed] [Google Scholar]
- 7.Hadeiba H, Butcher EC. Thymus-homing dendritic cells in central tolerance. European Journal of Immunology 2013;43:1425–9. [DOI] [PMC free article] [PubMed] [Google Scholar]
- 8.Zhang J, Raper A, Sugita N, et al. Characterization of Siglec-H as a novel endocytic receptor expressed on murine plasmacytoid dendritic cell precursors. Blood 2006;107:3600–8. [DOI] [PubMed] [Google Scholar]
- 9.Loschko J, Heink S, Hackl D, et al. Antigen targeting to plasmacytoid dendritic cells via Siglec-H inhibits Th cell-dependent autoimmunity. J Immunol 2011;187:6346–56. [DOI] [PubMed] [Google Scholar]
- 10.Corry R, Winn H, Russell P. Primarily Vascularized Allografts of Hearts in Mice: the Role of H-2D, H-2K, and Non-H-2 Antigens in Rejection. Transplantation 1973;16:343–50. [DOI] [PubMed] [Google Scholar]
- 11.Li MO, Rudensky AY. T cell receptor signalling in the control of regulatory T cell differentiation and function. Nat Rev Immunol 2016;16:220–33. [DOI] [PMC free article] [PubMed] [Google Scholar]
- 12.Joshi RP, Schmidt AM, Das J, et al. The zeta isoform of diacylglycerol kinase plays a predominant role in regulatory T cell development and TCR-mediated ras signaling. Sci Signal 2013;6:ra102. [DOI] [PMC free article] [PubMed] [Google Scholar]
- 13.Schmidt AM, Zou T, Joshi RP, et al. Diacylglycerol kinase zeta limits the generation of natural regulatory T cells. Sci Signal 2013;6:ra101. [DOI] [PMC free article] [PubMed] [Google Scholar]
- 14.Long M, Park SG, Strickland I, Hayden MS, Ghosh S. Nuclear factor-kappaB modulates regulatory T cell development by directly regulating expression of Foxp3 transcription factor. Immunity 2009;31:921–31. [DOI] [PubMed] [Google Scholar]
- 15.Francisco LM, Salinas VH, Brown KE, et al. PD-L1 regulates the development, maintenance, and function of induced regulatory T cells. J Exp Med 2009;206:3015–29. [DOI] [PMC free article] [PubMed] [Google Scholar]
- 16.Haxhinasto S, Mathis D, Benoist C. The AKT-mTOR axis regulates de novo differentiation of CD4+Foxp3+ cells. J Exp Med 2008;205:565–74. [DOI] [PMC free article] [PubMed] [Google Scholar]
- 17.Sauer S, Bruno L, Hertweck A, et al. T cell receptor signaling controls Foxp3 expression via PI3K, Akt, and mTOR. Proc Natl Acad Sci U S A 2008;105:7797–802. [DOI] [PMC free article] [PubMed] [Google Scholar]
- 18.Ezzelarab MB, Zahorchak AF, Lu L, et al. Regulatory Dendritic Cell Infusion Prolongs Kidney Allograft Survival in Nonhuman Primates. American Journal of Transplantation 2013;13:1989–2005. [DOI] [PMC free article] [PubMed] [Google Scholar]
- 19.Švajger U, Rožman P. Tolerogenic dendritic cells: molecular and cellular mechanisms in transplantation. Journal of Leukocyte Biology 2014;95:53–69. [DOI] [PubMed] [Google Scholar]
- 20.Sakaguchi S Naturally arising Foxp3-expressing CD25+ CD4+ regulatory T cells in immunological tolerance to self and non-self. Nature immunology 2005;6:345–52. [DOI] [PubMed] [Google Scholar]
- 21.Sakaguchi S, Yamaguchi T, Nomura T, Ono M. Regulatory T cells and immune tolerance. Cell 2008;133:775–87. [DOI] [PubMed] [Google Scholar]
- 22.Walsh PT, Taylor DK, Turka LA. Tregs and transplantation tolerance. Journal of Clinical Investigation 2004;114:1398–403. [DOI] [PMC free article] [PubMed] [Google Scholar]
- 23.Gehrie E, Van der Touw W, Bromberg JS, Ochando JC. Plasmacytoid dendritic cells in tolerance. Methods Mol Biol 2011;677:127–47. [DOI] [PMC free article] [PubMed] [Google Scholar]
- 24.Bickerstaff AA, Wang J-J, Pelletier RP, Orosz CG. The graft helps to define the character of the alloimmune response. Transplant Immunology 2002;9:137–41. [DOI] [PubMed] [Google Scholar]
- 25.Zheng D, Cao Q, Lee VWS, et al. Lipopolysaccharide-pretreated plasmacytoid dendritic cells ameliorate experimental chronic kidney disease. Kidney Int 2012;81:892–902. [DOI] [PMC free article] [PubMed] [Google Scholar]
- 26.Moseman EA, Liang X, Dawson AJ, et al. Human Plasmacytoid Dendritic Cells Activated by CpG Oligodeoxynucleotides Induce the Generation of CD4+CD25+ Regulatory T Cells. The Journal of Immunology 2004;173:4433–42. [DOI] [PubMed] [Google Scholar]
- 27.Chen W, Liang X, Peterson AJ, Munn DH, Blazar BR. The Indoleamine 2,3-Dioxygenase Pathway Is Essential for Human Plasmacytoid Dendritic Cell-Induced Adaptive T Regulatory Cell Generation. The Journal of Immunology 2008;181:5396–404. [DOI] [PMC free article] [PubMed] [Google Scholar]
- 28.Sharma MD, Baban B, Chandler P, et al. Plasmacytoid dendritic cells from mouse tumor-draining lymph nodes directly activate mature Tregs via indoleamine 2, 3-dioxygenase. Journal of Clinical Investigation 2007;117:2570–82. [DOI] [PMC free article] [PubMed] [Google Scholar]
- 29.Manches O, Munn D, Fallahi A, et al. HIV-activated human plasmacytoid DCs induce Tregs through an indoleamine 2, 3-dioxygenase–dependent mechanism. The Journal of clinical investigation 2008;118:3431. [DOI] [PMC free article] [PubMed] [Google Scholar]
- 30.Cook CH, Bickerstaff AA, Wang J-J, et al. Spontaneous Renal Allograft Acceptance Associated with “Regulatory” Dendritic Cells and IDO. The Journal of Immunology 2008;180:3103–12. [DOI] [PMC free article] [PubMed] [Google Scholar]
- 31.Conrad C, Gregorio J, Wang Y-H, et al. Plasmacytoid dendritic cells promote immunosuppression in ovarian cancer via ICOS costimulation of Foxp3+ T-regulatory cells. Cancer research 2012;72:5240–9. [DOI] [PMC free article] [PubMed] [Google Scholar]