

Abstract
One of the most important and early impairments in autism spectrum disorder (ASD) is the abnormal visual processing of human faces. This deficit has been associated with hypoactivation of the fusiform face area (FFA), one of the main hubs of the face-processing network. Neurofeedback based on real-time fMRI (rtfMRI-NF) is a technique that allows the self-regulation of circumscribed brain regions, leading to specific neural modulation and behavioral changes. The aim of the present study was to train participants with ASD to achieve up-regulation of the FFA using rtfMRI-NF, to investigate the neural effects of FFA up-regulation in ASD. For this purpose, three groups of volunteers with normal I.Q. and fluent language were recruited to participate in a rtfMRI-NF protocol of eight training runs in 2 days. Five subjects with ASD participated as part of the experimental group and received contingent feedback to up-regulate bilateral FFA. Two control groups, each one with three participants with typical development (TD), underwent the same protocol: one group with contingent feedback and the other with sham feedback. Whole-brain and functional connectivity analysis using each fusiform gyrus as independent seeds were carried out. The results show that individuals with TD and ASD can achieve FFA up-regulation with contingent feedback. RtfMRI-NF in ASD produced more numerous and stronger short-range connections among brain areas of the ventral visual stream and an absence of the long-range connections to insula and inferior frontal gyrus, as observed in TD subjects. Recruitment of inferior frontal gyrus was observed in both groups during FAA up-regulation. However, insula and caudate nucleus were only recruited in subjects with TD. These results could be explained from a neurodevelopment perspective as a lack of the normal specialization of visual processing areas, and a compensatory mechanism to process visual information of faces. RtfMRI-NF emerges as a potential tool to study visual processing network in ASD, and to explore its clinical potential.
Keywords: autism spectrum disorder (ASD), real-time fMRI, neurofeedback, fusiform face area (FFA), facial processing, brain–computer interfaces, neural modulation
Introduction
Autism spectrum disorder is a chronic, burdensome (Howlin et al., 2004; Weiss and Lunsky, 2011; Beecham, 2014), highly prevalent neurodevelopmental condition (Kim et al., 2011; Fisch, 2012), and strongly associated with medical and psychiatric comorbidities (Lai et al., 2014). The presentation of ASD is heterogeneous, but is defined by certain clinical characteristics: (1) persistent deficits in communication and social reciprocity, and (2) patterns of repetitive and restrictive behaviors activities and interests, as well as sensorial integration disturbances that are of clinical significance (American Psychiatric Association, 2013). The social, adaptive and mental health prognosis improves with earlier diagnosis and treatment (Fernell et al., 2013). However, there is a subgroup of patients with ASD (patients with fluent language and normal or above normal cognitive capabilities) whose diagnosis usually occurs during late childhood, adolescence, or even in adulthood (Mandell et al., 2005). A better understanding of the neural substrates underlying the core ASD symptoms could help the development of biologically based diagnostic tools to assist clinicians with this challenge (Lai et al., 2014; Varcin and Nelson, 2016).
One of the most important and early impairments in ASD is the abnormal visual processing of human faces (Baron-Cohen et al., 2001a; Calder et al., 2002; Weigelt et al., 2012; Klin et al., 2015). This deficit has been associated with a lack of the typical attentional bias toward social stimuli – mainly faces – that is observed in people with TD from early childhood and throughout life (Dawson et al., 2005; Simion and Giorgio, 2015). There is a deficit in processing visual information emanating from faces (Golarai et al., 2006). This lack of the typical specialization may be compensated by a slower and more cognitively demanding mechanism in ASD individuals with normal or above normal cognitive abilities (Neumann et al., 2006; Clark et al., 2008; Santos et al., 2008; Weigelt et al., 2012; Livingston and Happé, 2017). However, rapid facial processing is necessary for the development of more complex socially relevant cognitive functions (García-Villamisar et al., 2010), such as inter-subjectivity (Yirmiya et al., 1992), pragmatic communication (Mundy et al., 1992) or Theory of Mind (Rogers and Bennetto, 2000; Baron-Cohen et al., 2001a; Calder et al., 2002). All these aspects are usually affected in ASD.
From a neurobiological point of view, progressive structural and functional neural specialization emerges during the visual experience of faces as an important part of typical development (Johnson et al., 2005; Frith, 2007; Adolphs, 2009). This process is characterized by right lateralization (Meng et al., 2012), global integration (Mišić et al., 2014), and local specialization of certain brain areas involved in processing the static, dynamic, emotional and contextual information associated with the visualization of faces (Haxby and Gobbini, 2010). The lateral area of the FG, known as the FFA is considered a critical cortical node for face processing (Ganel et al., 2005; Jiang et al., 2013; Huang et al., 2014) and its hypoactivation is the most consistent finding in research on face processing deficits in ASD (Nickl-Jockschat et al., 2014). Despite the great advances in the description of the cerebral functioning that underlies the deficit of nuclear symptoms of ASD, it has been difficult to translate these findings into useful tools for use both for the diagnostic process in complex clinical settings (e.g., ASD diagnosis on individuals with fluid language and normal IQ) and for new biologically based therapeutic approaches to support the usual current treatment approaches. Therefore, new neuroscientific approaches are needed. Neurofeedback based on real-time fMRI (rtfMRI-NF) is a closed-loop system in which the Blood Oxygenation Level Dependent (BOLD) signal from selected brain regions can be translated to an artificial output that gives contingent information in real-time to the subjects about their brain activity (Shih et al., 2012; Sulzer et al., 2013). RtfMRI-NF has allowed healthy individuals as well as neurological and psychiatric patients to achieve self-regulation of circumscribed brain regions (e.g., Insula, Amygdala, Supplementary Motor Area, FFA), leading to specific neurobiological and behavioral changes (Caria et al., 2007; Zotev et al., 2011; Habes et al., 2016; Paret et al., 2016; Sepulveda et al., 2016). This methodology has been used as a powerful tool to study addiction, schizophrenia, obsessive-compulsive disorder, depression and other brain disorders (Weiskopf et al., 2004; Sitaram et al., 2007, 2017; Weiskopf, 2012; Birbaumer et al., 2013; Ruiz et al., 2014).
The present study is the first one to use rtfMRI-NF for the endogenous neuromodulation of one of the main hubs of face processing, i.e., FFA in autism. In this study, our first aim is to investigate the feasibility of training FFA up-regulation by means of fMRI-NF in people with ASD and to compare this capability with subjects with TD. The neural consequences of FFA up-regulation in both groups will be explored by whole-brain analysis and functional connectivity analysis using both FG as independent seed. In addition to the above aim, the relation between clinical measures and face processing performance (i.e., accuracy of face identity recognition and face emotion recognition) with up-regulation capability will be explored.
Materials and Methods
Participants
Eleven male, right-handed volunteers, naïve to real-time fMRI experiments, underwent eight rtfMRI-NF training runs for volitional control of both FFAs. To evaluate the neural effects of this training in TD, six right-handed adult males with TD (i.e., without a clinical history of neurological, psychiatric nor neurodevelopmental disorders nor intellectual disability), and without autistic traits [i.e., negative family history of ASD, scores below 15 in the Social Communication Questionnaire (Rutter et al., 2003), and with Autism Spectrum Quotient (Baron-Cohen et al., 2001b)] below 32 were randomly distributed in two groups (Table 1). Those in the first control group (CG1) participated in a rtfMRI-NF training protocol with contingent information from the FFAs as feedback. The other three individuals participated in a similar protocol, but with non-contingent (sham) feedback (CG2sham).
TABLE 1.
Demographical information of participants.
| AG | CG1 | CG2sham | |||||||
| M | SD | Range | M | SD | Range | M | SD | Range | |
| AGE (years) | 16.52 | 2.05 | 14.13–19.50 | 29.42 | 4.02 | 25.67–33.67 | 35.21 | 5.24 | 29.33–39.38 |
| AQ (score) | 28.80 | 5.81 | 22–34 | 9.67 | 6.81 | 2–15 | 9.67 | 4.17 | 5–13 |
| SCQ (score) | 21.80 | 1.92 | 19–24 | 8.33 | 5.13 | 4–14 | 6.33 | 3.05 | 3–9 |
SCQ, Social Communication Questionnaire; AQ, Autism Spectrum Quotient.
In a second instance, in order to evaluate the feasibility of this methodology in ASD and its neural effects, five participants with ASD with fluent speech and without intellectual disability participated in a rtfMRI-NF training protocol similar to that carried out by the group CG1. These five participants constituted the “autism group” (AG). Participants in AG were evaluated with a complete clinical battery of tests to establish their clinical profiles and to evaluate if clinical characteristics could predict their performance in the up-regulation of the FFA. Their I. Q. was evaluated with the FIX test, an abbreviated test standardized for the local population that correlates closely with the Wechsler Scale of Intelligence, 4th version (Rosas et al., 2014; Riveros et al., 2015). The ASD diagnosis was made by two independent psychiatrists, based on the DSM 5 criteria (American Psychiatric Association, 2013) and confirmed by two standardized instruments, considered to be gold standard for diagnostic evaluation [the Autism Diagnostic Observational Schedule, ADOS-2 (Lord et al., 2000, 2012), and the ADI-R (Kim et al., 2013)]. The Vineland Adaptive Behavior Scale, second edition (Klin et al., 2007) was used to assess adaptive behavior and social abilities not evaluated in ADOS-2 (Klin et al., 2007) or ADI-R (Lecavalier et al., 2006) (Tables 1, 2).
TABLE 2.
Clinical information about AG.
| M | SD | Range | |
| FIX∗ | 68.60 | 14.93 | 49–91 |
| ADOS-2 subscales∗∗ | |||
| Communication (C) | 4.00 | 1.22 | 3–6 |
| Social reciprocity (S) | 5.80 | 0.84 | 5–7 |
| Total (C + S) | 9.80 | 1.92 | 8–13 |
| ADI-R subscales | |||
| Social | 19.00 | 3.74 | 13–22 |
| Communication | 13.00 | 3.74 | 8–18 |
| Repetitive behavior | 6.80 | 2.77 | 4–11 |
| Vineland Scale ∗∗∗ | |||
| Chronological Age | 17.76 | 2.00 | 15.75–20.5 |
| Social Age | 15.66 | 2.45 | 11.70–17.8 |
| Social Quotient | 0.88 | 0.12 | 0.72–1 |
ADOS-2, Autism Diagnostic Observational Schedule second version; ADI-R, Diagnostic Interview Revised; Vineland Scale, Vineland Adaptive Behavior scale, second edition. ∗FIX as a percentile for local population (normalized by age); ∗∗ADOS-2, module 4 algorithm. ∗∗∗Chronological age at Vineland scale performed time.
Exclusion criteria for all study participants included contraindications for participation in an MRI measurement. After giving a complete description of the study to the participants and to the parents of the adolescents, written informed consent and assent (required in the case of adolescent participants) were obtained. The experimental protocol was approved by the ethics committee of the Pontificia Universidad Católica de Chile.
Evaluation of Face Processing
To evaluate the relationship between different aspects of facial processing and FFA up-regulation, four tasks were included at the beginning of the first day of rtfMRI-NF training outside the scanner. First, to evaluate memory of faces, the Cambridge Facial Memory Test (CFMT) (Wilson et al., 2010; Hedley et al., 2011) was applied, along with its counterpart, the CCMT (Dennett et al., 2012). Second, to evaluate Theory of Mind and recognition of complex emotions from the eyes, the Reading the Mind in the Eyes task, revised version of “the Eyes task” (Baron-Cohen et al., 2001a) was used. In addition, two tasks were included to evaluate early visual processing of faces, reducing reliance on higher-level cognitive skills: a 4-Alternative Forced Choice task to evaluate the ability to recognize faces (“FIR” task), and a 5-Alternative Forced choice task for the recognition of facial expression of basic emotions (“FER” task). FIR and FER tasks were composed of 32 trials of identical temporal organization (320 s for each task), screened on a 13.3-in. LCD-monitor (Resolution: 1366 × 768; Frame Rate 60 Hz; Viewing distance: 50 cm. app.; PresentationVR 17.1 software, Neurobehavioral Systems, United States). See Supplementary Box for a complete description.
Real-Time fMRI Training
All subjects participated in 2 days of rtfMRI-NF sessions, with 1 or 2 days of separation between sessions. Each training session began with one localizer run (lasting 4.15 min) to bilaterally localize the FFA to be used as the region of interest (ROI1) from where the BOLD activity was extracted for the next four training runs (each lasting 3.75 min). An anatomical T1 image was acquired at the end of each training day.
Functional Localizer
The functional localizer consisted of a block-based paradigm to contrast neutral faces and houses in order to localize left and right FFA (ROI1) (Tong et al., 2000). Four blocks of faces and three blocks of houses were alternating with each other and separated by 21 s of rest between two consecutive blocks (166 volumes; 4.15 min). Each block of houses and faces were composed of 40 images obtained from a pool of 60 images of houses without background and from 60 images of neutral faces obtained from the Karolinska Directed Emotional Faces database (Goeleven et al., 2008) respectively. Each image was presented for 650 milliseconds and separated by 100 milliseconds (black screen) from the next image. A black screen with a white cross in the middle was used for the rest blocks.
The software Turbo Brain Voyager 3.0 (Brain Innovations, Netherlands) was used to select the brain areas of interest that were incorporated into the feedback calculation of the training runs. Feedback information was obtained from ROI1, specifically from the voxels with the greatest activation (Faces > Houses) within the ventral part of each temporal lobe, lateral to the parahippocampal cortices (two cuts of around 5 × 3 voxels each). To cancel the effects of global activation, a transversal slide (9 × 3 voxels) positioned in advance of the third ventricle was used as reference (ROI2).
The Real-Time fMRI System
An fMRI-NF system similar to those used in previous studies was implemented (Weiskopf et al., 2004; Sitaram et al., 2007; Weiskopf, 2012; Ruiz et al., 2014) (Figure 1). At the beginning of each measurement, participants were positioned in the scanner and reference scans were acquired. Later, using a gradient echo-planar imaging (EPI) sequence (see MR acquisition), functional brain volumes were generated. During image acquisition, brain volumes were transferred in real-time directly from the scanner’s image reconstruction system using the Direct Reconstructor Interface application (Philips Healthcare, Best, Netherlands) to an external computer to analyze it in real-time (Sitaram et al., 2011). A standard personal computer running Turbo Brain Voyager software read the incoming brain volumes to perform real-time 3D motion correction and statistical analysis (Weiskopf et al., 2003). Turbo Brain Voyager parameters were set to match parameters of the EPI acquisition and to obtain the BOLD signal coming from the ROIs at each repetition time (TR: 1.5 s). Custom MATLAB scripts used the signals from the ROIs to compute the feedback by comparing blocks of up-regulation and baseline (Equation 1). The feedback output was stored in a shared text file in the Turbo Brain Voyager computer, which was accessed from the personal computer with PresentationVR 17.1 software (Neurobehavioral Systems, United States). Presentation software read the feedback output file continuously and updated the feedback on the screen at an interval of 1.5 s. The feedback was presented in the form of thermometer bars in an MR compatible visual display system (NordicNeuroLab AS, Norway) (Figure 1).
FIGURE 1.

Schematic of the rtfMRI-NF components. RtfMRI-NFs are based on a circular re-entry system in which the BOLD signals of the participants are translated into artificial outputs, i.e., visual contingent feedback such as thermometer with moving bars (refresh time of 1.5 s). It is compound by four main components: (1) the participants, (2) brain signal acquisition unit, (3) signal analysis unit, and (4) feedback unit.
Training Runs and Feedback Calculation
Each participant went through two training sessions. Each training session consisted of four training runs. Each training run started with 10 dummy scans (duration of 15 s) at the beginning of the run to reach the T1 steady state, followed by 4 baseline blocks and 3 up-regulation blocks (each block of 30 s). The dummy scans were later discarded from the analysis. The total duration of training runs was 3 min 45 s. During up-regulation blocks, participants of AG and CG1 groups received contingent visual feedback from their FFAs. Feedback (F) was calculated as:
| (1) |
Where BOLDUpreg is the average BOLD signal of a moving window of the last three scans of the up-regulation block, and BOLDBase is the average BOLD signal of the preceding baseline block. ROI 1 represented bilateral FFAs selected during the Localizer Run, and ROI 2 was the brain area anterior to the third ventricle which was selected to cancel the effects of global brain activation. Signal artifacts (due to head movement or swallowing) was corrected by replacing any abrupt increases in the BOLD signal by the mean BOLD signal from the preceding time points. Participants of CG2sham were also provided with thermometer feedback but without contingent information, i.e., “sham” feedback (i.e., pseudorandom movement of the thermometer bars).
All participants were instructed to observe the thermometer and to increase the bars. Participants were informed that the movement of the thermometer bars was contingent on the activity of a brain area related to the visual processing of faces. They were also instructed about the 4–6 s delay in the movement of the bar (due to slow hemodynamic response as well as to restrictions imposed by data acquisition and processing). During baseline blocks, a thermometer with stationary bars in the center of the screen was provided to participants, and they were asked to remain at rest (with open eyes) in order to return the BOLD signal to the baseline level.
MR Acquisition
The rtfMRI-NF system was implemented using a Philips Achieva 1.5T MR scanner (Philips Healthcare, Best, Netherlands) at the Biomedical Imaging Center of the Pontificia Universidad Católica de Chile. A standard 8-channel head coil was used. For functional image acquisition, we used the Fast Field Echo EPI sequence (TR/TE = 1500/45 ms, matrix size = 64 × 64, flip angle α = 70°, FOV: RL = 210 mm, AP = 210 mm, FH = 79 mm). Sixteen slices (voxel size = 3.2 × 3.3 × 4 mm3, gap = 1 mm) were used, oriented with AC/PC alignment to cover the entire temporal and most of the frontal and parietal lobes (Supplementary Figure 1). 150 and 166 scans (10 dummy scans for each one) were performed in each training and functional localizer run respectively. For the superimposition of functional maps on brain anatomy, anatomical T1-weighted brain volumes were acquired, using T1W-3D Turbo Field Echo (magnetization-prepared gradient-echo also known as MPRAGE) sequence (TR/TE = 7.4/3.4 ms, matrix size = 208 × 227, α = 8°, 317 partitions, voxels size = 1.1 × 1.1 × 0.6 mm3, TI = 868.7 ms). To prevent discomfort during MRI sessions, pads and air cushions were used to secure the head. Relatives of the ASD participants had the opportunity to accompany the researcher and follow the MRI sessions.
Offline Brain Imaging Analysis
Preprocessing
For brain imaging and ROI analysis, spatial and temporal pre-processing steps were performed with version eight of the SPM (Wellcome Department of Imaging Neuroscience, London, United Kingdom), using 140 functional volumes. The first 10 volumes were discarded to ensure steady-state. Preprocessing included motion correction, realignment, and slice-timing correction. Functional EPI images were co-registered with the acquired T1-weighted image and normalized to Montreal Neurological Institute coordinates. In addition, functional volumes were smoothed with a Gaussian kernel of Full-Width Half Maximum of 8 × 8 × 8 mm.
FFA Up-Regulation Calculation
The smoothed and normalized brain volumes were used to evaluate the up-regulation of the BOLD signal separately in the left and right FFAs. The ROI analysis was performed using a sphere of 5 mm3 obtained from the left and right parts of ROI1 of each participant (Supplementary Table 1). The magnitude of the left and right FFA (rFFA) up-regulation was calculated using the mean BOLD values of regulation and baseline blocks of each run per participant as a percentage as follows:
| (2) |
Where BOLDUpreg and BOLDBas represent vectors whose values are extracted from the time-series of regulation and baseline (no feedback) blocks of each training run. The average value of the rFFA during each training session was used as the main measurement of up-regulation performance (one-sample t-test compared to zero, p two-tailed, 95% confidence). We verified the normality of the data using the D’Agostino and Pearson (omnibus k2) test, and non-parametric tests were used when appropriate.
The “training effect” on up-regulation performance was assessed for each group using two approaches. The difference between the mean rFFA of training session 2 and of training session 1 (ΔrFFA) was calculated for each subject and then compared against zero by group (one-sample Wilcoxon Signed Rank Test compared with zero, p two-tailed, 95% confidence). Second, the slope of the group average of rFFA through the runs, i.e., the “learning slope” of up-regulation was calculated for left and right FFAs (Spearman correlation coefficient, p two-tailed, 95% confidence).
Variability in FFA Up-Regulation
Given that the variability of the BOLD signal has been associated with neural flexibility and specialization of some brain areas (Nomi et al., 2017), the variability to up-regulate left and right FFAs [as standard deviation (SD) of the BOLD magnitude on each run] was evaluated in the three groups. First, the SD of the rFFA values (SD-rFFA) were calculated, and a group comparison (considering all training runs) was carried out for left and right FFA separately (Kruskal–Wallis test, with Dunn’s multiple comparison test as a post hoc analysis). Second, the training effect on SD-rFFA values was evaluated for each group, using two approaches. First, the difference between the mean SD-rFFA of session 2 and the mean SD-rFFA of session 1 was calculated for each subject (ΔSD-rFFA) and then compared against zero by group (one-sample Wilcoxon Signed Rank Test compared to zero, p two-tailed, p < 0.05). Second, the slope of the group average of SD-rFFA through the 8 runs or “learning slope” of the variability was calculated for left and right FFA separately (Spearman correlation coefficient, p two-tailed, 95% confidence).
Functional Analysis of the Brain and FFA Up-Regulation
The whole-brain activations and the functional connectivity profile of each FG during FFA up-regulation with rtfMRI-NF were evaluated to obtain a better understanding of the neural networks associated with up-regulation of FFA in ASD.
Whole-Brain Analysis
A whole functional brain analysis using all the preprocessed functional images was carried out to evaluate neural activations during the FFA up-regulation guided by the rtfMRI-NF training. A first-level analysis was performed with the SPM. General Linear Modeling was defined considering Regulation and Rest blocks as two independent conditions to map the brain regions recruited. In addition, six generated motion confounds were added to the model and convolution of the regressor with the canonical hemodynamic response function was carried out. A second-level analysis was performed with SPM considering the contrast between regulation blocks and rest blocks (contrast = [Regulation > Rest]) to evaluate specific activations resulting from up-regulation training in each group (one-sample t-test per group, P < 0.001 and FWE P < 0.05; K = 10). For the visualization of the brain activations, anatomical automatic labeling or AAL atlas (Tzourio-Mazoyer et al., 2002) and XjView toolbox1 were used.
Functional Connectivity Analysis
To investigate the network changes during up-regulation, a functional connectivity analysis was carried out. For this purpose, a linear relationship between BOLD activity of different brain regions (AAL atlas) inside of the field of view (Whole brain without the cerebellum and the upper middle part of both parietal and frontal lobes, Supplementary Figure 1) was computed from their correlation coefficients (Friston, 2011) using the CONN toolbox (Whitfield-Gabrieli and Nieto-Castanon, 2012) with left and right FG as the seed regions. FG was chosen as seed given the wide interindividual variability of FFA reported in ASD (Scherf et al., 2010) and replicated in this study (Supplementary Table 1). We used FG as the seed as it encloses our ROI (FFA) due to its greater spatial extent and hence would give us the possibility of making an anatomical and functional comparison between the groups.
Pre-processing consisted of denoising, bandpass-filtering (0.008–0.09 Hz), the inclusion of estimated head motion parameters, use of white matter and cerebrospinal fluid as covariates, linear detrending, and despiking. Bivariate correlations between different brain regions were calculated for regulation blocks taking left and right FGs as seed regions separately. The correlation coefficients between each pair of regions (seed-target) were considered as independent measurement values as follows (Whitfield-Gabrieli and Nieto-Castanon, 2012):
| (3) |
Where x and y are vectors of the BOLD time-series for seed ROI and target ROI respectively. To assess similarities and differences of functional connectivity among the participants of different groups, mean pairwise correlation coefficients of functional connectivity (mean zFC values) through all training runs were considered. Results are reported for all significant connections [threshold P-FDR (seed corrected) < 0.01, one-sided (positive)] and a group description by lobe is presented.
Group differences in connection strength (mean zFC values) of left and right FGs were evaluated for all brain areas and for the ventral visual stream (i.e., brain areas of the occipital lobe, lingual cortex, FG, parahippocampal cortex, inferior temporal gyrus and ventral area of the temporal pole) (Kravitz et al., 2013; Collins and Olson, 2014) using all significant connections. Such analysis was carried out due: First, based on the importance of the ventral visual stream for specialized visual processing (Kravitz et al., 2013), in particular of faces (Collins and Olson, 2014). Second, due to the particular connection profile described for ASD namely that there are stronger short-range and weaker long-range functional connections (Barttfeld et al., 2011). In particular, higher values of local functional connectivity (Keown et al., 2013), regional activity coherence (Paakki et al., 2010) and degree of centrality (Di Martino et al., 2013) have been found between brain areas of the ventral visual stream in ASD. Both group analyses were performed by one-way ANOVA and the Kruskal–Wallis test, using Tukey’s and Dunn’s multiple comparisons test, respectively, for post hoc analysis. All data were checked for normality using D’Agostino and Pearson (omnibus k2) test, and non-parametric tests were used when appropriate. For the visualization, the thickness of the lines connecting the ROIs was represented proportionally to the magnitude of t values.
Autism Spectrum Disorder and Up-Regulation Performance
To evaluate if clinical aspects such as chronological age, IQ, Social Age of Vineland scale, ADOS-2 and ADI-R scores or some aspects of the facial processing performance (i.e., accuracy of FER, FIR, CFMT and Eye-Task and reaction-time of CFMT) are associated with FFA up-regulation performance in subjects with ASD, correlations between these clinical data and rFFA of all training runs were calculated (Spearman correlation coefficient, p two-tailed, 95% confidence).
Results
Clinical and Facial Processing Profile of Participants
Initially, six participants with ASD were recruited for the study. However, one ASD participant declined to participate in the training due to hearing and tactile discomfort in the scanner. Participants with TD participated in both training days without any sensorial inconvenience. A demographic and clinical summary of the participants can be seen in Tables 1, 2. Although there were no significant group differences in the accuracy achieved in the visual processing tasks (Table 3), participants with TD (the participants in CG1 + CG2sham) showed a faster reaction time in the standardized face memory task (CFMT) compared to the non-social memory task (CCMT) (CFMT Mdn = 3291; CCMT Mdn = 5054; U = 5, p = 0.0411, Mann–Whitney U test). Participants with ASD showed no such difference (CFMT Mdn = 4436; CCMT Mdn = 4762, U = 7, p = 0.310, Mann–Whitney U test).
TABLE 3.
Facial processing performance on participants with ASD (AG) and with typical development (participants of CG1 and CG2sham groups).
| AG | CG1 + CG2sham | ||
| Task | Mdn. | Mdn. | Statistics |
| FER task | |||
| Accuracy | (0.781) | (0.719) | U = 12,p = 0.658 |
| FIR task | |||
| Accuracy | (0.781) | (0.750) | U = 9.5, p = 0.342 |
| CFMT | |||
| Accuracy | (0.667) | (0.688) | U = 13, p = 0.792 |
| Reaction Time (msec.) | (4436) | (3291) | U = 7, p = 0.178 |
| CCMT | |||
| Accuracy | (0.736) | (0.757) | U = 13.5, p = 0.833 |
| Reaction Time (msec.) | (4762) | (5054) | U = 13, p = 0.792 |
| The Eyes task | |||
| Accuracy | (0.780) | (0.720) | U = 9.5, p = 0.366 |
Training Sessions
All participants underwent eight training runs in two training sessions. Two runs of one participant with ASD had to be discarded from the analysis, as the participant moved his head significantly during the first training run and reported after completing the run that he was using head and eye movements as a strategy to control the thermometer bars. Furthermore, there was a communication loss between the computers due to a temporary hardware problem. In total, 94 training runs (13160 functional images) were used in the analysis.
FFA Up-Regulation Magnitude
Both AG and CG1 were able to up-regulate left and right FFAs during all training [left FFA: AG: Mdn = 0.277, W = 655, p < 0.001; CG1: Mdn = 0.2058, W = 292, p < 0.001, one-sample Wilcoxon Signed Rank Test compared to zero/right FFA: AG: M = 0.286, t(37) = 7.55, p < 0.001; CG1: M = 0.191, t(23) = 8.10, p < 0.001, one-sample t-test, compared to zero]. Moreover, the performance of these groups to up-regulate left and right FFA was significantly high in training session 1 [AG: left FFA: M = 0.287, t(18) = 3.48, p = 0.003; right FFA, Day1: M = 0.261, t(18) = 5.343, p < 0.001/CG1: left FFA: Mdn = 0.226, W = 76, p < 0.001; right FFA: M = 0.244, t(11) = 7.114, p < 0.001] and training session 2 [AG: left FFA: Mdn = 0.3546, W = 188, p < 0.001; right FFA: M = 0.311, t(18) = 5.297, p < 0.001/CG1: left FFA: M = 0.185, t(11) = 5.294, p < 0.001; right FFA: M = 0.139, t(11) = 5.406, p < 0.001]. In contrast, participants of CG2sham failed to achieve up-regulation in either left or right FFA when both training sessions were taken together (left FFA: Mdn = −0.1417, W = −106, p = 0.136), or separately [Session 1: left FFA: M = −0.131, t(11) = 1.553, p = 0.149; right FFA: Day1: M = −0.0349, t(11) = 0.394, p = 0.701/Session 2: left FFA: Mdn = −0.1246, W = −22, p = 0.424; right FFA: M = −0.0294, t(11) = 0.240, p = 0.814] (Figure 2).
FIGURE 2.

Up-regulation performance (rFFA) by group on left and right FFA (∗∗p < 0.01, ∗∗∗p < 0.001).
Differences between the up-regulation performance of the groups were found on left FFA [H(2)23.35, p < 0.001, Kruskal–Wallis test] and right FFA [F(2,83) = 11,69, p < 0.001, one-way ANOVA]. The post hoc analysis for left FFA and right FFA showed better performance in the up-regulation of left and right FFAs in AG and CG1 than in CG2sham (left FFA: AG vs. CG2sham: p < 0.001; CG1 vs. CG2sham: p = 0.002/right FFA: AG vs. CG2sham: p < 0.001; CG1 vs. CG2sham: p = 0.008). On the other hand, no differences were found between AG and CG1 (left FFA: p > 0.999; right FFA: p = 0.332) (Figure 2).
FFA Up-Regulation Learning Process
Up-regulation learning in left and right FFAs was evaluated using the following two approaches. First, we evaluated the individual difference in rFFA between session 2 and session 1 (ΔrFFA) and these values were then compared against zero for each group. Second, the slope obtained from the group mean rFFA of each run (the “activation learning slope”) was estimated. No differences in up-regulating left or right FFA between sessions was found in any group (AG: left ΔrFFA: Mdn = 0.137, W = 13, p = 0.125; right ΔrFFA: Mdn = 0.0691, W = 9, p = 0.313/CG1: left ΔrFFA: Mdn = 0.108, W = −6, p = 0.250; right ΔrFFA: Mdn = −0.0443, W = −6, p = 0.250/CG2sham: left ΔrFFA: Mdn = −0.0150, W = 0, p > 0.999; right ΔrFFA: Mdn = −0.0302, W = 0, p > 0.999). No significant learning slope was found in any group (AG: left FFA: rs: 0.405, p = 0.327; right FFA: rs = −0.238, p = 0.582/CG1: left FFA: rs = −0.619, p = 0.115; right FFA: rs = −0.476, p = 0.2431/CG2sham: left FFA: rs = −0.333, p = 0.428; right FFA: rs = −0.239, p = 0.977).
FFA Up-Regulation Variability
To evaluate whether real feedback contributes to decrease the variability in ROI activity, the BOLD variability was measured during the eight training runs as described in Section “Variability in FFA Up-Regulation.” Group differences between SD-rFFA were found on right FFA but not on left FFA [right FFA: H(2)10.67, p = 0.005; left FFA: H(2)5.495, p = 0.064]. In a post hoc analysis of the right FFA, less variability was found in CG1 than in CG2sham (p = 0.004). However, no differences between AG and CG1 (p = 0.078), or with CG2sham (p > 0.999), were found (Figure 3).
FIGURE 3.
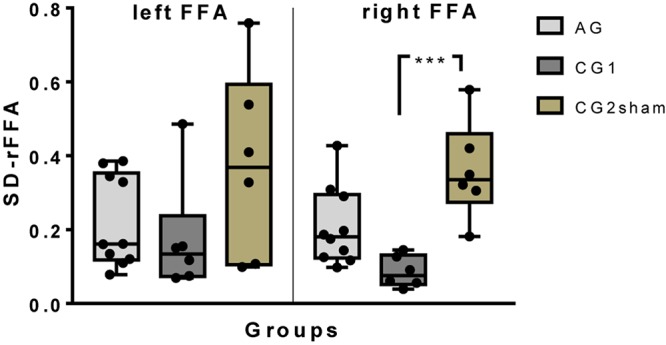
A box-and-whisker plot of the inter-subject variability of up-regulation performance (SD of BOLD magnitude) by group on left and right FFA. All individual results have been plotted (∗∗∗p ≤ 0.001).
Learning Process and Up-Regulation Variability
No differences between ΔSD-rFFA and zero was found for any group (AG: left FFA: Mdn = 0.040, W = 9, p = 0.313, right FFA: Mdn = −0.0885, W = −11, p = 0.188; CG1: left FFA: Mdn = 0.0425, W = 2, p = 0.750, right FFA: Mdn = 0.0663, W = 4, p = 0.50; CG2sham: left FFA: Mdn = −0.211, W = −4, p = 0.50, right FFA: Mdn = −0.140, W = −4, p = 0.50). On analysis of the changes in SD-rFFA during the training runs, a negative correlation between run progression and SD-rFFA was found on left FFA of the CG1 (left FFA: rs = −0.857, p = 0.011; right FFA: rs = 0.095, p = 0.840, ns). No correlation was found between SD-rFFA and run progression on AG or CG2sham (AG: left FFA: rs = −0.024, P = 0.977, ns; right FFA: rs = −0.0714, P = 0.882, ns./CG2sham: left FFA: rs = 0.048, P = 0.935, ns; right FFA: rs = 0, P > 0.999, ns).
Functional Analysis of the Brain and FFA Up-Regulation
Whole Brain Analysis
Activation profiles in each group (contrast = up > rest; one-sample t-test, P < 0.001 and FWE P < 0.05; K = 10) showed clear differences. Although both groups that received contingent feedback (CG1 and AG) showed recruitment of the left FG, left lingual cortex, and left inferior frontal gyrus, recruitment of these brain areas tends to be weaker in AG than in CG1 (Supplementary Table 2). Activations of the right FG, right lingual cortex, right middle temporal gyrus, right inferior frontal gyrus, right insula, and left caudate were found only in CG1. In contrast, bilateral activations of the cerebellum (cerebellum area 6 and vermis area 7) were observed only in AG. The CG2sham group showed activation only in the primary visual cortex (Figure 4). Individual activation maps of the ASD participants are available in the Supplementary Figure 2.
FIGURE 4.

Activation maps of up-regulation of FFAs (Contrast: = up > rest) obtained from whole-brain analysis statistical parametric mapping (SPM) of all runs by group (one-sample t-test, P < 0.001 and FWE P < 0.05; K = 10; neurological convention). Bilateral ventral face of the occipitotemporal cortex and bilateral inferior Frontal gyrus activations were found in CG1. In contrast, the left ventral face of the occipitotemporal cortex and left inferior Frontal gyrus activation was found in AG. The right posterior part of the Middle Temporal Gyrus and left Insula were found only in CG1. In addition, cerebellum activation was only present in AG. CG2sham showed only a bilateral Calcarine cortex activation.
Functional Connectivity Analysis
Functional connectivity analysis to evaluate the neural modulation associated with FFA up-regulation in each group was performed using each FGs as two independent seeds (based on the AAL atlas). First, significant functional connections [threshold P-FDR (seed corrected) < 0.01, one-sided (positive)] between the FG and brain areas inside of the field of view were described by lobe for each group. Second, group differences between the functional connectivity strength (mean zFC values) of all significant connections and of connections inside of the ventral visual stream were evaluated taking each FG separately (see section Functional Connectivity Analysis for more information).
Abundant functional connections between the cerebral areas of the occipital lobe (the occipital, lingual and cuneal cortex) and the FG was observed in all three groups, but with interesting differences. GC1 participants showed an ipsilateral and contralateral connection between the occipital brain areas and the right FG, but only ipsilateral connections with the left FG. In contrast, ipsilateral and contralateral connectivities were observed between the occipital lobe and both FGs in AG and CG2sham (Figure 5). Concerning the temporal lobe, although the three groups showed functional connectivity between both FGs, group differences in the connectivity profile were found in this lobe too. Ipsi and contralateral connections between FG and brain areas of the ventral visual stream were observed in AG. In contrast, only ipsilateral connections between the FGs and the inferior Temporal gyrus and parahippocampal cortex were observed in the temporal lobe of CG1. Functional connections to the frontal cortex (ipsilateral connection to right inferior frontal gyrus) and insula (ipsilateral connection to the right insula) were found only in CG1 (Figure 5 and Supplementary Table 3).
FIGURE 5.

Functional connectivity across all training blocks (AAL Atlas; Seed: each FG; P-FDR (seed corrected) < 0.01; one-sided (positive); thickness proportional to T magnitude). V1 (Calcarine cortex); O1, O2, and O3 (Superior, Middle and Inferior Occipital gyrus, respectively); Q (Cuneus cortex); LING (Lingual cortex); FUSI (FG); SMG (Supramarginal gyrus); T2 and T3 (Middle and Inferior Temporal gyrus); T2P (Temporal Pole, Middle Temporal gyrus); PHIP (Para hippocampus); SMG (Supramarginal gyrus); INS (Insula); F3T (inferior Frontal gyrus, pars triangularis).
No differences were found between groups in the connection strength of the right FG [F(2,36) = 3,224, p = 0.052, ns]. and of the left FG [H(2)0.201, p = 0.904, ns] when all brain areas were evaluated. Group differences were found in the connection strength between the right FG and brain areas of the ventral visual stream [F(2,33) = 4,81, p = 0.015], but no group differences were found in the connection strength of the left FG with these brain areas [H(2)0.265, p = 0.876, ns]. Specifically, the connections of the right FG and brain areas of the ventral visual stream in AG were stronger than the connections in CG1 (p = 0.012). No differences between CG1 and CG2sham (p = 0.507, ns), or between AG and CG2sham (p = 0.143, ns) were found.
Autism Clinical Condition and FFA Up-Regulation
The clinical features and facial processing profiles of the patients with ASD were evaluated to explore correlations between them and FFA up-regulation performance to obtain a better understanding of the rtfMRI-NF process in this population (Spearman correlation, two-tailed, 95% confidence interval, p < 0.05).
Clinical Features and FAA Up-Regulation Performance
Patients with greater symptoms severity of the (ADI-R total score) achieved higher activation values on right FFA during all training runs (right FFA: rs = 1, p = 0.0167/left FFA: rs = 0.6, p = 0.0350, ns.) (Supplementary Figure 3). No correlation was found between the up-regulation performance on left and right FFAs and ADOS-2 total score (left FFA: rs = −0.667, p = 0.267, ns.; right FFA: rs = −0.154, p = 0.833, ns.), nor Social Communication Questionnaire score (left FFA: rs = 0.4, p = 0.517 ns.; right FFA: rs = 0.7, p = 0.233, ns.) nor AQ score (left FFA: rs = 0.3, p = 0.683 ns.; right FFA: rs = 0.4, p = 0.517, ns.), nor Social Age of Vineland scale (left FFA: rs = −0.8, p = 0.133, ns.; right FFA: rs = −0.5, p = 0.450, ns.), nor chronological Age (left FFA: rs = −0.1, p = 0.950, ns.; right FFA: rs = 0.3, p = 0.683, ns.) nor I.Q. (left FFA: rs = −0.359, p = 0.633, ns.; right FFA: rs = −0.154, p = 0.833, ns.). No significant relationships between left and right FFA up-regulation performance and facial processing tasks (accuracy of FER, FIR, CFMT and The Eyes task and RT of CFMT) were found (Supplementary Figure 4).
Discussion
The present study is the first one to our knowledge to examine the application of rtfMRI-NF as a neuroscientific tool by using FFA up-regulation in subjects with ASD (Pereira et al., 2015). In fact, only two rtfMRI-NF studies in autism have been published during this research was carried out. One of them with the aim of up-regulating the posterior part of the superior temporal sulcus (Direito et al., 2019) and the second one looking for strengthening the functional connectivity between that brain region and the inferior parietal lobe (Ramot et al., 2017). In our study, individuals with ASD and TD that received contingent information from the brain region of interest achieved up-regulation of FFA, albeit with considerable differences at neural level.
No differences in the accuracy of face processing tasks were found between TD and ASD subjects, measured before the rtfMRI training. However, TD subjects were faster to answer in face memory tests than in car memory tests. On the other hand, subjects with ASD did not show this advantage for social versus non-social stimuli. This pattern is in line with the development of compensatory mechanisms of high cognitive demand and therefore requiring more processing time (Neumann et al., 2006; Clark et al., 2008; Santos et al., 2008; Weigelt et al., 2012; Livingston and Happé, 2017). These compensatory mechanisms may improve facial processing, but are highly cognitive/emotional wasting and limit real-time social interaction (García-Villamisar et al., 2010).
FFA Up-Regulation Magnitude
In our study, we show that patients with ASD without intellectual or language deficits were able to upregulate FFA. Individuals with ASD and TD who received real feedback achieved up-regulation of left and right FFAs from the first training session. In contrast, the group that received “sham” feedback (but the same instructions as the other groups) could not up-regulate FFAs in any training session. This suggests that volitional control of the region of interest cannot be learned when there is no contingency between neural activation and the feedback stimulus.
Whether participants with TD or with ASD could show further improvement in their FFA up-regulation performance with a longer training protocol is an open question. Longer protocols may be useful to achieve higher values of FFA up-regulation and translate that learning outside the scanner (Sulzer et al., 2013; Auer et al., 2015). Transferring it to a natural setting could be useful to explore both the association between FFA up-regulation performance and actual face processing improvement, and this method’s potential as an enhancement of usual therapies, as proposed for ASD (Caria and de Falco, 2015) and for other psychiatric disorders (Hanlon et al., 2013; Ruiz et al., 2013b; Buyukturkoglu et al., 2015; Mehler et al., 2018).
Variability of the FFA Up-Regulation Magnitude
A large variability (SD of the BOLD signal) was found in rFFA values during the training sessions. This concurs with the high intra-subject and inter-subject variability frequently reported in the fMRI literature (Lund et al., 2005; Gaxiola-Valdez and Goodyear, 2012). Despite the small group size in this study, findings on the variability of the BOLD level were significant. In particular, in the case of participants with TD, the contingent neural information contributed to producing less variability in the control of the BOLD activity of both FFAs. There is literature that associates BOLD signal variability with the maturation and specialization process of some brain areas (Nomi et al., 2017), which suggests a possible use of this novel approach to explore the maturation and specialization process (for example of face processing, Meng et al., 2012) in typical and ASD development. However, longer rtfMRI-NF protocols could serve that aim better (Sulzer et al., 2013).
Functional Analysis of the Brain and FFA Up-Regulation
Whole-Brain Analysis
One important finding of the study is the hypoactivation profile of the ventral visual stream – mainly of the right hemisphere – observed in persons with ASD as a consequence of FFA up-regulation guided by real-time fMRI neurofeedback. This finding is in line with the literature showing a specific FG hypoactivation profile when individuals with ASD participate in visual processing tasks with faces as stimuli (i.e., FFA hypoactivation) (Pierce et al., 2004; Nickl-Jockschat et al., 2014) but not with non-social stimuli (Humphreys et al., 2008; Scherf et al., 2010). Moreover, the literature shows that the level of FG activation elicited by non-social stimuli increases with motivational relevance or specialization level, both in the case of individuals with TD (Gauthier et al., 2000; Bilalić et al., 2016; Adamson and Troiani, 2018) and individuals with ASD (Grelotti et al., 2005; Foss-Feig et al., 2016). A possible explanation of FG Hypoactivation observed from the group analysis in participants with ASD may have to do with high variability in the location of FFA obtained in this (Supplementary Table 1) and other studies with participants with ASD (Scherf et al., 2010).
A hypoactivation profile of the inferior frontal gyrus was apparent in participants with ASD unlike those with TD who received contingent information from their FFAs. Inferior frontal gyrus is a brain area associated with the cognitive control network, and with different aspects of volitional cognitive functions (Swick et al., 2008; Della Rosa et al., 2018), as a substrate of the working memory of faces (Courtney et al., 1998; Druzgal and D’Esposito, 2003) and part of the imitation and mirror system (Buccino et al., 2004; Molenberghs et al., 2009). In all these specific cognitive functions individuals with ASD tend to show specific deficits associated with hypoactivation of inferior frontal gyrus (Rogers and Bennetto, 2000; Dapretto et al., 2006; Bookheimer et al., 2008). However, successful neurofeedback training is considered to be disassociated from cognitive effort (Emmert et al., 2016) or any specific mental strategy (Kober et al., 2013). Thus, the inferior frontal gyrus hypoactivation profile shown by participants with ASD could be explained as a specific dysfunction of the facial processing neural network, which could be observable as a consequence of FFA up-regulation. In fact, participants with TD who achieved FFA up-regulation showed a significant ipsilateral functional connection between the FFA and inferior frontal gyrus, but this was absent in ASD individuals and participants in CG2sham (who received the same instructions as CG1 and AG).
In addition, the insula and caudate nucleus were only recruited by those subjects with TD who achieved FFA up-regulation. Both brain areas are considered to be part of the extended network of face processing, in particular of emotional aspects (Haxby and Gobbini, 2010). The insula plays a role in detecting other’s emotions (Thom et al., 2014), in interoception (Critchley et al., 2004) and emotional awareness (Craig, 2009; Gu et al., 2013). In fact, an acquired Insula lesion results in impaired facial recognition of emotion. The caudate nucleus is associated with motivation, reinforcement learning, and reward (Liljeholm and O’Doherty, 2012; Morita et al., 2013; Daniel and Pollmann, 2014; Schultz, 2016; Kasanova et al., 2017). It has been associated, specifically, with social behavior reinforcement (Báez-Mendoza and Schultz, 2013; Bhanji and Delgado, 2014) and giving relative valence to the aspects of faces (Aharon et al., 2001; Lin et al., 2012). A hypoactivation profile of the insula and caudate nucleus have been reported in persons with ASD when performing different social cognition tasks (Pierce et al., 2004; Scott-Van Zeeland et al., 2010; Dichter et al., 2012; Odriozola et al., 2016) which could explain the lack of activation of the insula and caudate nucleus in our participants with ASD. The findings give some insight into the role of the cerebellum. As known, the cerebellum plays a key role in the development and modulation of the motor system (Salman and Tsai, 2016), but also of the higher social cognitive function (Riva, 2000) and reward system (Carta et al., 2019). In typical development, its connections extend to different brain areas, such as the inferior frontal gyrus (Watson et al., 2014), insula (Kaufman et al., 1996; Dobromyslin et al., 2012), ventral tegmental area, and caudate (Fox and Williams, 1970; Carta et al., 2019). In ASD, a disruption of long-range cerebrocerebellar circuits has been reported (Rane et al., 2015). In particular, the lack of correlation between cerebellar activation and caudate activation in ASD may explain the lack of social motivation (Crippa et al., 2016). On the other hand, the recruitment of the cerebellum may be a compensatory mechanism to obtain better social adaptive behavior (D’Mello and Stoodley, 2015; Crippa et al., 2016). This compensatory mechanism seems to be more effective in ASD individuals with fluent language and normal or high I.Q. (Livingston and Happé, 2017; Livingston et al., 2018). Therefore, recruitment of the cerebellum without activation of the striated/caudate nucleus in participants with ASD may be the result of atypical/compensatory development in individuals with ASD.
Functional Connectivity Analysis
The up-regulation of FFA in participants with TD resulted in a typical functional connectivity pattern observed previously with different visual tasks aimed at evaluating aspects of the visual processing of faces. Specifically, the connectivity profile in these participants was characterized by connections between the occipital lobe and the right FG, but not with the left FG. The left FG had only an ipsilateral functional connection with the inferior occipital gyrus. This finding can be explained by the typical right lateralization of visual processing of faces (Meng et al., 2012), and by a hierarchical organization of the information (Zhen et al., 2013), whereby the support of the right hemisphere is required to process the representation of faces in the left occipital lobe (faces presented on right visual field) (Verosky and Turk-Browne, 2012). In addition, participants with TD showed significant functional connectivity between the FG and the insula and inferior frontal gyrus as a result of successful FFA up-regulation. As described above, both brain areas have been widely reported to be part of the face-processing network (Haxby and Gobbini, 2010; Zhen et al., 2013). In contrast, participants with ASD showed neither this typical right neural lateralization of functional connectivity in the temporo-occipital cortex, nor functional connectivity between the FG and the insula, or the inferior frontal gyrus. On the other hand, unlike the TD participants, those participants with ASD presented functional connectivity between the FG and areas responsible for higher-order visual processing of faces but of the temporal lobe (the anterior temporal pole and middle temporal gyrus) (Von Der Heide et al., 2013; Zhen et al., 2013; Collins and Olson, 2014).
This atypical functional connectivity pattern could be due to the lack of the normal neural specialization of facial processing (Dawson et al., 2005; Nass and Gazzaniga, 2011), or long-distance brain underconnectivity (Courchesne and Pierce, 2005; Aoki et al., 2013), or it may reflect compensatory/atypical mechanisms for facial processing (Pierce et al., 2001; Joseph et al., 2015). It will have to be explored in future studies with a larger sample and other control groups (e.g., patients with other developmental conditions) if this profile of functional connectivity associated with FFA upregulation is specific to this clinical subpopulation (subjects within the autism spectrum with fluid language and normal IQ), which could bring us closer to obtaining specific diagnostic biomarkers for this clinical subpopulation.
In addition, participants with ASD showed more and stronger connections than individuals with TD between the FG and the brain areas of the ventral visual stream with rtfMRI-NF training. Hyper-connectivity of short-distance connections have been widely reported in ASD (Courchesne and Pierce, 2005; Barttfeld et al., 2011) and have been correlated with symptom severity, social impairment (Supekar et al., 2013; Chien et al., 2015) and savant abilities (Loui et al., 2011).
Clinical Features and FAA Up-Regulation
This study included ASD subjects without cognitive or language disability for three main reasons. First, because in this protocol participants were required to follow some instructions inside the scanner, which could present difficulty to those with cognitive or language comorbidity. Second, because a more homogenous sample permits a better interpretation of the results. Third, because subjects with ASD who do not have a history of global developmental delay (i.e., with normal IQ and fluent language) are a subgroup in which clinical evaluation is particularly challenging. Hence, being able to evaluate neural differences in this population might contribute to improved diagnostic.
Although one participant was unable to complete the training protocol due to sensory discomfort, the other five participants with ASD finished it without inconvenience. However, given the high prevalence of Sensory Processing Disorder in this population (Marco et al., 2011), a fuller sensory profile evaluation than ADOS-2 and ADI-R seems highly recommended for participants in rtfMRI-NF protocols. Nevertheless, five participants with ASD guided by the rtfMRI-NF managed to up-regulate FFAs and achieve similar activation values to participants with TD who received contingent feedback.
Interestingly, higher values of FFA up-regulation were found in participants with more severe core symptoms of ASD in their childhood (ADI-R total score), despite no correlation was found between the up-regulation performance and the severity of the current core symptoms (evaluated by ADOS-2). Despite of the reduced number of participants (that difficult a generalized explanation), an explanatory hypothesis might be that FFA up-regulatory ability is currently higher in those who developed more communicative and social skills throughout their childhood and adolescence by developing better skills to process information from faces (e.g., individuals with more severe symptoms on their childhood). No correlations between chronological age of ASD participants and up-regulation performance were found (up-regulation performance values were similar through adolescence and adulthood). Moreover, no correlations were apparent between the performance of the different facial processing tasks and FFA up-regulation performance. This can be explained by the absence of differences in the accuracy of these tasks between all individuals as it has been observed in other studies (Harms et al., 2010; Weigelt et al., 2012). Among the study’s limitations is the small size of the sample of participants. However, a strict statistical analysis with correction for multiple comparisons applied during our analyses contributed to the consistency of our analysis. The absence of a group of ASD patients trained with sham feedback could be another potential limitation. However, for ethical considerations we decided, to use instead of a TD control group trained with sham feedback because of two reasons. First, literature shows that up-regulation of a ROI guided by a rtfMRI-NF probably entails behavioral improvement regarding the functions of the respective trained ROI (Sitaram et al., 2007; Linden et al., 2012; Shih et al., 2012; Weiskopf, 2012; Li et al., 2013; Ruiz et al., 2013a; Sulzer et al., 2013; Buyukturkoglu et al., 2015). Second, effective rtfMRI-NF training could bring emotional improvements in the participants due to the experience of successful up-regulation (Mehler et al., 2018). Therefore, it has been preferred to avoid the use of sham feedback in a clinically vulnerable population. Another possible limitation of the study is the difference in age between the groups. Although it was preferred to use subjects with an age (late adolescence or beyond) at which the neural development of face processing is considered done (Pelphrey et al., 2009; de Heering et al., 2012), part of the results of the ASD group may be due to a lag in the neural development of visual processing of faces and not to the ASD condition (Golarai et al., 2010). However, significant results are not expected from the immature TD, thus being better explained by an atypical development (e.g., short-range hyperconnectivity between occipitotemporal brain areas or absence of long-range functional connectivity with insula or inferior frontal gyrus) as previously discussed. Despite that, further studies using this technique to assess changes throughout the development, i.e., at different ages, seems to be useful to obtain a better understanding of the neurodevelopment in ASD. Finally, women were under-represented in the study, a tendency of other studies on ASD (Halladay et al., 2015) despite the quadrupled prevalence of ASD in males compared to females. Behavioral and neural network differences have been found between males and females (Werling and Geschwind, 2013; Coffman et al., 2015; Alaerts et al., 2016), so future use of rtfMRI-NF to explore the facial processing neural network will be useful to study sex differences (Kreiser and White, 2014; Haney, 2016).
Conclusion and Future Applications
This is the first research to show that the neural networks involved in the visual processing of faces (one of the most important neural substrates affected in ASD) can be studied in participants with ASD using FFA up-regulation with rtfMRI-NF. Consistent differences in facial processing neural networks were found between individuals with typical development and those individuals with ASD. Hypoactivation of the ventral visual stream of the right hemisphere in the participants with ASD and differences in connectivity (with an increase in short but not long connections) in the ASD group compared to the control group with contingent neurofeedback, were some of the main findings. Further studies using this technique are required for the generalization of these findings with studies with a greater number of experimental subjects but also comparing subjects in different stages of development or looking for sex differences. With these limitations, this study demonstrates the technical feasibility of exploring neural differences that may be specific to young adults and adolescents with fluent language and normal IQ who have ASD. In this sense, the research of specific biomarkers for this ASD subpopulation could support the challenging clinical scenario of making the diagnosis of ASD in this population.
Data Availability Statement
All datasets generated for this study are included in the article/Supplementary Material.
Ethics Statement
The studies involving human participants were reviewed and approved by the Scientific-Ethical Committee of the Medicine Faculty, Pontificia Universidad Católica de Chile. Written informed consent to participate in this study was provided by the participants’ legal guardian/next of kin and by the participants.
Author Contributions
JP, SR, and RS conceived and planned the experiments. JP, PS, and CM carried out the experiments. JP, PS, and MR processed the experimental data and performed the analysis. CT and RS verified the analytical methods. JP, SR, and RS contributed to the interpretation of the results. JP took the lead in writing the manuscript. All authors provided critical feedback and helped shape the research, analysis, and manuscript.
Conflict of Interest
The authors declare that the research was conducted in the absence of any commercial or financial relationships that could be construed as a potential conflict of interest.
Acknowledgments
This research was supported by the Department of Psychiatry, the School of Engineering and the Research Vice-Rectory of the Pontificia Universidad Católica de Chile.
Abbreviations
- AAL
anatomical automatic labeling atlas
- ADI-R
the autism diagnostic interview-revised
- ADOS-2
autism diagnostic observational schedule version 2
- AG
experimental group
- ASD
autism spectrum disorder
- BOLD
blood oxygenation level-dependent
- CCMT
Cambridge car memory test
- CFMT
Cambridge face memory test
- CG1
control group 1
- CG2sham
control group 2
- EPI
gradient echo planar imaging
- FER
emotion recognition test
- FFA
fusiform face area
- FG
fusiform gyrus
- FIR
face recognition test
- ROI
region of interest
- rtfMRI-NF
neurofeedback based on real-time functional MRI
- SPM
statistical parametric mapping software package
- TD
typical neural development.
Funding. The support of the National Commission for Scientific and Technological Research of Chile (Conicyt) was received through the CONICYT-PCHA scholarship/Doctorado_Nacional/2014-21140705, the Fondecyt Regular Grants, number 1171320, 1171313, and 1191710, the CONICYT-PIA Anillo ACT1414, ACT1416, ACT172121, ACT190064 and through the Millennium Nucleus for Cardiovascular Magnetic Resonance.
Supplementary Material
The Supplementary Material for this article can be found online at: https://www.frontiersin.org/articles/10.3389/fnhum.2019.00446/full#supplementary-material
References
- Adamson K., Troiani V. (2018). Distinct and overlapping fusiform activation to faces and food. Neuroimage 174 393–406. 10.1016/j.neuroimage.2018.02.064 [DOI] [PubMed] [Google Scholar]
- Adolphs R. (2009). The social brain: neural basis of social knowledge. Annu. Rev. Psychol. 60 693–716. 10.1146/annurev.psych.60.110707.163514 [DOI] [PMC free article] [PubMed] [Google Scholar]
- Aharon I., Etcoff N., Ariely D., Chabris C. F., O’Connor E., Breiter H. C. (2001). Beautiful faces have variable reward value: fMRI and behavioral evidence. Neuron 32 537–551. 10.1016/s0896-6273(01)00491-3 [DOI] [PubMed] [Google Scholar]
- Alaerts K., Swinnen S. P., Wenderoth N. (2016). Sex differences in autism: a resting-state fMRI investigation of functional brain connectivity in males and females. Soc. Cogn. Affect. Neurosci. 11 1002–1016. 10.1093/scan/nsw027 [DOI] [PMC free article] [PubMed] [Google Scholar]
- American Psychiatric Association, (2013). DSM 5. Washington, DC: American Psychiatric Association, 10.1176/appi.books.9780890425596.744053 [DOI] [Google Scholar]
- Aoki Y., Abe O., Nippashi Y., Yamasue H. (2013). Comparison of white matter integrity between autism spectrum disorder subjects and typically developing individuals: a meta-analysis of diffusion tensor imaging tractography studies. Mol. Autism 4:25. 10.1186/2040-2392-4-25 [DOI] [PMC free article] [PubMed] [Google Scholar]
- Auer T., Schweizer R., Frahm J. (2015). Training efficiency and transfer success in an extended real-time functional MRI neurofeedback training of the somatomotor cortex of healthy subjects. Front. Hum. Neurosci. 9:547. 10.3389/fnhum.2015.00547 [DOI] [PMC free article] [PubMed] [Google Scholar]
- Báez-Mendoza R., Schultz W. (2013). The role of the striatum in social behavior. Front. Neurosci. 7:233. 10.3389/fnins.2013.00233 [DOI] [PMC free article] [PubMed] [Google Scholar]
- Baron-Cohen S., Wheelwright S., Hill J., Raste Y., Plumb I. (2001a). The “Reading the Mind in the Eyes” Test revised version: a study with normal adults, and adults with Asperger syndrome or high-functioning autism. J. Child Psychol. Psychiatry. 42 241–251. 10.1111/1469-7610.00715 [DOI] [PubMed] [Google Scholar]
- Baron-Cohen S., Wheelwright S., Skinner R., Martin J., Clubley E. (2001b). The Autism-Spectrum Quotient (AQ): evidence from Asperger Syndrome/High-Functioning autism, males and females, scientists and mathematicians. J. Autism Dev. Disord. 31 5–17. [DOI] [PubMed] [Google Scholar]
- Barttfeld P., Wicker B., Cukier S., Navarta S., Lew S., Sigman M. (2011). A big-world network in ASD: dynamical connectivity analysis reflects a deficit in long-range connections and an excess of short-range connections. Neuropsychologia 49 254–263. 10.1016/j.neuropsychologia.2010.11.024 [DOI] [PubMed] [Google Scholar]
- Beecham J. (2014). Annual research review: child and adolescent mental health interventions: a review of progress in economic studies across different disorders. J. Child Psychol. Psychiatry 55 714–732. 10.1111/jcpp.12216 [DOI] [PMC free article] [PubMed] [Google Scholar]
- Bhanji J. P., Delgado M. R. (2014). The social brain and reward: social information processing in the human striatum. Wiley Interdiscip. Rev. Cogn. Sci. 5 61–73. 10.1002/wcs.1266 [DOI] [PMC free article] [PubMed] [Google Scholar]
- Bilalić M., Grottenthaler T., Nägele T., Lindig T. (2016). The faces in radiological images: fusiform face area supports radiological expertise. Cereb. Cortex 26 1004–1014. 10.1093/cercor/bhu272 [DOI] [PubMed] [Google Scholar]
- Birbaumer N., Ruiz S., Sitaram R. (2013). Learned regulation of brain metabolism. Trends Cogn. Sci. 17 295–302. 10.1016/j.tics.2013.04.009 [DOI] [PubMed] [Google Scholar]
- Bookheimer S. Y., Wang A. T., Scott A., Sigman M., Dapretto M. (2008). Frontal contributions to face processing differences in autism: evidence from fMRI of inverted face processing. J. Int. Neuropsychol. Soc. 14:922. 10.1017/S135561770808140X [DOI] [PMC free article] [PubMed] [Google Scholar]
- Buccino G., Vogt S., Ritzl A., Fink G. R., Zilles K., Freund H. J., et al. (2004). Neural circuits underlying imitation learning of hand actions: an event-related fMRI study. Neuron 42 323–334. 10.1016/S0896-6273(04)00181-183 [DOI] [PubMed] [Google Scholar]
- Buyukturkoglu K., Roettgers H., Sommer J., Rana M., Dietzsch L., Arikan E. B., et al. (2015). Self-regulation of anterior insula with real-time fMRI and its behavioral effects in obsessive-compulsive disorder: a feasibility study. PLoS One 10:e135872. 10.1371/journal.pone.0135872 [DOI] [PMC free article] [PubMed] [Google Scholar]
- Calder A. J., Lawrence A. D., Keane J., Scott S. K., Owen A. M., Christoffels I., et al. (2002). Reading the mind from eye gaze. Neuropsychologia 40 1129–1138. 10.1016/s0028-3932(02)00008-8 [DOI] [PubMed] [Google Scholar]
- Caria A., de Falco S. (2015). Anterior insular cortex regulation in autism spectrum disorders. Front. Behav. Neurosci. 9:38. 10.3389/fnbeh.2015.00038 [DOI] [PMC free article] [PubMed] [Google Scholar]
- Caria A., Veit R., Sitaram R., Lotze M., Weiskopf N., Grodd W., et al. (2007). Regulation of anterior insular cortex activity using real-time fMRI. Neuroimage 35 1238–1246. 10.1016/j.neuroimage.2007.01.018 [DOI] [PubMed] [Google Scholar]
- Carta I., Chen C. H., Schott A. L., Dorizan S., Khodakhah K. (2019). Cerebellar modulation of the reward circuitry and social behavior. Science 363:eaav0581. 10.1126/science.aav0581 [DOI] [PMC free article] [PubMed] [Google Scholar]
- Chien H.-Y., Lin H.-Y., Lai M.-C., Shur-Fen Gau S., Isaac Tseng W.-Y. (2015). Hyperconnectivity of the right posterior temporo-parietal junction predicts social difficulties in boys with autism spectrum disorder. Autism Res. 8 427–441. 10.1002/aur.1457 [DOI] [PubMed] [Google Scholar]
- Clark T. F., Winkielman P., McIntosh D. N. (2008). Autism and the extraction of emotion from briefly presented facial expressions: stumbling at the first step of empathy. Emotion 8 803–809. 10.1037/a0014124 [DOI] [PubMed] [Google Scholar]
- Coffman M. C., Anderson L. C., Naples A. J., McPartland J. C. (2015). Sex differences in social perception in children with ASD. J. Autism Dev. Disord. 45 589–599. 10.1007/s10803-013-2006-2005 [DOI] [PMC free article] [PubMed] [Google Scholar]
- Collins J. A., Olson I. R. (2014). Beyond the FFA: the role of the ventral anterior temporal lobes in face processing. Neuropsychologia 61 65–79. 10.1016/j.neuropsychologia.2014.06.005 [DOI] [PMC free article] [PubMed] [Google Scholar]
- Courchesne E., Pierce K. (2005). Why the frontal cortex in autism might be talking only to itself: local over-connectivity but long-distance disconnection. Curr. Opin. Neurobiol. 15 225–230. 10.1016/J.CONB.2005.03.001 [DOI] [PubMed] [Google Scholar]
- Courtney S. M., Petit L., Haxby J. V., Ungerleider L. G. (1998). The role of prefrontal cortex in working memory: examining the contents of consciousness. Philos. Trans. Biol. Sci. 353 1819–1828. [DOI] [PMC free article] [PubMed] [Google Scholar]
- Craig A. D. (2009). How do you feel - now? The anterior insula and human awareness. Nat. Rev. Neurosci. 10 59–70. 10.1038/nrn2555 [DOI] [PubMed] [Google Scholar]
- Crippa A., Del Vecchio G., Ceccarelli S. B., Nobile M., Arrigoni F., Brambilla P. (2016). Cortico-cerebellar connectivity in Autism Spectrum Disorder: What do we know so far? Front. Psychiatry 7:20. 10.3389/fpsyt.2016.00020 [DOI] [PMC free article] [PubMed] [Google Scholar]
- Critchley H. D., Wiens S., Rotshtein P., Öhman A., Dolan R. J. (2004). Neural systems supporting interoceptive awareness. Nat. Neurosci. 7 189–195. 10.1038/nn1176 [DOI] [PubMed] [Google Scholar]
- Daniel R., Pollmann S. (2014). A universal role of the ventral striatum in reward-based learning: evidence from human studies. Neurobiol. Learn. Mem. 114 90–100. 10.1016/j.nlm.2014.05.002 [DOI] [PMC free article] [PubMed] [Google Scholar]
- Dapretto M., Davies M. S., Pfeifer J. H., Scott A. A., Sigman M., Bookheimer S. Y., et al. (2006). Understanding emotions in others: mirror neuron dysfunction in children with autism spectrum disorders. Nat. Neurosci. 9 28–30. 10.1038/nn1611 [DOI] [PMC free article] [PubMed] [Google Scholar]
- Dawson G., Webb S. J., McPartland J. (2005). Understanding the nature of face processing impairment in autism: insights from behavioral and electrophysiological studies. Dev. Neuropsychol. 27 403–424. 10.1207/s15326942dn2703_6 [DOI] [PubMed] [Google Scholar]
- de Heering A., Rossion B., Maurer D. (2012). Developmental changes in face recognition during childhood: evidence from upright and inverted faces. Cogn. Dev. 27 17–27. 10.1016/j.cogdev.2011.07.001 [DOI] [Google Scholar]
- Della Rosa P. A., Catricalà E., Canini M., Vigliocco G., Cappa S. F. (2018). The left inferior frontal gyrus: a neural crossroads between abstract and concrete knowledge. Neuroimage 175 449–459. 10.1016/j.neuroimage.2018.04.021 [DOI] [PubMed] [Google Scholar]
- Dennett H. W., McKone E., Tavashmi R., Hall A., Pidcock M., Edwards M., et al. (2012). The Cambridge Car Memory Test: a task matched in format to the Cambridge Face Memory Test, with norms, reliability, sex differences, dissociations from face memory, and expertise effects. Behav. Res. Methods 44 587–605. 10.3758/s13428-011-0160-162 [DOI] [PubMed] [Google Scholar]
- Di Martino A., Zuo X. N., Kelly C., Grzadzinski R., Mennes M., Schvarcz A., et al. (2013). Shared and distinct intrinsic functional network centrality in autism and attention-deficit/hyperactivity disorder. Biol. Psychiatry 74 623–632. 10.1016/j.biopsych.2013.02.011 [DOI] [PMC free article] [PubMed] [Google Scholar]
- Dichter G. S., Felder J. N., Green S. R., Rittenberg A. M., Sasson N. J., Bodfish J. W. (2012). Reward circuitry function in autism spectrum disorders. Soc. Cogn. Affect. Neurosci. 7 160–172. 10.1093/scan/nsq095 [DOI] [PMC free article] [PubMed] [Google Scholar]
- Direito B., Lima J., Simões M., Sayal A., Sousa T., Lührs M., et al. (2019). Targeting dynamic facial processing mechanisms in superior temporal sulcus using a novel fMRI neurofeedback target. Neuroscience 406 97–108. 10.1016/J.NEUROSCIENCE.2019.02.024 [DOI] [PubMed] [Google Scholar]
- D’Mello A. M., Stoodley C. J. (2015). Cerebro-cerebellar circuits in autism spectrum disorder. Front. Neurosci. 9:408. 10.3389/fnins.2015.00408 [DOI] [PMC free article] [PubMed] [Google Scholar]
- Dobromyslin V. I., Salat D. H., Fortier C. B., Leritz E. C., Beckmann C. F., Milberg W. P., et al. (2012). Distinct functional networks within the cerebellum and their relation to cortical systems assessed with independent component analysis. Neuroimage 60 2073–2085. 10.1016/j.neuroimage.2012.01.139 [DOI] [PMC free article] [PubMed] [Google Scholar]
- Druzgal T. J., D’Esposito M. (2003). Dissecting contributions of prefrontal cortex and fusiform face area to face working memory. J. Cogn. Neurosci. 15 771–784. 10.1162/089892903322370708 [DOI] [PubMed] [Google Scholar]
- Emmert K., Kopel R., Sulzer J., Brühl A. B., Berman B. D., Linden D. E. J., et al. (2016). Meta-analysis of real-time fMRI neurofeedback studies using individual participant data: how is brain regulation mediated? Neuroimage 124(Pt A), 806–812. 10.1016/j.neuroimage.2015.09.042 [DOI] [PubMed] [Google Scholar]
- Fernell E., Eriksson M. A., Gillberg C. (2013). Early diagnosis of autism and impact on prognosis: a narrative review. Clin. Epidemiol. 5 33–43. 10.2147/CLEP.S41714 [DOI] [PMC free article] [PubMed] [Google Scholar]
- Fisch G. S. (2012). Nosology and epidemiology in autism: classification counts. Am. J. Med. Genet. Part C Semin. Med. Genet. 160C 91–103. 10.1002/ajmg.c.31325 [DOI] [PubMed] [Google Scholar]
- Foss-Feig J. H., McGugin R. W., Gauthier I., Mash L. E., Ventola P., Cascio C. J. (2016). A functional neuroimaging study of fusiform response to restricted interests in children and adolescents with autism spectrum disorder. J. Neurodev. Disord. 8:15. 10.1186/s11689-016-9149-9146 [DOI] [PMC free article] [PubMed] [Google Scholar]
- Fox M., Williams T. D. (1970). The caudate nucleus-cerebellar pathways: an electrophysiological study of their route through the midbrain. Brain Res. 20 140–144. 10.1016/0006-8993(70)90164-90162 [DOI] [PubMed] [Google Scholar]
- Friston K. (2011). Functional and effective connectivity: a review. 1. Brain Connect. 1 13–36. 10.1089/brain.2011.0008 [DOI] [PubMed] [Google Scholar]
- Frith C. D. (2007). The social brain? Philos. Trans. R. Soc. Lond. B. Biol. Sci. 362 671–678. 10.1098/rstb.2006.2003 [DOI] [PMC free article] [PubMed] [Google Scholar]
- Ganel T., Valyear K. F., Goshen-Gottstein Y., Goodale M. A. (2005). The involvement of the “fusiform face area” in processing facial expression. Neuropsychologia 43 1645–1654. 10.1016/j.neuropsychologia.2005.01.012 [DOI] [PubMed] [Google Scholar]
- García-Villamisar D., Rojahn J., Zaja R. H., Jodra M. (2010). Facial emotion processing and social adaptation in adults with and without autism spectrum disorder. Res. Autism Spectr. Disord. 4 755–762. 10.1016/j.rasd.2010.01.016 [DOI] [Google Scholar]
- Gauthier I., Skudlarski P., Gore J. C., Anderson A. W. (2000). Expertise for cars and birds recruits brain areas involved in face recognition. Nat. Neurosci. 3 191–197. 10.1038/72140 [DOI] [PubMed] [Google Scholar]
- Gaxiola-Valdez I., Goodyear B. G. (2012). Origins of intersubject variability of blood oxygenation level dependent and arterial spin labeling fMRI: implications for quantification of brain activity. Magn. Reson. Imaging 30 1394–1400. 10.1016/j.mri.2012.05.002 [DOI] [PubMed] [Google Scholar]
- Goeleven E., De Raedt R., Leyman L., Verschuere B. (2008). The karolinska directed emotional faces: a validation study. Cogn. Emot. 22 1094–1118. 10.1080/02699930701626582 29312053 [DOI] [Google Scholar]
- Golarai G., Grill-Spector K., Reiss A. L. (2006). Autism and the development of face processing. Clin. Neurosci. Res. 6 145–160. 10.1016/j.cnr.2006.08.001 [DOI] [PMC free article] [PubMed] [Google Scholar]
- Golarai G., Liberman A., Yoon J. M. D., Grill-Spector K. (2010). Differential development of the ventral visual cortex extends through adolescence. Front. Hum. Neurosci. 3:80. 10.3389/neuro.09.080.2009 [DOI] [PMC free article] [PubMed] [Google Scholar]
- Grelotti D. J., Klin A. J., Gauthier I., Skudlarski P., Cohen D. J., Gore J. C., et al. (2005). fMRI activation of the fusiform gyrus and amygdala to cartoon characters but not to faces in a boy with autism. Neuropsychologia 43 373–385. 10.1016/j.neuropsychologia.2004.06.015 [DOI] [PubMed] [Google Scholar]
- Gu X., Hof P. R., Friston K. J., Fan J. (2013). Anterior insular cortex and emotional awareness. J. Comp. Neurol. 521 3371–3388. 10.1002/cne.23368 [DOI] [PMC free article] [PubMed] [Google Scholar]
- Habes I., Rushton S., Johnston S. J., Sokunbi M. O., Barawi K., Brosnan M., et al. (2016). fMRI neurofeedback of higher visual areas and perceptual biases. Neuropsychologia 85 208–215. 10.1016/j.neuropsychologia.2016.03.031 [DOI] [PMC free article] [PubMed] [Google Scholar]
- Halladay A. K., Bishop S., Constantino J. N., Daniels A. M., Koenig K., Palmer K., et al. (2015). Sex and gender differences in autism spectrum disorder: summarizing evidence gaps and identifying emerging areas of priority. Mol. Autism 6 36. 10.1186/s13229-015-0019-y [DOI] [PMC free article] [PubMed] [Google Scholar]
- Haney J. L. (2016). Autism, females, and the DSM-5: gender bias in autism diagnosis. Soc. Work Ment. Health 14 396–407. 10.1080/15332985.2015.1031858 22840550 [DOI] [Google Scholar]
- Hanlon C. W., Hartwell K. J., Canterberry M., Li X., Owens M., LeMatty T., et al. (2013). Reduction of cue-induced craving through realtime neurofeedback in nicotine users: the role of region of interest selection and multiple visits. Psychiatry Res. Neuroimaging 213 79–81. 10.1016/j.pscychresns.2013.03.003 [DOI] [PMC free article] [PubMed] [Google Scholar]
- Harms M. B., Martin A., Wallace G. L. (2010). Facial emotion recognition in autism spectrum disorders: a review of behavioral and neuroimaging studies. Neuropsychol. Rev. 20 290–322. 10.1007/s11065-010-9138-9136 [DOI] [PubMed] [Google Scholar]
- Haxby J. V., Gobbini M. I. (2010). “Distributed neural systems for face perception,” in Oxford Handbook of Face Perception, eds Rhodes G., Calder A., Johnson M., Haxby J. V. (Oxford: OUP Oxford; ), 93–110. 10.1093/oxfordhb/9780199559053.001.0001 [DOI] [Google Scholar]
- Hedley D., Brewer N., Young R. (2011). Face recognition performance of individuals with Asperger syndrome on the Cambridge Face Memory Test. Autism Res. Off. J. Int. Soc. Autism Res. 4 449–455. 10.1002/aur.214 [DOI] [PubMed] [Google Scholar]
- Howlin P., Goode S., Hutton J., Rutter M. (2004). Adult outcome for children with autism. J. Child Psychol. Psychiatry Allied Discip. 45 212–229. 10.1111/j.1469-7610.2004.00215.x [DOI] [PubMed] [Google Scholar]
- Huang L., Song Y., Li J., Zhen Z., Yang Z., Liu J. (2014). Individual differences in cortical face selectivity predict behavioral performance in face recognition. Front. Hum. Neurosci. 8:483. 10.3389/fnhum.2014.00483 [DOI] [PMC free article] [PubMed] [Google Scholar]
- Humphreys K., Hasson U., Avidan G., Minshew N., Behrmann M. (2008). Cortical patterns of category-selective activation for faces, places and objects in adults with autism. Autism Res. 1 52–63. 10.1002/aur.1 [DOI] [PMC free article] [PubMed] [Google Scholar]
- Jiang X., Bollich A., Cox P., Hyder E., James J., Gowani S. A., et al. (2013). A quantitative link between face discrimination deficits and neuronal selectivity for faces in autism. NeuroImage. Clin. 2 320–331. 10.1016/j.nicl.2013.02.002 [DOI] [PMC free article] [PubMed] [Google Scholar]
- Johnson M. H., Griffin R., Csibra G., Halit H., Farroni T., de Haan M., et al. (2005). The emergence of the social brain network: evidence from typical and atypical development. Dev. Psychopathol. 17 599–619. 10.1017/S0954579405050297 [DOI] [PMC free article] [PubMed] [Google Scholar]
- Joseph J. E., Zhu X., Gundran A., Davies F., Clark J. D., Ruble L., et al. (2015). Typical and atypical neurodevelopment for face specialization: an fMRI study. J. Autism Dev. Disord. 45 1725–1741. 10.1007/s10803-014-2330-2334 [DOI] [PMC free article] [PubMed] [Google Scholar]
- Kasanova Z., Ceccarini J., Frank M. J., Amelsvoort T., van Booij J., Heinzel A., et al. (2017). Striatal dopaminergic modulation of reinforcement learning predicts reward—oriented behavior in daily life. Biol. Psychol. 127 1–9. 10.1016/j.biopsycho.2017.04.014 [DOI] [PubMed] [Google Scholar]
- Kaufman G. D., Mustari M. J., Miselis R. R., Perachio A. A. (1996). Transneuronal pathways to the vestibulocerebellum. J. Comp. Neurol. 370 501–523. 10.1002/(sici)1096-9861(19960708)370:4<501::aid-cne7>3.3.co;2-3 [DOI] [PubMed] [Google Scholar]
- Keown C. L., Shih P., Nair A., Peterson N., Mulvey M. E., Müller R. A. (2013). Local functional overconnectivity in posterior brain regions is associated with symptom severity in autism spectrum disorders. Cell Rep. 5 567–572. 10.1016/j.celrep.2013.10.003 [DOI] [PMC free article] [PubMed] [Google Scholar]
- Kim S. H., Thurm A., Shumway S., Lord C. (2013). Multisite study of new autism diagnostic interview-revised (ADI-R) Algorithms for toddlers and young preschoolers. J. Autism Dev. Disord. 43 1527–1538. 10.1007/s10803-012-1696-1694 [DOI] [PMC free article] [PubMed] [Google Scholar]
- Kim Y. S., Leventhal B. L., Koh Y.-J., Fombonne E., Laska E., Lim E.-C., et al. (2011). Prevalence of autism spectrum disorders in a total population sample. Am. J. Psychiatry 168 904–912. 10.1176/appi.ajp.2011.10101532 [DOI] [PubMed] [Google Scholar]
- Klin A., Saulnier C. A., Sparrow S. S., Cicchetti D. V., Volkmar F. R., Lord C. (2007). Social and communication abilities and disabilities in higher functioning individuals with autism spectrum disorders: the Vineland and the ADOS. J. Autism Dev. Disord. 37 748–759. 10.1007/s10803-006-0229-224 [DOI] [PubMed] [Google Scholar]
- Klin A., Shultz S., Jones W. (2015). Social visual engagement in infants and toddlers with autism: early developmental transitions and a model of pathogenesis. Neurosci. Biobehav. Rev. 50 189–203. 10.1016/j.neubiorev.2014.10.006 [DOI] [PMC free article] [PubMed] [Google Scholar]
- Kober S. E., Witte M., Ninaus M., Neuper C., Wood G. (2013). Learning to modulate one’s own brain activity: the effect of spontaneous mental strategies. Front. Hum. Neurosci 7:695. 10.3389/fnhum.2013.00695 [DOI] [PMC free article] [PubMed] [Google Scholar]
- Kravitz D. J., Saleem K. S., Baker C. I., Ungerleider L. G., Mishkin M. (2013). The ventral visual pathway: an expanded neural framework for the processing of object quality. Trends Cogn. Sci. 17 26–49. 10.1016/j.tics.2012.10.011 [DOI] [PMC free article] [PubMed] [Google Scholar]
- Kreiser N. L., White S. W. (2014). ASD in females: are we overstating the gender difference in diagnosis? Clin. Child Fam. Psychol. Rev. 17 67–84. 10.1007/s10567-013-0148-149 [DOI] [PubMed] [Google Scholar]
- Lai M.-C., Lombardo M. V., Baron-Cohen S. (2014). Autism. Lancet 383 896–910. 10.1016/S0140-6736(13)61539-61531 [DOI] [PubMed] [Google Scholar]
- Lecavalier L., Aman M. G., Scahill L., McDougle C. J., McCracken J. T., Vitiello B., et al. (2006). Validity of the autism diagnostic interview-revised. Am. J. Ment. Retard. 111 199–215. [DOI] [PubMed] [Google Scholar]
- Li X., Hartwell K. J., Borckardt J., Prisciandaro J. J., Saladin M. E., Morgan P. S., et al. (2013). Volitional reduction of anterior cingulate cortex activity produces decreased cue craving in smoking cessation: a preliminary real-time fMRI study. Addict. Biol. 18 739–748. 10.1111/j.1369-1600.2012.00449.x [DOI] [PMC free article] [PubMed] [Google Scholar]
- Liljeholm M., O’Doherty J. P. (2012). Contributions of the striatum to learning, motivation, and performance: an associative account. Trends Cogn. Sci. 16 467–475. 10.1016/j.tics.2012.07.007 [DOI] [PMC free article] [PubMed] [Google Scholar]
- Lin A., Adolphs R., Rangel A. (2012). Social and monetary reward learning engage overlapping neural substrates. Soc. Cogn. Affect. Neurosci. 7 274–281. 10.1093/scan/nsr006 [DOI] [PMC free article] [PubMed] [Google Scholar]
- Linden D. E. J., Habes I., Johnston S. J., Linden S., Tatineni R., Subramanian L., et al. (2012). Real-time self-regulation of emotion networks in patients with depression. PLoS One 7:e38115. 10.1371/journal.pone.0038115 [DOI] [PMC free article] [PubMed] [Google Scholar]
- Livingston L. A., Colvert E., Bolton P., Happé F., Happé F. (2018). Good social skills despite poor theory of mind: exploring compensation in autism spectrum disorder. J. Child Psychol. Psychiatry 60 102–110. 10.1111/jcpp.12886 [DOI] [PMC free article] [PubMed] [Google Scholar]
- Livingston L. A., Happé F. (2017). Conceptualising compensation in neurodevelopmental disorders: reflections from autism spectrum disorder. Neurosci. Biobehav. Rev. 80 729–742. 10.1016/J.NEUBIOREV.2017.06.005 [DOI] [PMC free article] [PubMed] [Google Scholar]
- Lord C., Risi S., Lambrecht L., Cook E. H., Leventhal B. L., DiLavore P. C., et al. (2000). The autism diagnostic observation schedule-generic: a standard measure of social and communication deficits associated with the spectrum of autism. J Autism Dev Disord. 30 205–223. 10.1007/BF02211841 [DOI] [PubMed] [Google Scholar]
- Lord C., Rutter M., DiLavore P., Risi S., Gotham K., Bishop S. (2012). Autism Diagnostic Observation Schedule, (ADOS-2) Modules. Toddler Module. Torrance, CA: Western Psychological Services. [Google Scholar]
- Loui P., Li H. C., Hohmann A., Schlaug G. (2011). Enhanced cortical connectivity in absolute pitch musicians: a model for local hyperconnectivity. J. Cogn. Neurosci. 23 1015–1026. 10.1162/jocn.2010.21500 [DOI] [PMC free article] [PubMed] [Google Scholar]
- Lund T. E., Nørgaard M. D., Rostrup E., Rowe J. B., Paulson O. B. (2005). Motion or activity: their role in intra- and inter-subject variation in fMRI. Neuroimage 26 960–964. 10.1016/j.neuroimage.2005.02.021 [DOI] [PubMed] [Google Scholar]
- Mandell D. S., Novak M. M., Zubritsky C. D. (2005). Factors associated with age of diagnosis among children with autism spectrum disorders. Pediatrics 116 1480–1486. 10.1542/peds.2005-2185 [DOI] [PMC free article] [PubMed] [Google Scholar]
- Marco E. J., Hinkley L. B. N., Hill S. S., Nagarajan S. S. (2011). Sensory processing in autism: a review of neurophysiologic findings. Pediatr. Res. 69 48R–54R. 10.1203/PDR.0b013e3182130c54 [DOI] [PMC free article] [PubMed] [Google Scholar]
- Mehler D. M. A., Sokunbi M. O., Habes I., Barawi K., Subramanian L., Range M., et al. (2018). Targeting the affective brain—a randomized controlled trial of real-time fMRI neurofeedback in patients with depression. Neuropsychopharmacology 43 2578–2585. 10.1038/s41386-018-0126-125 [DOI] [PMC free article] [PubMed] [Google Scholar]
- Meng M., Cherian T., Singal G., Sinha P. (2012). Lateralization of face processing in the human brain. Proc. Biol. Sci. 279 2052–2061. 10.1098/rspb.2011.1784 [DOI] [PMC free article] [PubMed] [Google Scholar]
- Mišić B., Fatima Z., Askren M. K., Buschkuehl M., Churchill N., Cimprich B., et al. (2014). The functional connectivity landscape of the human brain. PLoS One 9:e111007. 10.1371/journal.pone.0111007 [DOI] [PMC free article] [PubMed] [Google Scholar]
- Molenberghs P., Cunnington R., Mattingley J. B. (2009). Is the mirror neuron system involved in imitation? A short review and meta-analysis. Neurosci. Biobehav. Rev. 33 975–980. 10.1016/j.neubiorev.2009.03.010 [DOI] [PubMed] [Google Scholar]
- Morita K., Morishima M., Sakai K., Kawaguchi Y. (2013). Dopaminergic control of motivation and reinforcement learning: a closed-circuit account for reward-oriented behavior. J. Neurosci. 33 8866–8890. 10.1523/JNEUROSCI.4614-12.2013 [DOI] [PMC free article] [PubMed] [Google Scholar]
- Mundy P., Kasari C., Sigman M. (1992). Nonverbal communication, affective sharing, and intersubjectivity. Infant Behav. Dev. 15 377–381. 10.1016/0163-6383(92)80006-G [DOI] [Google Scholar]
- Nass R. D., Gazzaniga M. S. (2011). “Cerebral lateralization and specialization in human central nervous system,” in Comprehensive Physiology, ed. Pollock D. M. (Hoboken, NJ: John Wiley & Sons, Inc; ), 701–761. 10.1002/cphy.cp010518 [DOI] [Google Scholar]
- Neumann D., Spezio M. L., Piven J., Adolphs R. (2006). Looking you in the mouth: abnormal gaze in autism resulting from impaired top-down modulation of visual attention. Soc. Cogn. Affect. Neurosci. 1 194–202. 10.1093/scan/nsl030 [DOI] [PMC free article] [PubMed] [Google Scholar]
- Nickl-Jockschat T., Rottschy C., Thommes J., Schneider F., Laird A. R., Fox P. T., et al. (2014). Neural networks related to dysfunctional face processing in autism spectrum disorder. Brain Struct. Funct. 220 2355–2371. 10.1007/s00429-014-0791-z [DOI] [PMC free article] [PubMed] [Google Scholar]
- Nomi J. S., Bolt T. S., Ezie C. E. C., Uddin L. Q., Heller A. S. (2017). Moment-to-moment BOLD signal variability reflects regional changes in neural flexibility across the lifespan. J. Neurosci. 37 5539–5548. 10.1523/JNEUROSCI.3408-16.2017 [DOI] [PMC free article] [PubMed] [Google Scholar]
- Odriozola P., Uddin L. Q., Lynch C. J., Kochalka J., Chen T., Menon V. (2016). Insula response and connectivity during social and non-social attention in children with autism. Soc. Cogn. Affect. Neurosci. 11 433–444. 10.1093/scan/nsv126 [DOI] [PMC free article] [PubMed] [Google Scholar]
- Paakki J. J., Rahko J., Long X., Moilanen I., Tervonen O., Nikkinen J., et al. (2010). Alterations in regional homogeneity of resting-state brain activity in autism spectrum disorders. Brain Res. 1321 169–179. 10.1016/j.brainres.2009.12.081 [DOI] [PubMed] [Google Scholar]
- Paret C., Ruf M., Gerchen M. F., Kluetsch R., Demirakca T., Jungkunz M., et al. (2016). FMRI neurofeedback of amygdala response to aversive stimuli enhances prefrontal-limbic brain connectivity. Neuroimage 125 182–188. 10.1016/j.neuroimage.2015.10.027 [DOI] [PubMed] [Google Scholar]
- Pelphrey K. A., Lopez J., Morris J. P. (2009). Developmental continuity and change in responses to social and nonsocial categories in human extrastriate visual cortex. Front. Hum. Neurosci. 3:25. 10.3389/neuro.09.025.2009 [DOI] [PMC free article] [PubMed] [Google Scholar]
- Pereira J. A., Sepulveda P., Sitaram R., Mohit R., Montalba C., Tejos C., et al. (2015). “Self-regulation of the fusiform face area with real-time fMRI brain-computer interfaces in autism spectrum disorders,” in Munich Neurophysiology Conference 2015, Annual Joint Meeting of ECNS, ISNIP and ISBET (Munich: SAGE Publications; ). 10.1177/1550059415622686. [DOI] [Google Scholar]
- Pierce K., Haist F., Sedaghat F., Courchesne E. (2004). The brain response to personally familiar faces in autism: findings of fusiform activity and beyond. Brain 127 2703–2716. 10.1093/brain/awh289 [DOI] [PubMed] [Google Scholar]
- Pierce K., Müller R. A., Ambrose J., Allen G., Courchesne E. (2001). Face processing occurs outside the fusiform “face area” in autism: evidence from functional MRI. Brain 124 2059–2073. 10.1093/brain/124.10.2059 [DOI] [PubMed] [Google Scholar]
- Ramot M., Kimmich S., Gonzalez-Castillo J., Roopchansingh V., Popal H., White E., et al. (2017). Direct modulation of aberrant brain network connectivity through real-time NeuroFeedback. eLife 6:e28974. 10.7554/elife.28974 [DOI] [PMC free article] [PubMed] [Google Scholar]
- Rane P., Cochran D., Hodge S. M., Haselgrove C., Kennedy D. N., Frazier J. A. (2015). Connectivity in Autism: a review of MRI connectivity studies. Harv. Rev. Psychiatry 23 223–244. 10.1097/HRP.0000000000000072 [DOI] [PMC free article] [PubMed] [Google Scholar]
- Riva D. (2000). The cerebellum contributes to higher functions during development: evidence from a series of children surgically treated for posterior fossa tumours. Brain 123 1051–1061. 10.1093/brain/123.5.1051 [DOI] [PubMed] [Google Scholar]
- Riveros R., Sepúlveda A., Figueroa P., Rosas R. (2015). Memoria de Trabajo y Atención Pueden ser Usados Como un Nuevo Test de Screening de Inteligencia. Available at: http://descargas.cedeti.cl/2015/06/N°4-FIX-OI-PAPELES-ABRIL-15.pdf (accessed March 30, 2017). [Google Scholar]
- Rogers S. J., Bennetto L. (2000). “Intersubjectivity in autism: the roles of imitation and executive function,” in Autism Spectrum Disorders: A Transactional Developmental Perspective, eds Wetherby A., Prizant B. (Baltimore, MD: Paul H. Brookes; ), 79–107. [Google Scholar]
- Rosas R., Tenorio M., Pizarro M., Cumsille P., Bosch A., Arancibia S., et al. (2014). Estandarización de la escala wechsler de inteligencia para adultos-cuarta edición en chile. Psykhe 23 1–18. 10.7764/psykhe.23.1.529 [DOI] [Google Scholar]
- Ruiz S., Birbaumer N., Sitaram R. (2013a). Abnormal neural connectivity in schizophrenia and fMRI-brain-computer interface as a potential therapeutic approach. Front. Psychiatry 4:17. 10.3389/fpsyt.2013.00017 [DOI] [PMC free article] [PubMed] [Google Scholar]
- Ruiz S., Lee S., Soekadar S. R., Caria A., Veit R., Kircher T., et al. (2013b). Acquired self-control of insula cortex modulates emotion recognition and brain network connectivity in schizophrenia. Hum. Brain Mapp. 34 200–212. 10.1002/hbm.21427 [DOI] [PMC free article] [PubMed] [Google Scholar]
- Ruiz S., Buyukturkoglu K., Rana M., Birbaumer N., Sitaram R. (2014). Real-time fMRI brain computer interfaces: self-regulation of single brain regions to networks. Biol. Psychol. 95 4–20. 10.1016/j.biopsycho.2013.04.010 [DOI] [PubMed] [Google Scholar]
- Rutter M., Bailey A., Lord C. (2003). The Social Communication Questionnaire: Manual. Los Angeles, CA: Western Psychological Services. [Google Scholar]
- Salman M. S., Tsai P. (2016). The role of the pediatric cerebellum in motor functions, cognition, and behavior: a clinical perspective. Neuroimaging Clin. N. Am. 26 317–329. 10.1016/j.nic.2016.03.003 [DOI] [PMC free article] [PubMed] [Google Scholar]
- Santos A., Rondan C., Rosset D. B., Da Fonseca D., Deruelle C. (2008). Mr. Grimace or Ms. Smile: does categorization affect perceptual processing in autism?. Psychol. Sci. 19 70–76. 10.1111/j.1467-9280.2008.02048.x [DOI] [PubMed] [Google Scholar]
- Scherf K. S., Luna B., Minshew N., Behrmann M. (2010). Location, location, location: alterations in the functional topography of face- but not object- or place-related cortex in adolescents with autism. Front. Hum. Neurosci. 4:26. 10.3389/fnhum.2010.00026 [DOI] [PMC free article] [PubMed] [Google Scholar]
- Schultz W. (2016). Reward functions of the basal ganglia. J. Neural Transm. 123 679–693. 10.1007/s00702-016-1510-1510 [DOI] [PMC free article] [PubMed] [Google Scholar]
- Scott-Van Zeeland A. A., Dapretto M., Ghahremani D. G., Poldrack R. A., Bookheimer S. Y. (2010). Reward processing in autism. Autism Res. 3 53–67. 10.1002/aur.122 [DOI] [PMC free article] [PubMed] [Google Scholar]
- Sepulveda P., Sitaram R., Rana M., Montalba C., Tejos C., Ruiz S. (2016). How feedback, motor imagery, and reward influence brain self-regulation using real-time fMRI. Hum. Brain Mapp. 37 3153–3171. 10.1002/hbm.23228 [DOI] [PMC free article] [PubMed] [Google Scholar]
- Shih J. J., Krusienski D. J., Wolpaw J. R. (2012). Brain-computer interfaces in medicine. Mayo Clin. Proc. 87 268–279. 10.1016/j.mayocp.2011.12.008 [DOI] [PMC free article] [PubMed] [Google Scholar]
- Simion F., Giorgio E. D. (2015). Face perception and processing in early infancy: inborn predispositions and developmental changes. Front. Psychol. 6:969. 10.3389/fpsyg.2015.00969 [DOI] [PMC free article] [PubMed] [Google Scholar]
- Sitaram R., Caria A., Veit R., Gaber T., Rota G., Kuebler A., et al. (2007). FMRI brain-computer interface: a tool for neuroscientific research and treatment. Comput. Intell. Neurosci. 2007:25487. 10.1155/2007/25487 [DOI] [PMC free article] [PubMed] [Google Scholar]
- Sitaram R., Lee S., Ruiz S., Rana M., Veit R., Birbaumer N. (2011). Real-time support vector classification and feedback of multiple emotional brain states. Neuroimage 56 753–765. 10.1016/j.neuroimage.2010.08.007 [DOI] [PubMed] [Google Scholar]
- Sitaram R., Ros T., Stoeckel L., Haller S., Scharnowski F., Lewis-Peacock J., et al. (2017). Closed-loop brain training: the science of neurofeedback. Nat. Rev. Neurosci. 18 86–100. 10.1038/nrn.2016.164 [DOI] [PubMed] [Google Scholar]
- Sulzer J., Haller S., Scharnowski F., Weiskopf N., Birbaumer N., Blefari M. L., et al. (2013). Real-time fMRI neurofeedback: progress and challenges. Neuroimage 76 386–399. 10.1016/j.neuroimage.2013.03.033 [DOI] [PMC free article] [PubMed] [Google Scholar]
- Supekar K., Uddin L. Q., Khouzam A., Phillips J., Gaillard W. D., Kenworthy L. E., et al. (2013). Brain hyperconnectivity in children with autism and its links to social deficits. Cell Rep. 5 738–747. 10.1016/j.celrep.2013.10.001 [DOI] [PMC free article] [PubMed] [Google Scholar]
- Swick D., Ashley V., Turken A. U. (2008). Left inferior frontal gyrus is critical for response inhibition. BMC Neurosci. 9:102. 10.1186/1471-2202-9-102 [DOI] [PMC free article] [PubMed] [Google Scholar]
- Thom N. J., Johnson D. C., Flagan T., Simmons A. N., Kotturi S. A., Van Orden K. F., et al. (2014). Detecting emotion in others: increased insula and decreased medial prefrontal cortex activation during emotion processing in elite adventure racers. Soc. Cogn. Affect. Neurosci. 9 225–231. 10.1093/scan/nss127 [DOI] [PMC free article] [PubMed] [Google Scholar]
- Tong F., Nakayama K., Moscovitch M., Weinrib O., Kanwisher N. (2000). Response properties of the human fusiform face area. Cogn. Neuropsychol. 17 257–280. 10.1080/026432900380607 [DOI] [PubMed] [Google Scholar]
- Tzourio-Mazoyer N., Landeau B., Papathanassiou D., Crivello F., Etard O., Delcroix N., et al. (2002). Automated anatomical labeling of activations in SPM using a macroscopic anatomical parcellation of the MNI MRI single-subject brain. Neuroimage 15 273–289. 10.1006/nimg.2001.0978 [DOI] [PubMed] [Google Scholar]
- Varcin K. J., Nelson C. A. (2016). A developmental neuroscience approach to the search for biomarkers in autism spectrum disorder. Curr. Opin. Neurol. 29 123–129. 10.1097/WCO.0000000000000298 [DOI] [PMC free article] [PubMed] [Google Scholar]
- Verosky S. C., Turk-Browne N. B. (2012). Representations of Facial Identity in the Left Hemisphere Require Right Hemisphere Processing. Available at: https://ntblab.yale.edu/wp-content/uploads/2015/01/Verosky_JOCN_2012.pdf (accessed December 18, 2018). 10.1162/jocn_a_00196 [DOI] [PMC free article] [PubMed] [Google Scholar]
- Von Der Heide R. J., Skipper L. M., Olson I. R. (2013). Anterior temporal face patches: a meta-analysis and empirical study. Front. Hum. Neurosci. 7:17. 10.3389/fnhum.2013.00017 [DOI] [PMC free article] [PubMed] [Google Scholar]
- Watson T. C., Becker N., Apps R., Jones M. W. (2014). Back to front: cerebellar connections and interactions with the prefrontal cortex. Front. Syst. Neurosci. 8:4. 10.3389/fnsys.2014.00004 [DOI] [PMC free article] [PubMed] [Google Scholar]
- Weigelt S., Koldewyn K., Kanwisher N. (2012). Face identity recognition in autism spectrum disorders: a review of behavioral studies. Neurosci. Biobehav. Rev. 36 1060–1084. 10.1016/j.neubiorev.2011.12.008 [DOI] [PubMed] [Google Scholar]
- Weiskopf N. (2012). Real-time fMRI and its application to neurofeedback. Neuroimage 62 682–692. 10.1016/j.neuroimage.2011.10.009 [DOI] [PubMed] [Google Scholar]
- Weiskopf N., Mathiak K., Bock S. W., Scharnowski F., Veit R., Grodd W., et al. (2004). Principles of a brain-computer interface (BCI) based on real-time functional magnetic resonance imaging (fMRI). IEEE Trans. Biomed. Eng. 51 966–970. 10.1109/TBME.2004.827063 [DOI] [PubMed] [Google Scholar]
- Weiskopf N., Veit R., Erb M., Mathiak K., Grodd W., Goebel R., et al. (2003). Physiological self-regulation of regional brain activity using real-time functional magnetic resonance imaging (fMRI): methodology and exemplary data. Neuroimage 19 577–586. 10.1016/s1053-8119(03)00145-9 [DOI] [PubMed] [Google Scholar]
- Weiss J. A., Lunsky Y. (2011). The brief family distress scale: a measure of crisis in caregivers of individuals with autism spectrum disorders. J. Child Fam. Stud. 20 521–528. 10.1007/s10826-010-9419-y [DOI] [Google Scholar]
- Werling D. M., Geschwind D. H. (2013). Sex differences in autism spectrum disorders. Curr. Opin. Neurol. 26 146–153. 10.1097/WCO.0b013e32835ee548 [DOI] [PMC free article] [PubMed] [Google Scholar]
- Whitfield-Gabrieli S., Nieto-Castanon A. (2012). Conn: a functional connectivity toolbox for correlated and anticorrelated brain networks. Brain Connect. 2 125–141. 10.1089/brain.2012.0073 [DOI] [PubMed] [Google Scholar]
- Wilson C. E., Freeman P., Brock J., Burton A. M., Palermo R. (2010). Facial identity recognition in the broader autism phenotype. PLoS One 5:e12876. 10.1371/journal.pone.0012876 [DOI] [PMC free article] [PubMed] [Google Scholar]
- Yirmiya N., Sigman M. D., Kasari C., Mundy P. (1992). Empathy and cognition in high-functioning children with autism. Child Dev. 63 150–160. 10.2307/1130909 [DOI] [PubMed] [Google Scholar]
- Zhen Z., Fang H., Liu J. (2013). The hierarchical brain network for face recognition. PLoS One 8:e59886. 10.1371/journal.pone.0059886 [DOI] [PMC free article] [PubMed] [Google Scholar]
- Zotev V., Krueger F., Phillips R., Alvarez R. P., Simmons W. K., Bellgowan P., et al. (2011). Self-regulation of amygdala activation using real-time fMRI neurofeedback. PLoS One 6:e24522. 10.1371/journal.pone.0024522 [DOI] [PMC free article] [PubMed] [Google Scholar]
Associated Data
This section collects any data citations, data availability statements, or supplementary materials included in this article.
Supplementary Materials
Data Availability Statement
All datasets generated for this study are included in the article/Supplementary Material.