Abstract
Neural crest cells are an embryonic cell population that is crucial for proper vertebrate development. Initially localized to the dorsal neural folds, premigratory neural crest cells undergo an epithelial-tomesenchymal transition (EMT) and migrate to their final destinations in the developing embryo. Together with epidermally-derived placode cells, neural crest cells then form the cranial sensory ganglia of the peripheral nervous system. Our prior work has shown that αN-catenin, the neural subtype of the adherens junction α-catenin protein, regulates cranial neural crest cell EMT by controlling premigratory neural crest cell cadherin levels. Although αN-catenin down-regulation is critical for initial neural crest cell EMT, a potential role for αN-catenin in later neural crest cell migration, and formation of the cranial ganglia, has not been examined. In this study, we show for the first time that migratory neural crest cells that will give rise to the cranial trigeminal ganglia express αN-catenin and Cadherin-7. αN-catenin loss-and gain-of-function experiments reveal effects on the migratory neural crest cell population that include subsequent defects in trigeminal ganglia assembly. Moreover, αN-catenin perturbation in neural crest cells impacts the placode cell contribution to the trigeminal ganglia and also changes neural crest cell Cadherin-7 levels and localization. Together, these results highlight a novel function for αN-catenin in migratory neural crest cells that form the trigeminal ganglia.
Keywords: Neural crest, Placode, Trigeminal ganglia, Cadherins, Catenins
Introduction
Consisting of neuronal and glial cells within the sensory component of the trigeminal (V), facial (VII), glossopharyngeal(IX), and vagal (X) cranial nerves, cranial ganglia collectively mediate several critical functions, including somatosensation (temperature, pain, touch), taste, and the visceral sensation of internal organs such as the heart, lungs and gastrointestinal tract. The intermingling and coalescing of two distinct cell populations, neural crest cells and placode cells, is required for the formation of these cranial ganglia (Blentic et al., 2011; D’Amico-Martel, 1982; D’Amico-Martel and Noden, 1983; Hamburger, 1961; Jidigam and Gunhaga, 2013; Saint-Jeannet and Moody, 2014; Shiau et al., 2008; Steventon et al., 2014; Theveneau et al., 2013). Neural crest cells are multi-potent cells that give rise to a variety of cell types in the developing vertebrate embryo. Upon reaching their destination, cranial neural crest cells will differentiate into structures such as the craniofacial skeleton and sensory ganglia of the peripheral nervous system, dependent upon molecular cues received from the surrounding tissue and their axial level of origin (Mayor and Theveneau, 2013; Sauka-Spengler and Bronner, 2010). Epidermal placode cells arise at the border of the developing neural plate in distinct rostro-caudal positions. These paired localized ectodermal thickenings in the vertebrate head give rise to cranial sense organs, such as the ear and nose, and contribute to the cranial sensory nerves (Jidigam and Gunhaga, 2013; Saint-Jeannet and Moody, 2014; Steventon et al., 2014). Importantly, neural crest cells are thought to provide the scaffolding with which placode cells interact to form the cranial ganglia, while placode cells facilitate neural crest cell coalescence (Shiau et al., 2008). Not surprisingly, the proper intermixing of neural crest cells and placode cells to create the cranial ganglia relies on complex molecular interactions in which neural crest cells, through a “chase and run” mechanism involving Sdf1 and planar cell polarity and N-cadherin signaling, generate “corridors” upon which placode cells migrate (Freter et al., 2013; Theveneau et al., 2013). Other known molecules that function during ganglia formation include N-cadherin in placode cells (Shiau and Bronner-Fraser, 2009), Neuropilin 2/Semaphorin 3F signaling in neural crest cells (Gammill et al., 2007), and Slit1/Robo2 signaling between neural crest cells and placode cells (Shiau et al., 2008). Given these findings, it is likely that adherens junctions play an important role in mediating neural crest cell and placode cell interactions to form the ganglia, but their components in cranial neural crest cells have yet to be identified.
αN-catenin is a critical mediator of cadherin function as part of the apically-localized adherens junctions and promotes the creation of multi-cellular structures (Hirano et al., 1992; Watabe et al., 1994). Our prior work defined a function for αN-catenin in cranial neural crest cell EMT, with αN-catenin down-regulation occurring during neural crest cell EMT and in early emigrating neural crest cells (Jhingory et al., 2010). Moreover, αN-catenin depletion or overexpression enhances or inhibits neural crest cell EMT/migration, respectively, in part due to loss or maintenance of premigratory neural crest cell cadherins. In chick and mouse, αN-catenin is expressed in a tissue-specific manner, most highly in central and peripheral nervous system structures (Uchida et al., 1994; Uemura and Takeichi, 2006). αN-catenin knock-out mice possess aberrant axon pathfinding and cranial ganglia morphology (Park et al., 2002a) as well as abnormal localization of Purkinje cells, which form loosened adhesions with their targets (Park et al., 2002b; Shimoyama et al., 1992). As such, it is likely that αN-catenin plays a later role in the development of neural crest-derived structures such as the cranial ganglia.
One of the best-characterized cranial ganglia is the trigeminal ganglia due to their large size and accessibility. The proximal regions of these ganglia, as well as all glial cells that envelop their axons, are of neural crest cell origin, while the placodes contribute to more distal portions (D’Amico-Martel and Noden, 1983; Hamburger, 1961). Using the chick trigeminal ganglia as a model, we investigated whether αN-catenin plays a role in neural crest cells during their migration and intermixing with placode cells to form the trigeminal ganglia. Our results reveal that αN-catenin is expressed by Cadherin-7-positive migratory neural crest cells, and that αN-catenin levels in neural crest cells must be tightly regulated in order to generate proper trigeminal ganglia morphology. Both αN-catenin depletion and overexpression in neural crest cells disrupts this process, leading to quantitative changes in the migratory neural crest cell domain that will give rise to the trigeminal ganglion and subsequent effects on ganglion assembly. Furthermore, αN-catenin perturbation in neural crest cells leads to changes in the number or distribution of placode cells contributing to the ganglion and alters levels of neural crest cell Cadherin-7. Given the requirement for neural crest cells to associate with placode cells to form cranial ganglia, our results on αN-catenin may be translatable to the formation of other cranial ganglia. Collectively, our data highlight a novel role for αN-catenin in migratory neural crest cells that interact with placode cells to form the trigeminal ganglia.
Results
αN-catenin is expressed by Cadherin-7-positive migratory neural crest cells
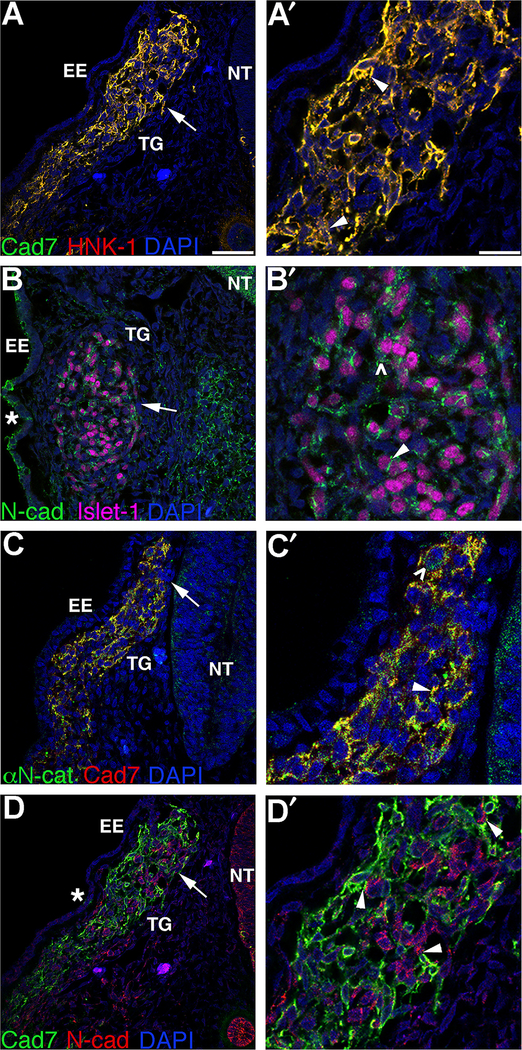
To determine whether αN-catenin plays a role in migratory neural crest cells that will form peripheral nervous system structures such as the trigeminal ganglia, we sought to identify the distribution of it, along with any cadherins with which it might indirectly interact, through immunohistochemistry (Jhingory et al., 2010; Nakagawa and Takeichi, 1998). In the developing trigeminal ganglia, we note that Cadherin-7 protein is present in migratory cranial neural crest cells, as observed in the chick trunk (Nakagawa and Takeichi, 1998) and confirmed by co-staining for the migratory neural crest cell marker HNK-1 (Figs. 1A,A′, arrowheads), while Islet-1-positive placode cells express N-cadherin on the cell surface and cytosol (Figs. 1B,B′, arrowhead and caret, respectively; (Shiau and Bronner-Fraser, 2009)). Importantly, Cadherin-7-positive migratory neural crest cells forming the trigeminal ganglion express αN-catenin (Figs. 1C,C′, arrowhead and caret), which is observed on the membrane (Fig. 1C′, arrowhead) and in the cytosol (Fig. 1C′, caret). Finally, Cadherin-7-positive neural crest cells intermingle and condense with N-cadherin-positive placode cells during trigeminal ganglia assembly, with membranes of both cell types close apposed (Figs. 1D,D′, arrowheads). These results indicate that αN-catenin is in fact expressed in later Cadherin-7-positive migratory neural crest cells in the proper time and place to play a role neural crest cells as they coalesce with placode cells to form the trigeminal ganglia.
Fig. 1.
Migratory neural crest cells contributing to the trigeminal ganglia express Cadherin-7 and αN-catenin and closely intermingle with N-cadherin-positive placode cells. Representative transverse sections taken through a forming trigeminal ganglion in different HH14 (A,C,D) or HH16 (C) embryos following co-immunohistochemistry for(A) Cadherin-7 (Cad7, green) and HNK-1 (red); (B) N-cadherin (N-cad, green) and Islet-1 (purple); (C) αN-catenin (αN-cat, green) and Cad7 (red); and (D) Cadherin-7 (green) and N-cad (red). (A′–D′) Higher magnification of region indicated by the arrow in (A–D). Arrowheads in (A′,C′) reveal co-localization of Cadherin-7 and HNK-1, or αN-catenin and Cadherin-7, at the plasma membrane, or (B′) the presence of N-cadherin on the plasma membrane, while arrowheads in (D′) point to closely apposed Cadherin-7-positive migratory neural crest cell and N-cadherin-positive placode cell plasma membranes. Asterisks (*) in (B,D) indicate N-cadherin protein in the surface ectoderm, while carets (\widehat) in (B′,C′) point to cytosolic N-cadherin and αN-catenin protein distribution, respectively. DAPI (blue) labels cell nuclei. EE, embryonic ectoderm; NT, neural tube; TG, trigeminal ganglion. Scale bars in (A) and (A′) are 20 μm and 8 μm, respectively, and are applicable to respective images.
αN-catenin depletion expands the migratory neural crest cell domain and disrupts trigeminal ganglia morphology
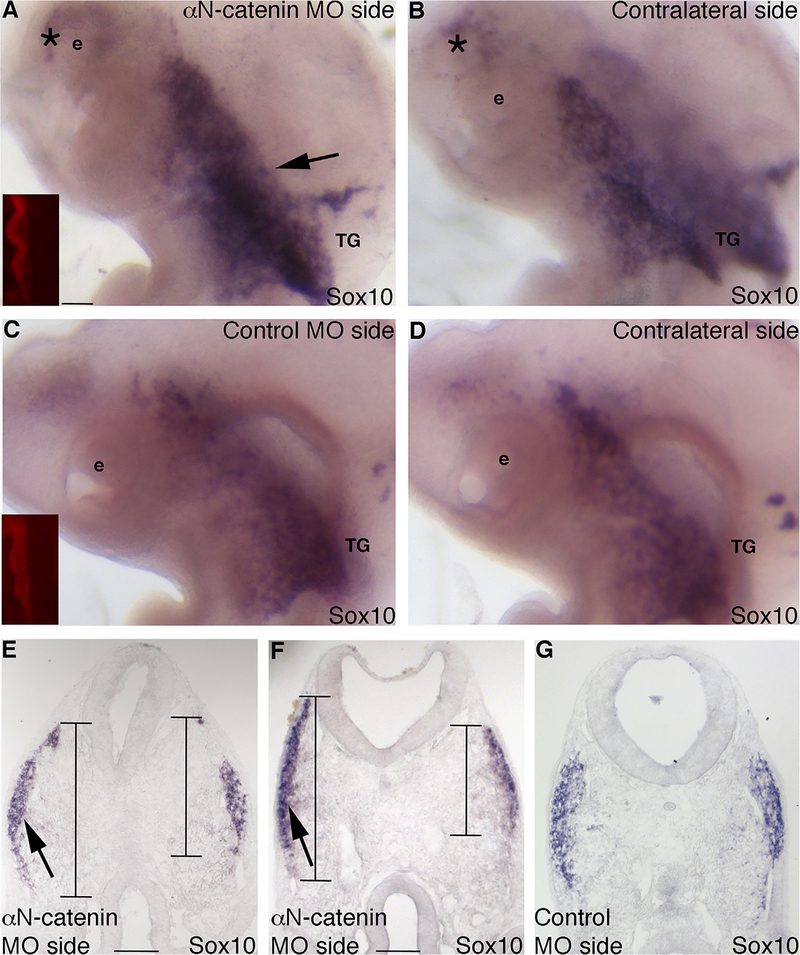
Using reagents we developed previously (Jhingory et al., 2010), we depleted αN-catenin from premigratory cranial neural crest cells just prior to their emergence from the dorsal neural tube (HH9) using a morpholino (MO), or a 5 bp mismatch control MO, and incubated embryos to Hamburger–Hamilton stage (HH) 14–17 in order to examine effects on the neural crest cell population and the forming trigeminal ganglia. Whole-mount in situ hybridization for Sox10 after αN-catenin depletion reveals an increase in the migratory neural crest cell domain contributing to the trigeminal ganglion on the treated side of the embryo (Fig. 2A, arrow; 10/10 embryos), compared to the contralateral side (Fig. 2B) and to control MO-treated embryos (Figs. 2C,D; 9/10 embryos), at all stages examined. In these treated embryos, more neural crest cells appear to move anteriorly to the ocular region upon αN-catenin knock-down (Fig. 2A; asterisk shows cells from A that are also apparent in B due to transparency of embryo). Serial sections through the forming trigeminal ganglia corroborate this and show that αN-catenin depletion expands the Sox10-positive migratory neural crest cell domain along the dorsal–ventral axis (Figs. 2E,F, arrows and lines; left side of section), compared to control MO-treated embryos (Fig. 2G), and consistent with our prior studies (Jhingory et al., 2010). Quantification of this phenotype by measuring the migrated distance along the dorsal–ventral domain length (indicated by the lines in (E,F)) through serial sections reveals a slight increase upon αN-catenin depletion (average length of the αN-catenin MO side: 550 ± 28; average length of the contralateral side: 459 ± 25; 1.2-fold difference, p=0.019; Supp. Table 1).
Fig. 2.
Morpholino-mediated depletion of αN-catenin expands the dorsal–ventral domain of migratory neural crest cells forming the trigeminal ganglion in vivo. (A,B) Representative image of a lateral view of an embryo head following whole-mount in situ hybridization for Sox10 after electroporation with αN-catenin MO and re-incubation to HH15. (A) MO-treated and (B) contralateral sides. Inset image in (A) shows red fluorescence of the electroporated MO on the left side of the neural tube that is not visible after in situ hybridization at this later stage. Arrow in (A) indicates an increased Sox10-positive migratory neural crest cell domain on the MO-treated side that is not observed on the contralateral side (B) of the same embryo. Asterisk (*) in (A,B) points to neural crest cells entering the ocular region on the MO-treated side that are observed on the contralateral control side due to the transparency of the embryo. (C,D) Representative image of a lateral view of an embryo head following whole-mount in situ hybridization for Sox10 after electroporation with αN-catenin control MO (control MO) and re-incubation to HH15. (C) MO-treated and (D) contralateral sides. Inset image in (C) shows red fluorescence of the electroporated MO on the left side of the neural tube that is not visible after in situ hybridization at this later stage. (E–G) Representative transverse sections taken at the axial level of the developing trigeminal ganglia after αN-catenin (E,F) or control (G) MO electroporation, re-incubation of the embryo to HH14 (E) or HH15 (F,G), and Sox10 whole-mount in situ hybridization. Arrows and lines in (E,F) reveal a dorsal–ventral expansion of the migratory neural crest cell domain on the electroporated side of the embryo (left) compared to the contralateral side of the same section (right), with no change in domain size observed in the control (G). e, eye; TG, trigeminal ganglion. Scale bars in all images are 100 μm, with scale bar in (A) applicable to (B–D) and scale bar in (F) applicable to (G).
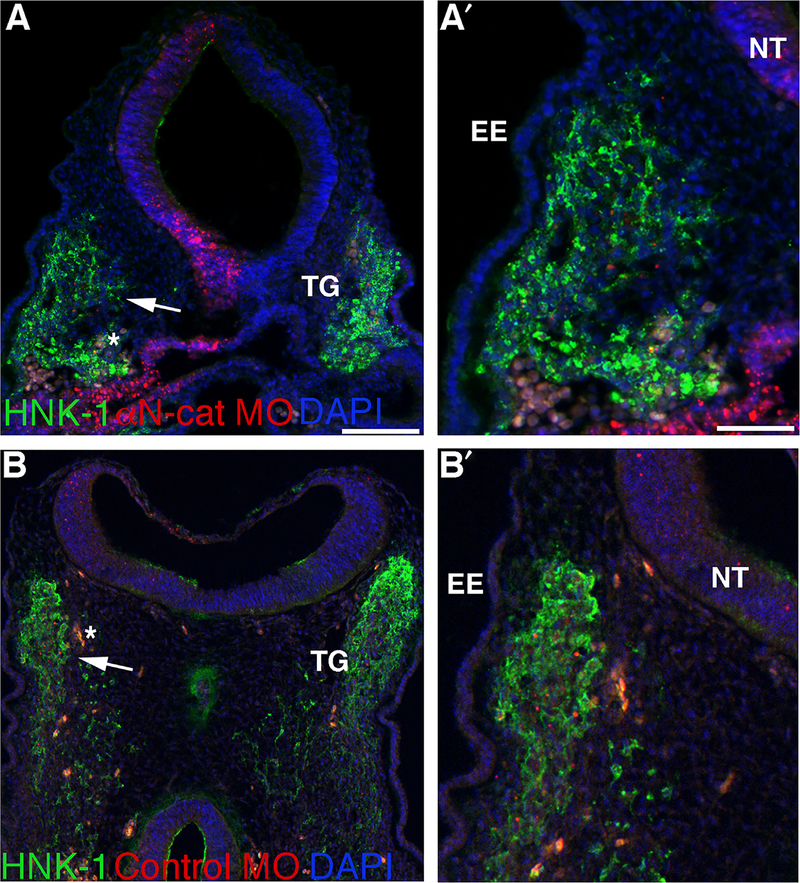
We next examined migratory neural crest cells by performing HNK-1 immunohistochemistry (Fig. 3). In keeping with the Sox10 data, the trigeminal ganglion on the αN-catenin MO-treated side appeared larger than that observed on the contralateral side (compare left (where MO-positive cells are present) and right sides of Fig. 3A; higher magnification image indicated by arrow is shown in A′; 7/7 embryos) and in control MO-treated embryos (Fig. 3B, left side; B′ is higher magnification image indicated by arrow; 7/8 embryos). To quantify this difference, we manually outlined the region occupied by HNK-1-positive neural crest cells forming the trigeminal ganglia, on both the experimental and contralateral control sides of serial sections, after MO-mediated knock-down of αN-catenin, and then calculated the area (Adobe Photoshop; see Supp. Table 2 for measurements). In younger embryos (HH13–14), we find a statistically significant increase in the area occupied by migratory neural crest cells contributing to the trigeminal ganglion upon αN-catenin depletion (αN-catenin MO side: 54,193 ± 4340; contralateral side: 35,655 ± 3626; 1.5-fold, p = 0.0025). Embryos at slightly later stages (HH15–17) also reveal a statistically significant increase (αN-catenin MO side: 214,359 ± 15928; contralateral side: 163,524 ± 16682; 1.3-fold, p = 0.032). These results demonstrate that the size of the migratory neural crest cell domain is affected upon αN-catenin depletion, which could then potentially impact later trigeminal ganglia assembly.
Fig. 3.
Morpholino-mediated depletion of αN-catenin increases the migratory neural crest cell contribution to the forming trigeminal ganglion in vivo. (A,B) Representative transverse sections taken at the axial level of the forming trigeminal ganglia of an HH15+ (A,A′) and HH15 (B,B′) embryo following αN-catenin (A) or control (B) MO (red) electroporation earlier in development and HNK-1 (green) immunohistochemistry after re-incubation. Arrows in (A,B) point to the region shown at higher magnification in (A′,B′). DAPI (blue) labels cell nuclei in all images. Asterisk (*) in (A,B) indicates blood cells. EE, embryonic ectoderm; NT, neural tube; TG, trigeminal ganglion. Scale bars in(A) and (A′) are 100 and 50 μm, respectively, and applicable to (B) and (B′).
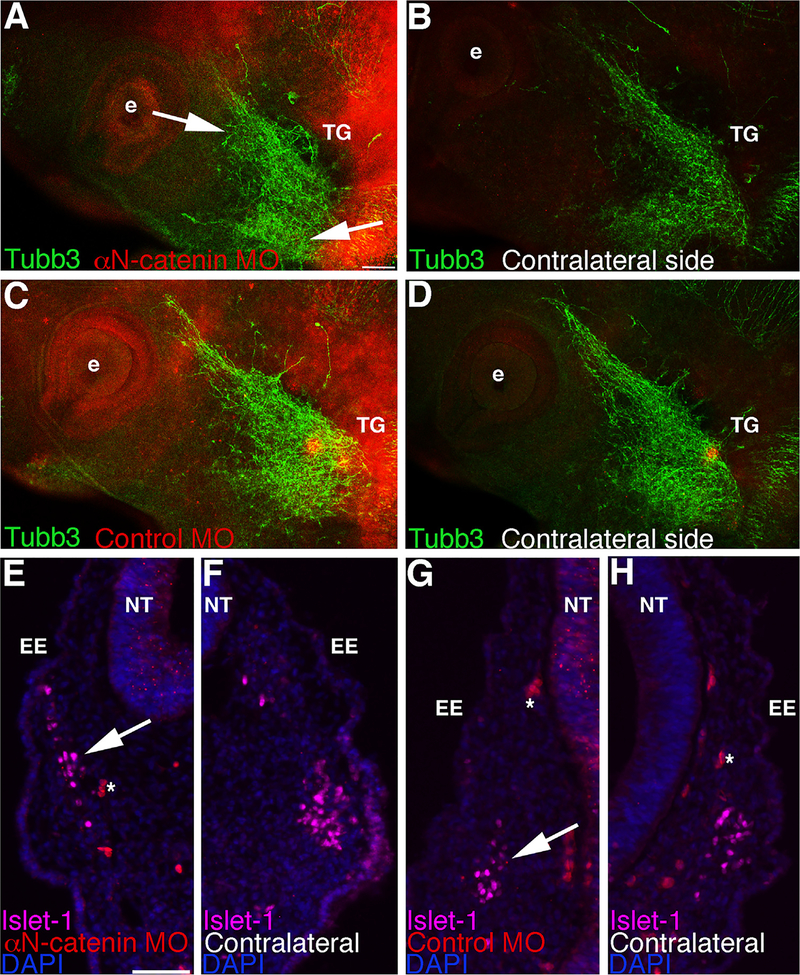
Migratory neural crest cells must coalesce with placode cells to form the cranial ganglia. As such, it is possible that perturbing molecules in neural crest cells could alter neural crest cell–placode cell interactions and therefore adversely impact ganglia formation. To evaluate gross effects on trigeminal ganglion morphology and give insight to potential effects on placode cell-derived neuronal contributions to the ganglia after αN-catenin knock-down, we performed whole-mount immunohistochemistry for Tubb3 (TuJ1 antibody). Because neural crest-derived neurons do not exit the cell cycle and differentiate into neurons until much later than the stages we are examining (HH19+), any neurons that are found in the trigeminal ganglion prior to this that are positive for Tubb3 should be placode-derived (Begbie et al., 2002; Blentic et al., 2011; D’Amico-Martel, 1982; D’Amico-Martel and Noden, 1980, 1983; Shiau et al., 2008; Shiau and Bronner-Fraser, 2009). Upon αN-catenin depletion in neural crest cells (noted by the MO-positive cells in the ganglion-forming region), placode-derived neurons within the ganglion were altered in appearance (Fig. 4A; 14/15 embryos), compared to the contralateral side (Fig. 4B) and to control MO-treated embryos (Figs. 4C,D; 10/12 embryos). In general, Tubb3-positive neurons appear less condensed (Fig. 4A, arrows) and do not extend as far anteriorly towards the eye. Moreover, immunohistochemistry for Islet-1 reveals that placode cells are qualitatively more spread out (Fig. 4E, arrow; 11/11 embryos), compared to the control side of the treated embryo (Fig. 4F) and to control MO-treated embryos (Figs. 4G,H, arrow; 3/3 embryos). Although the total number of Islet-1-positive placode cells was not significantly different when compared to the contralateral side of the same embryo (αN-catenin MO side: 85 ± 5; contralateral side: 86 ± 6; p = 0.99), there was a reduction in the number of placode cells per given measured area within the trigeminal ganglion (αN-catenin MO side: 27 ± 2; contralateral side: 36 ± 3; 1.3-fold decrease; p = 0.033; 8 embryos examined). These results suggest that placode cells are more dispersed within the forming trigeminal ganglion upon αN-catenin knock-down.
Fig. 4.
Morpholino-mediated depletion of αN-catenin in cranial neural crest cells impacts the formation of placode-derived neurons and the distribution of placode cells during trigeminal ganglion assembly. (A–D) Representative images of a lateral view of two HH16 embryo heads following whole-mount immunohistochemistry for Tubb3 (green) after unilateral electroporation earlier in development with the αN-catenin (A) or control (C) MO (red) and re-incubation. (B,D) Contralateral sides of respective embryos. Arrows in (A) point to defects in ganglion assembly (truncated and more dispersed axons) on the MO-treated side that is not observed on the contralateral side of the same embryo (B) or in control MO-treated embryos (C,D). (E–H) Representative transverse sections taken at the axial level of the forming trigeminal ganglia of two HH14 embryos following αN-catenin (E) or control (G) MO electroporation (both red) of neural crest cells earlier in development, re-incubation, and Islet-1 (purple) immunohistochemistry. (F,H) Contralateral sides of (E,G), respectively, at the same axial level. Arrow in (E) reveals more dispersed placode cells on the MO-treated side compared to the contralateral side (F) of the same section and to a section from a control MO-treated embryo (G,H, arrow). DAPI (blue) labels cell nuclei in (E–H). Asterisk (*) in (E,G,H) indicates blood cells. e, eye; EE, embryonic ectoderm; NT, neural tube; TG, trigeminal ganglion. Scale bar in (A) is 100 μm and applicable to (B-D). Scale bar in (E) is 50 μm and applicable to (F–H).
To rule out any non-specific effects that might lead to these phenotypes, we analyzed αN-catenin or control MO-treated embryos for effects on cell proliferation (phospho-histone H3 immunohistochemistry) and cell death (TUNEL) in serial sections through the developing trigeminal ganglia (Supp. Fig. 1), as in our prior work (Jhingory et al., 2010). We observe no change in phospho-histone H3 immunostaining between the experimental and contralateral sides of control MO- (Supp. Figs. 1A, B, arrowheads; control MO side: 12 ± 1 cell, contralateral side: 12 ± 1 cell; 5/5 embryos) and αN-catenin MO-treated (Supp. Figs. 1C, D, arrowheads; αN-catenin MO side: 13 ± 2 cells, contralateral side: 12 ± 1 cell; 5/6 embryos) embryo sections. Furthermore, we note no difference in cell death after either MO treatment (Supp. Figs. 1E, F, arrowheads; control MO side: 19 ± 2 cells; contralateral side: 19 ± 2 cells, 5/5 embryos; Supp. Figs. 1G, H, arrowheads; αN-catenin MO side: 11 ± 1 cell; contralateral side: 12 ± 1 cell; 6/7 embryos). Collectively, these results indicate that abnormalities in trigeminal ganglion assembly upon αN-catenin knock-down are not due to alterations in cell proliferation or death but are instead likely due to effects on the migratory neural crest cell population that subsequently intermingles with placode cells to form the trigeminal ganglia.
αN-catenin overexpression reduces the size of the migratory neural crest cell domain and alters trigeminal ganglia assembly
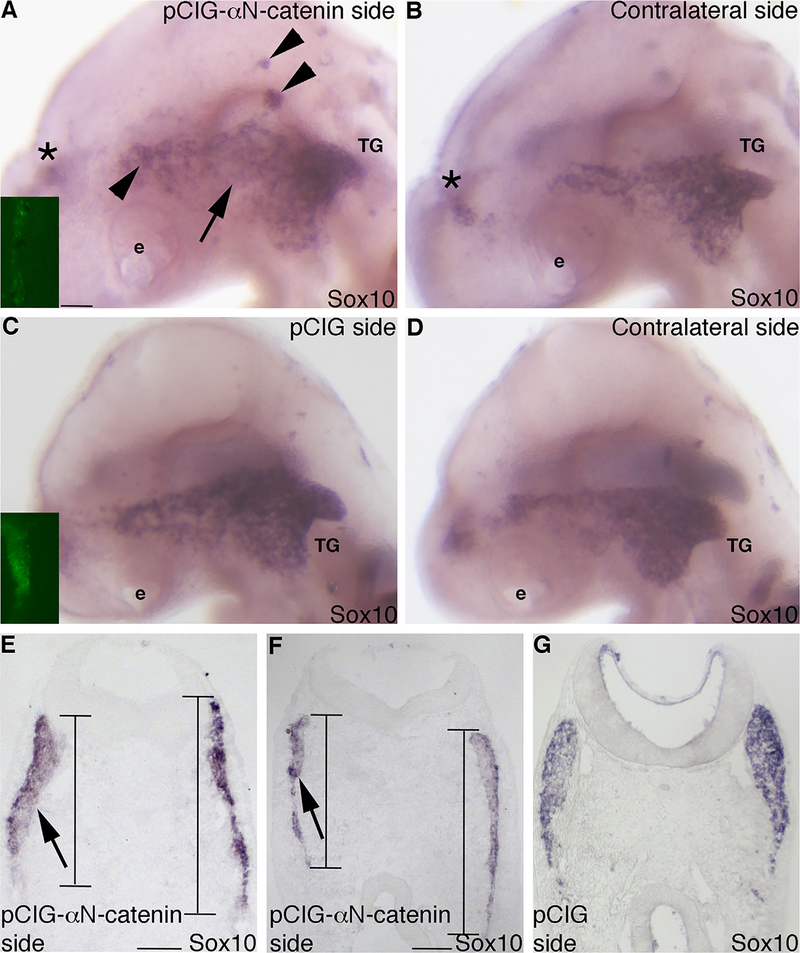
To confirm our knock-down results, we overexpressed αN-catenin in neural crest cells just prior to their emergence from the dorsal neural tube (HH9) using the pCIG-αN-catenin construct we generated previously, which contains an IRES-GFP to label electroporated cells (Jhingory et al., 2010). Because it takes approximately 6 h to express αN-catenin from the plasmid (our observations; see also (Jhingory et al., 2010)), we can target αN-catenin in neural crest cells at later stages during their migration (HH10 and beyond). Detection of migratory neural crest cells through Sox10 whole-mount in situ hybridization indicates changes in neural crest cells contributing to the trigeminal ganglion (Figs. 5A, 9/10 embryos), compared to the contralateral side (Fig. 5B) and in pCIG control-treated embryos (Figs. 5C,D; 8/9 embryos). Although neural crest cells are observed in the ganglion-forming region, we observe a general decrease in Sox10, indicating a potential reduction in neural crest cells in this region (Fig. 5A, arrow). We also note aggregates of neural crest cells within and outside of the ganglion-forming region (Fig. 5A, arrowheads). These phenotypes are consistent with what we have observed previously (Jhingory et al., 2010). In keeping with our observations, serial sections through the forming trigeminal ganglion show a decreased Sox10-positive migratory neural crest cell domain (Figs. 5E,F, arrows and lines; left side of section), compared to pCIG-treated embryos (Fig. 5G). Quantification of this phenotype reveals that the dorsal–ventral domain length of migratory neural crest cells is greater on the contralateral side compared to the side in which αN-catenin has been overexpressed (average length of the contralateral side: 687 ± 45; average length of the pCIG-αN-catenin-treated side: 522 ± 52; 1.3-fold difference, p = 0.020; Supp. Table 3). These results suggest that the size of the migratory neural crest cell domain is affected upon αN-catenin overexpression, which could lead to later effects on trigeminal ganglia assembly.
Fig. 5.
Overexpression of αN-catenin reduces the dorsal–ventral domain of migratory neural crest cells forming the trigeminal ganglion in vivo. (A,B) Representative image of a lateral view of an embryo head following whole-mount in situ hybridization for Sox10 after electroporation with the pCIG-αN-catenin expression construct and re-incubation to HH16. (A) Expression construct-treated and (B) contralateral side. Inset image in (A) shows GFP fluorescence of the electroporated expression construct on the left side of the neural tube that is not visible after in situ hybridization at this later stage. Arrow in (A) indicates a reduction in neural crest cells where they are normally apparent on the contralateral side (B) of the same embryo. Arrowheads in (A) point to Sox10-positive migratory neural crest cell aggregates. Asterisk (*) in (A,B) labels neural crest cells on the contralateral side of the embryo that are apparent due to the transparent nature of the embryo. (C,D) Representative image of a lateral view of an embryo head following whole-mount in situ hybridization for Sox10 after electroporation with the pCIG expression construct and re-incubation to HH15. (C) Expression construct-treated and (D) contralateral side. Inset image in (C) shows GFP fluorescence of the electroporated construct on the left side of the neural tube that is not visible after in situ hybridization at this later stage. (E–G) Representative transverse sections taken at the axial level of the developing trigeminal ganglia after pCIG-αN-catenin (E,F) or pCIG(G) expression construct electroporation, re-incubation of the embryo to HH16 (E,F) or HH14 (G), and Sox10 whole-mount in situ hybridization. Arrows and lines in (E,F) reveal a dorsal–ventral reduction of the migratory neural crest cell domain on the electroporated side of the embryo (left) compared to the contralateral side of the same section (right), with no change in domain size observed in the control (G). e, eye; TG, trigeminal ganglion. Scale bars in all images are 100 μm, with scale bar in (A) applicable to (B–D) and scale bar in (E) applicable to (G).
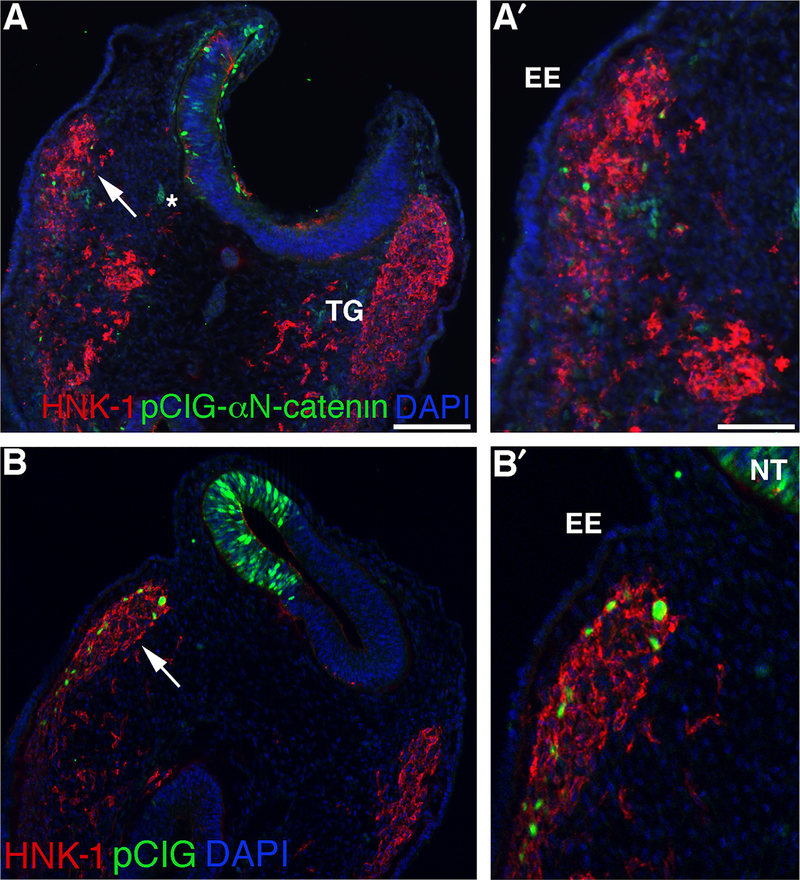
Immunostaining for HNK-1 was also performed on treated embryos to examine the contribution of migratory neural crest cells to the ganglion. These experiments revealed the formation of a generally smaller ganglion upon αN-catenin overexpression compared to the contralateral side (Fig. 6A, compare left (containing GFP-positive cells) and right sides of section; A′ is higher magnification of ganglion-forming region indicated by arrow; 8/8 embryos). This effect was not observed in pCIG-treated embryos (Fig. 6B; B′ is higher magnification of region indicated by arrow; 11/13 embryos). To quantify this phenotype, we carried out a similar area analysis as conducted for our MO data (Supp. Table 4). In younger embryos (HH13–14), we find that αN-catenin overexpression reduces the area occupied by neural crest cells contributing to the trigeminal ganglion (pCIG-αN-catenin side: 31,594 ± 2448; contralateral side: 47,474 ± 3626; 1.5-fold decrease, p = 0.0027). In older embryos (HH15–17) the effects are also present (pCIG-αN-catenin side: 158,375 ± 10730; contralateral side: 199,627 ± 13210; 1.3-fold decrease; p = 0.019). These results corroborate our MO knock-down data and demonstrate quantitative differences in the neural crest cell population occupying the trigeminal ganglion upon αN-catenin perturbation.
Fig. 6.
αN-catenin overexpression decreases the migratory neural crest cell contribution to the forming trigeminal ganglion in vivo. (A,B) Representative transverse sections taken at the axial level of the forming trigeminal ganglia of an HH15 (A,A′) and HH14 (B,B′) embryo following pCIG-αN-catenin (A) or pCIG (B) (both green) electroporation earlier in development and HNK-1 (red) immunohistochemistry after re-incubation. Arrows in (A,B) point to the region shown at higher magnification in (A′,B′). DAPI (blue) labels cell nuclei in all images. Asterisk (*) in (A) indicates blood cells. EE, embryonic ectoderm; NT, neural tube; TG, trigeminal ganglion. Scale bars in (A) and (A′) are 100 and 50 μm, respectively, and applicable to (B) and (B′).
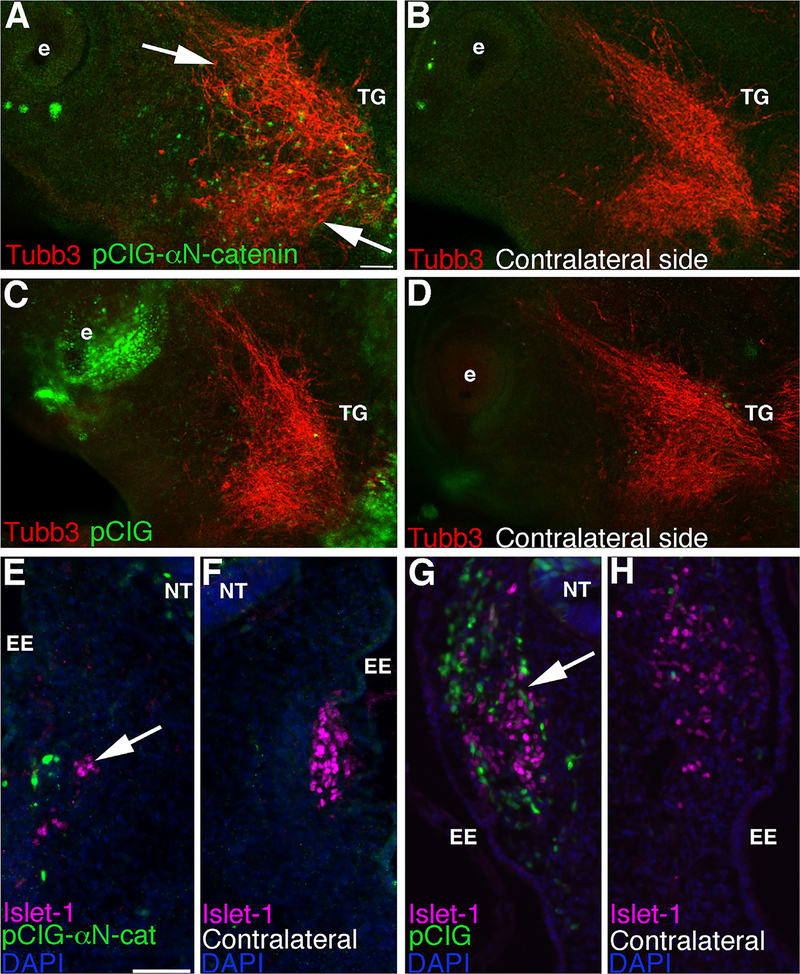
We next assessed trigeminal ganglia morphology, and specifically placode cell contributions, using immunostaining for Tubb3 after αN-catenin overexpression in neural crest cells. Our data reveal effects on the trigeminal ganglion upon αN-catenin overexpression (Fig. 7A, note GFP-positive cells within the ganglion-forming region; 11/13 embryos) compared to the contralateral side (Fig. 7B) and to pCIG-treated embryos (Figs. 7C,D; 6/7 embryos). αN-catenin overexpression leads to the presence of disorganized placode-derived neurons that are not well condensed (Fig. 7A, arrows). Immunostaining for Islet-1 was then used to further explore the possibility that αN-catenin overexpression in neural crest cells can influence placode cells contributing to the trigeminal ganglia. We note a decrease in the number of Islet-1-positive cells upon αN-catenin overexpression (Fig. 7E, arrow; 11/12 embryos), compared to the contralateral side (Fig. 7F) and to pCIG-treated embryos (Fig. 7G,H, arrow; 8/8 embryos). To quantify this observation, we counted the total number of Islet-1-positive placode cells on each side of the embryo in serial sections. We note a statistically significant 1.4-fold decrease in the number of placode cells in the forming trigeminal ganglion upon αN-catenin overexpression in neural crest cells, compared to the contralateral side of the section (pCIG-αN-catenin side: 35 ± 3 cells; contralateral side: 49 ± 4 cells; 1.4-fold change; p = 0.0055). Finally, similar to our αN-catenin depletion experiments, we observe no change in cell proliferation (Supp. Figs. 2A–D, arrowheads; pCIG side: 23 ± 1 cell, contralateral side: 23 ± 1 cell, 6/6 embryos; pCIG-αN-catenin side: 11 ± 1 cell, contralateral side: 12 ± 1 cell; 5/5 embryos) or cell death (Supp. Figs. 2E–H, arrowheads; pCIG side: 22 ± 2 cells, contralateral side: 19 ± 2 cells, 6/6 embryos; pCIG-αN-catenin side: 40 ± 7 cells, contralateral side: 41 ± 8 cells; 5/6 embryos). These results indicate that neural crest cell αN-catenin overexpression can influence placode cell contribution to the forming trigeminal ganglion, thereby providing a possible mechanism behind the inappropriate assembly of this ganglion.
Fig. 7.
αN-catenin overexpression within cranial neural crest cells influences the formation of placode-derived neurons and reduces the number of placode cells during trigeminal ganglion assembly. (A–D) Representative images of a lateral view of two HH16 embryo heads following whole-mount immunohistochemistry for Tubb3 (red) after unilateral electroporation earlier in development with pCIG-αN-catenin (A) or pCIG (C) (both green) and re-incubation. (B,D) Contralateral sides of respective embryos. Arrows in (A) point to aberrant organization and/or dispersal of placode-derived neurons on the pCIG-αN-catenin-treated side that is not observed on the contralateral side of the same embryo (B) or in pCIG-treated embryos (C,D). (E–H) Representative transverse sections taken at the axial level of the forming trigeminal ganglia of an HH17 (E,F) and an HH16 (G,H) embryo following pCIG-αN-catenin (E) or pCIG (G) electroporation (both green) earlier in development, re-incubation, and Islet-1 (purple) immunohistochemistry. (F,H) Contralateral sides of (E,G), respectively, at the same axial level. Arrow in (E) reveals fewer placode cells on the pCIG-αN-catenin-treated side compared to the contralateral side (F) of the same section and to a section from a pCIG-treated embryo (G,H, arrow). DAPI (blue) labels cell nuclei in (E–H). e, eye; EE, embryonic ectoderm; NT, neural tube; TG, trigeminal ganglion. Scale bar in (A) is 100 μm and applicable to (B–D). Scale bar in (E) is 50 μm and applicable to (F–H).
αN-catenin perturbation alters Cadherin-7 distribution and levels in migratory neural crest cells forming the trigeminal ganglia
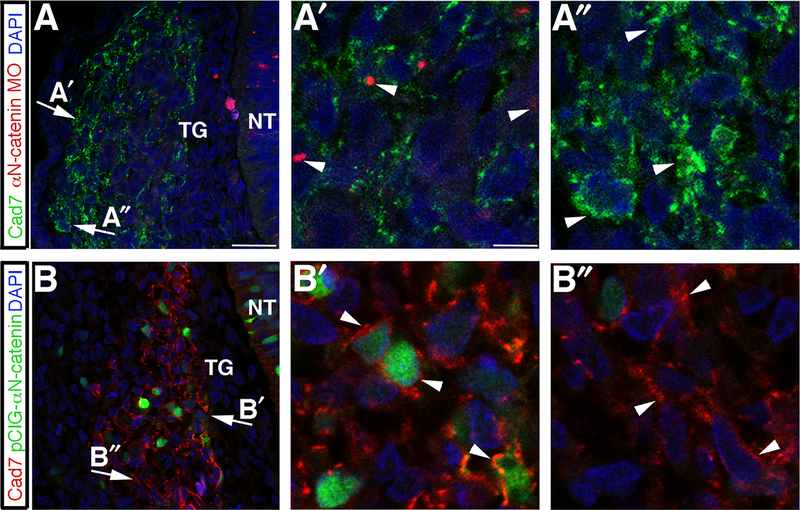
Given the observed effects on the trigeminal ganglion upon αN-catenin perturbation in neural crest cells, we hypothesized that the neural crest cell adhesion molecule Cadherin-7 was altered during ganglion assembly. To address this, we perturbed αN-catenin via MO or overexpression and assessed effects on Cadherin-7 within neural crest cells forming the trigeminal ganglion through immunohistochemistry. αN-catenin depletion leads to a general decrease in Cadherin-7 levels, with reduced plasma membrane localization in neural crest cells (Fig. 8A; arrows point to respective MO-positive (A′) and MO-negative (A″) regions in higher magnification images; arrowheads indicate Cadherin-7 in neural crest cells). We then quantified the fluorescence intensity of Cadherin-7 as in (Wu et al., 2011) to detect differences in regions containing MO-positive and MO-negative cells (Supp. Table 5). We note that αN-catenin depletion leads to a 2.2-fold decrease in Cadherin-7 (average fluorescence intensity/area in αN-catenin MO-positive cells: 0.0192 ± 0.00283; average fluorescence intensity/area in αN-catenin MO-negative cells: 0.0426 ± 0.00442; p=3.8 × 10⁻⁵). Conversely, αN-catenin overexpression causes Cadherin-7 to become localized in large clusters/puncta on neural crest cell plasma membranes (Fig. 8B; arrows point to respective GFP-positive (B′) and GFP-negative (B″) regions in higher magnification images; arrowheads indicate Cadherin-7 in neural crest cells). Cadherin-7 fluorescence intensity measurements reveal a 1.2-fold increase in Cadherin-7 levels (average fluorescence intensity/area in pCIG-αN-catenin-positive cells:0.0237 ± 0.00169; average fluorescence intensity/area in pCIG-αN-catenin-negative cells: 0.0191 ± 0.00118; p = 0.029). These data indicate that αN-catenin perturbation affects Cadherin-7 distribution and levels in neural crest cells that associate with placode cells to generate the trigeminal ganglia.
Fig. 8.
αN-catenin perturbation affects Cadherin-7 distribution and levels in the migratory neural crest cell population contributing to the trigeminal ganglia. (A,B) Representative transverse sections taken at the axial level of the developing trigeminal ganglia after αN-catenin MO (A) or pCIG-αN-catenin (B) electroporation and re-incubation of embryos to HH16, followed by Cadherin-7 (and GFP in (B)) immunohistochemistry. Arrows indicate regions of higher magnification within the ganglion, as shown by (A′) for αN-catenin MO-positive cells, (A″) for αN-catenin MO-negative cells, (B′) for pCIG-αN-catenin-positive cells, and (B″) for pCIG-αN-catenin-negative cells. Arrowheads in (A′) reveal diminished Cadherin-7 compared to Cadherin-7 in αN-catenin MO-negative cells (A″, arrowheads), or enhanced (B′) Cadherin-7 at the plasma membrane in pCIG-αN-catenin-positive cells (B′) compared to Cadherin-7 in pCIG-αN-catenin-negative cells (B″). DAPI (blue) labels cell nuclei in all images. NT, neural tube; TG, trigeminal ganglion. Scale bar in (A) is 13 μm and applicable to (B), while scale bar in (A′) is 3.3 μm and applicable to (A″,B′,B″).
Discussion
αN-catenin possesses multiple functions in neural crest cell ontogeny
As critical components of adherens junctions and mediators of cellular movement through actin binding, α-catenins possess unique roles during development. Chick premigratory neural crest cells express αN-catenin within apical adherens junctions, which serve to hold these cells in place within the neuroepithelium prior to receiving cues to initiate EMT and emigrate away from the dorsal neural tube. During EMT, αN-catenin levels decrease in premigratory and newly emigratory/migratory cranial neural crest cells (Jhingory et al., 2010). In the mouse, αN-catenin is observed in structures of the central and peripheral nervous systems (Hirano and Takeichi, 1994; Park et al., 2002a, 2002b; Shibuya et al., 2003; Uemura and Takeichi, 2006). Given a known function for mouse αN-catenin in the formation of these later nervous system derivatives (including the trigeminal ganglia; see (Uemura and Takeichi, 2006)), and for α-catenins in general in facilitating cell adhesion and migration (Maiden and Hardin, 2011), we reasoned that it was likely that neural crest cells expressed αN-catenin at some point later in their migration. To this end, we examined migratory neural crest cells destined to contribute to the trigeminal ganglia for αN-catenin protein. We observe αN-catenin in these migratory neural crest cells during early and late stages of trigeminal ganglia assembly as neural crest cells intermingle with placode cells. αN-catenin localizes to the cytosol and neural crest cell plasma membranes, coincident with membrane Cadherin-7 distribution, a cadherin that we have now shown, for the first time, to be present in migratory cranial neural crest cells. Interestingly, we do not observe αN-catenin in placode cells, yet we do note αN-catenin expression in migratory neural crest cells contributing to the epibranchial ganglia (data not shown). This suggests that αN-catenin function could be universal in facilitating the condensation of neural crest cells and placode cells during cranial ganglia formation.
The presence of αN-catenin in migratory neural crest cells allowed us to posit that it plays a functional role in the later assembly of neural crest-derived structures such as the cranial ganglia. To address this hypothesis, we depleted or overexpressed αN-catenin within migratory neural crest cells and examined effects on cranial trigeminal ganglia morphology. Our earlier studies indicated that short-term αN-catenin knock-down or overexpression leads to an increase or decrease in the migratory neural crest cell population, respectively (Jhingory et al., 2010). We see similar results in this study upon altering αN-catenin in neural crest cells as they are emerging from the dorsal neural tube and during their migration. Our data indicate that perturbing αN-catenin in migratory neural crest cells manifests as later disruptions in trigeminal ganglion assembly. Other reports that have examined the function of molecules expressed in neural crest or placode cells during the formation of the cranial ganglia have used similar techniques and observed comparable effects (Latta and Golding, 2012; Shiau et al., 2008; Shiau and Bronner-Fraser, 2009; Shigetani et al., 2008). Although it is possible that some of our observed phenotypes could be attributed to effects on neural crest cell EMT, given the timing of our electroporations, it is more likely to be due to effects on migratory neural crest cells and the function of αN-catenin therein. Because we observe αN-catenin MO- and pCIG-αN-catenin/GFP-positive neural crest cells within the condensing trigeminal ganglion, and aberrant ganglion assembly, we conclude that our MO and expression constructs are still functional at later time points. These results suggest an important role for αN-catenin in migratory neural crest cells as the trigeminal ganglia are forming.
To assess trigeminal ganglia morphology upon αN-catenin knock-down in neural crest cells, we examined tissue sections and whole embryos using antibodies to HNK-1 and Tubb3, labeling neural crest cells and differentiated placodal neurons, respectively. Remarkably, neural crest cell αN-catenin depletion affects trigeminal ganglion assembly on the treated side of the embryo. The trigeminal ganglion does not form normally, with placode-derived neurons appearing somewhat truncated and less condensed. Although the number of placode cells is not changed, placode cells are more dispersed throughout the ganglion. As such, trigeminal ganglion assembly defects may relate to poor adhesion and/or scaffolding provided by neural crest cells and/or aberrant signaling between neural crest cells and placode cells upon αN-catenin loss.
To corroborate our αN-catenin depletion data, we overexpressed αN-catenin within the migratory neural crest cell population. In contrast to our knock-down data, the dorsal–ventral distribution, and size of the migratory neural crest cell domain, is reduced upon αN-catenin overexpression. Intriguingly, αN-catenin overexpression within migratory neural crest cells decreases the Islet-1-positive placodal cell population within the forming trigeminal ganglion. Tubb3 immunohistochemistry also reveals a more dispersed and disordered ganglion upon ectopic expression of αN-catenin. This phenotype is reminiscent of that observed upon N-cadherin knock-down in placode cells (Shiau and Bronner-Fraser, 2009). In these studies, even N-cadherin MO-negative placode cells were affected, implying a non-cell autonomous function for N-cadherin on placode cells during this process and further highlighting the detrimental effects on cell–cell adhesion that can ensue. The reduction in placode cell number suggests that neural crest cells may be providing some cue that directly or indirectly influences the number of placode cells contributing to the trigeminal ganglion, thereby compromising ganglion assembly. Additional experiments will be necessary to shed light on how neural crest cell αN-catenin communicates with placode cells. Given the presence of αN-catenin in neural crest cells contributing to the epibranchial ganglia, it is possible that αN-catenin possesses a general function in communication with placode cells during cranial ganglia assembly. This may also hold true for the creation of ganglia in the trunk, which arise from interactions between neural crest cells.
αN-catenin regulation of cadherins: a mechanism underlying general cranial ganglia assembly?
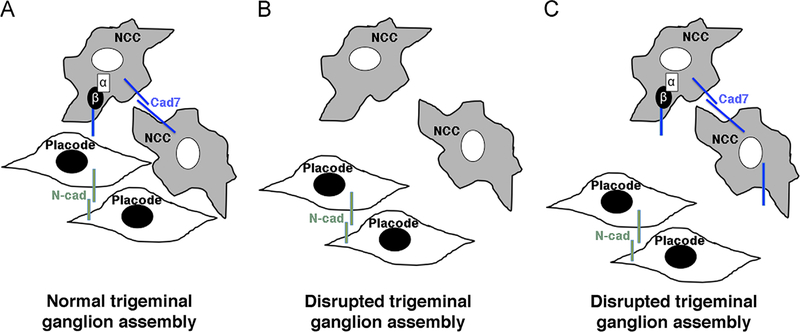
In our initial studies on αN-catenin, we noted that αN-catenin perturbation modulates the levels of premigratory neural crest cell cadherins and that this, at least partially, can explain the early neural crest cell EMT/migration phenotypes we observe (Jhingory et al., 2010). With our new data showing that αN-catenin and Cadherin-7 are expressed in migratory neural crest cells, we surmised that αN-catenin played an important role in maintaining Cadherin-7-mediated cell–cell contacts during neural crest cell migration and potentially trigeminal ganglia assembly. Furthermore, the presence of a trigeminal ganglion phenotype upon αN-catenin perturbation led us to speculate that perhaps cadherin levels were altered in neural crest cells expressing reduced or elevated levels of αN-catenin. To this end, we examined Cadherin-7 levels in trigeminal ganglia through immunohistochemistry in which αN-catenin was either depleted (via the MO) or overexpressed. After αN-catenin knock-down, we observe a reduction in Cadherin-7 in migratory neural crest cells contributing to the trigeminal ganglion, including a general decrease on the plasma membrane. These data indicate that αN-catenin may function to maintain and/or stabilize membrane Cadherin-7 in migratory neural crest cells, possibly through its indirect interaction with the Cadherin-7 cytoplasmic tail via β-catenin. Thus, the absence of αN-catenin may lead to increased turnover of Cadherin-7. A role for αN-catenin in stabilizing cadherins at the membrane has been reported previously in vitro (Hirano et al., 1992; Watabe et al., 1994), and αN-catenin is likely performing a similar function here in neural crest cells in vivo. A reduction in Cadherin-7 may preclude effective neural crest cell–neural crest cell and/or neural crest cell–placode cell communication, thereby potentially favoring placode cell–placode cell interactions and disrupting trigeminal ganglion assembly (Fig. 9).
Fig. 9.
Model depicting the role of αN-catenin in neural crest cells during the assembly of the trigeminal ganglion. (A) Neural crest cells (NCC) and placode cells intermingle and coalesce to form the trigeminal ganglion. αN-catenin and Cadherin-7 (Cad7) are localized to neural crest cells, while placode cells express N-cadherin (N-cad). (B) Depletion of αN-catenin expands the migratory neural crest cell domain, but these neural crest cells possess reduced levels of Cad7. This prevents the formation of an effective scaffold for placode cells, leading to abnormalities in the formation of the trigeminal ganglion. (C) αN-catenin overexpression reduces the migratory neural crest cell domain, and these neural crest cells possess increased levels of Cadherin-7 on the surface of neural crest cells. The decrease in neural crest cells in the trigeminal ganglion-forming region may preclude effective interactions with placode cells. As in (B), the trigeminal ganglion is not assembled correctly. In (B) and (C), placode cell–placode cell interactions may be favored over placode cell–neural crest cell interactions, further enforcing the aberrant assembly of the trigeminal ganglion. α, αN-catenin; β, β-catenin.
In migratory neural crest cells within the trigeminal ganglion overexpressing αN-catenin, Cadherin-7 levels are slightly elevated, with protein localized to large puncta that appear to be membrane-associated based on our confocal images. In this instance, ectopic expression of αN-catenin may stabilize Cadherin-7 at neural crest cell plasma membranes, preventing its normal turnover. Within the forming trigeminal ganglion, it is possible that those neural crest cells that possess aberrant Cadherin-7 membrane distribution may not coalesce correctly with placode cells due to (potentially) favored neural crest cell–neural crest cell interactions over neural crest cell–placode cell interactions. Placode cells may also associate preferentially in this scenario, and altogether could lead to defects in trigeminal ganglion assembly. Future work will discern whether this function for αN-catenin in controlling Cadherin-7 levels is conserved in the formation of other cranial and trunk ganglia.
Conclusion
Our results highlight a novel function for an adherens junction component in migratory neural crest cells as they traverse the embryo and eventually interact with placode cells to form the trigeminal ganglia. αN-catenin plays a critical role in the formation of early migratory neural crest cells from immotile precursors, being down-regulated as neural crest cells undergo EMT. Proper αN-catenin expression in motile cranial neural crest cells is then later required to ensure that neural crest cells migrate appropriately and effectively intermix and coalesce with epidermal placode cells to form the trigeminal ganglia. These data further demonstrate the multi-functionality of catenin proteins and may have implications in the formation of other cranial ganglia, and general tissue formation, during vertebrate development.
Materials and methods
Chick embryos
Fertilized chicken eggs (Gallus gallus) were obtained from B&E (York Springs, PA) and Hy-Line North America, L.L.C. (Elizabeth-town, PA), and incubated at 37 °C in humidified incubators. Embryos were staged according to either the number of somite pairs (somite stage) in early development or Hamburger–Hamilton (HH) in later development (Hamburger and Hamilton, 1992).
In ovo unilateral electroporations
A 3′ lissamine-labeled antisense αN-catenin morpholino (MO), or a 5 base pair mismatch αN-catenin control MO, was used for knock-down experiments at a concentration of 500 μM as described previously (Jhingory et al., 2010). The pCIG-αN-catenin or control (pCIG) vector (from (Jhingory et al., 2010)) was electroporated at a concentration of 2.5 μg/μl. Briefly, MOs or expression constructs were introduced into the early chick neural tube (HH9) by fine glass needles. After filling the neural tube, platinum electrodes were placed on either side of the embryo, and two 25 V, 25 ms electric pulses were applied across the embryo in order to electroporate the neural tube unilaterally, as in (Itasaki et al., 1999; Jhingory et al., 2010). Eggs were re-sealed with tape and parafilm and re-incubated for 14–16 h, then imaged in ovo around HH12 (prior to embryo turning) using a Zeiss AxioObserver.Z1 microscope in order to determine electroporation efficiency. After imaging, eggs were re-sealed and re-incubated for the desired time period prior to harvesting for further experimentation.
Whole-mount in situ hybridization
Whole-mount in situ hybridization for Sox10 was performed as previously described in (Jhingory et al., 2010; Wilkinson, 1992; Wilkinson and Nieto, 1993). Embryos were treated with Proteinase K to increase accessibility of the probe to target RNA. Stained embryos were imaged in 70% glycerol using a Zeiss SteREO Discovery V8 microscope with a mounted camera. Transverse sections were obtained by embedding embryos in gelatin and cryostat-sectioning at 14 μm on a Leica Jung frigocut 2800E. Sectioned images were acquired using a Zeiss AxioObserver.Z1 microscope and processed using Adobe Photoshop 9.0 (Adobe Systems).
Immunohistochemistry and TUNEL assay
Immunohistochemical detection of TuJ1 (Covance, 1:200) was performed in whole-mount following overnight fixation in 4% PFA. Immunohistochemical detection of HNK-1 (1:100), N-cadherin (Developmental Studies Hybridoma Bank (DSHB) clone MNCD2, 1:200), Islet-1 (DSHB, clone 40.2D6, 1:200), Cadherin-7 (DSHB, clone CCD7–1, 1:100), phospho-histone H3 (Millipore, 1:200) and GFP (Invitrogen, A11122, 1:250) was performed on 14 μm transverse sections following 4% PFA fixation and gelatin embedding, and αN-catenin (DSHB, clone NCAT2; 1:30–1:50) was carried out on transverse sections following methanol fixation and gelatin embedding. All primary and secondary antibodies were diluted in 1X Phosphate-buffered saline +0.1% Tween-20+5% sheep serum (PTW); in some instances, Cadherin-7 immunohistochemistry was conducted using antibodies diluted in 1 × Tris-buffered saline +0.1% Triton-X+5% fetal bovine serum (TBSTx). The following secondary antibodies from Invitrogen were obtained and used at 1:200–1:500 dilutions in PTW or TBSTx: Goat anti-mouse IgM (HNK-1); goat anti-mouse IgG1 (Islet-1); goat or donkey anti-rabbit IgG (phospho-histone H3); goat anti-rat IgG (N-cadherin and αN-catenin); and goat anti-mouse IgG (Cadherin-7). TUNEL assay (Roche, TMR red and fluorescein) was performed on 4% PFA-cryopreserved sections to detect apoptotic cells. Sections were stained with 4′,6-diamidino-2-phenylindole (DAPI) to mark the cell nuclei. Embryos immunostained in whole-mount for Tubb3 or section immunohistochemistry for cadherin and catenin proteins were acquired using a Zeiss LSM710 confocal micoscope and processed as described above.
Quantification and statistical analysis
The dorsal–ventral domain of Sox10-positive migratory neural crest cells was calculated by measuring the distance in at least five serial sections (same magnification) through the assembling trigeminal ganglia from a minimum of three embryos. Using the “Ruler” tool and the “Record Measurement” function in Adobe Photoshop, the distance along the dorsal–ventral axis, parallel to the neural tube, was determined on the experimental and contralateral side of each section (in a similar fashion as carried out in (Fairchild and Gammill, 2013)). The average distance, standard error of the mean, and fold change was then calculated across all of the sections. The area occupied by HNK-1-positive cells was quantified on the treated and contralateral control sides of embryos in at least five serial sections (same magnification) through the assembling trigeminal ganglia from a minimum of four embryos. Using the “Lasso” tool in Adobe Photoshop, the region containing HNK-1-positive migratory neural crest cells was outlined on each section, and the “Record Measurement” function was then employed to calculate arbitrary square pixel units of the experimental and contralateral side of each section. These measurements have been made in an analogous manner to those described in (Latta and Golding, 2012; Shiau et al., 2008; Shiau and Bronner-Fraser, 2009; Shigetani et al., 2008). Islet-1-, phospho-histone H3- and TUNEL-positive cells were counted individually following immunohistochemistry (or TUNEL assay) using the Adobe Photoshop count tool and analyzed to compare cell numbers on the treated side versus the contralateral side in the same section. At least five serial sections from a minimum of eight embryos were examined. To analyze Cadherin-7 fluorescence after αN-catenin knock-down or overexpression, groups of two to five MO- and GFP-positive or MO- and GFP-negative cells were identified through their fluorescence and DAPI staining. Two areas each of positive and negative cells were selected for both MO and GFP constructs. The “Outline Spline” tool of the Zeiss Axiovision Release 4.8 software was used, as in (Wu et al., 2011), to calculate the area of the selected cells and intensity value of Cadherin-7 expressed in the selected region of cells. The ratio of intensity to area was then obtained for MO- or GFP-positive and MO- or GFP-negative cells, and these ratios were averaged across at least four sections from a minimum of three embryos. The fold change in this ratio was then calculated to determine effects of αN-catenin MO or overexpression on Cadherin-7 levels. For all measurements, only those embryos having high electroporation efficiencies and symmetric sections were chosen so as to not obscure the interpretation of data. All results are reported as averages plus or minus the standard error of the mean and were analyzed with a Student’s t test to establish statistical significance, as in our prior work (Jhingory et al., 2010; Wu and Taneyhill, 2012).
Supplementary Material
Acknowledgments
This work is supported by NSF, United States Grant IOS-0948525 to L.A.T and an undergraduate research fellowship from the Howard Hughes Medical Institute to K.H. Antibodies to αN-catenin, Cadherin-7, N-cadherin, and Islet-1 were obtained from the Developmental Studies Hybridoma Bank developed under the auspices of the NICHD and maintained by The University of Iowa, Department of Biology, Iowa City, IA 52242.
Footnotes
Appendix A. Supplementary materials
Supplementary data associated with this article can be found in the online version at http://dx.doi.org/10.1016/j.ydbio.2014.05.016.
References
- Begbie J, Ballivet M, Graham A, 2002. Early steps in the production of sensory neurons by the neurogenic placodes. Mol. Cell Neurosci 21, 502–511. [DOI] [PubMed] [Google Scholar]
- Blentic A, Chambers D, Skinner A, Begbie J, Graham A, 2011. The formation of the cranial ganglia by placodally-derived sensory neuronal precursors. Mol. Cell Neurosci 46, 452–459. [DOI] [PubMed] [Google Scholar]
- D’Amico-Martel A, 1982. Temporal patterns of neurogenesis in avian cranial sensory and autonomic ganglia. Am. J. Anat 163, 351–372. [DOI] [PubMed] [Google Scholar]
- D’Amico-Martel A, Noden DM, 1980. An autoradiographic analysis of the development of the chick trigeminal ganglion. J. Embryol. Exp. Morphol 55, 167–182. [PubMed] [Google Scholar]
- D’Amico-Martel A, Noden DM, 1983. Contributions of placodal and neural crest cells to avian cranial peripheral ganglia. Am. J. Anat 166, 445–468. [DOI] [PubMed] [Google Scholar]
- Fairchild CL, Gammill LS, 2013. Tetraspanin18 is a FoxD3-responsive antagonist of cranial neural crest epithelial-to-mesenchymal transition that maintains cadherin-6B protein. J. Cell Sci 126, 1464–1476. [DOI] [PMC free article] [PubMed] [Google Scholar]
- Freter S, Fleenor SJ, Freter R, Liu KJ, Begbie J, 2013. Cranial neural crest cells form corridors prefiguring sensory neuroblast migration. Development 140, 3595–3600. [DOI] [PMC free article] [PubMed] [Google Scholar]
- Gammill LS, Gonzalez C, Bronner-Fraser M, 2007. Neuropilin 2/semaphorin 3F signaling is essential for cranial neural crest migration and trigeminal ganglion condensation. Dev. Neurobiol 67, 47–56. [DOI] [PubMed] [Google Scholar]
- Hamburger V, 1961. Experimental analysis of the dual origin of the trigeminal ganglion in the chick embryo. J. Exp. Zool 148, 91–123. [DOI] [PubMed] [Google Scholar]
- Hamburger V, Hamilton HL, 1992. A series of normal stages in the development of the chick embryo. 1951. Dev. Dyn 195, 231–272. [DOI] [PubMed] [Google Scholar]
- Hirano S, Kimoto N, Shimoyama Y, Hirohashi S, Takeichi M, 1992. Identification of a neural alpha-catenin as a key regulator of cadherin function and multi-cellular organization. Cell 70, 293–301. [DOI] [PubMed] [Google Scholar]
- Hirano S, Takeichi M, 1994. Differential expression of alpha N-catenin and N-cadherin during early development of chicken embryos. Int. J. Dev. Biol 38, 379–384. [PubMed] [Google Scholar]
- Itasaki N, Bel-Vialar S, Krumlauf R, 1999. ‘Shocking’ developments in chick embryology: electroporation and in ovo gene expression. Nat. Cell Biol 1, E203–E207. [DOI] [PubMed] [Google Scholar]
- Jhingory S, Wu CY, Taneyhill LA, 2010. Novel insight into the function and regulation of alphaN-catenin by Snail2 during chick neural crest cell migration. Dev. Biol 344, 896–910. [DOI] [PMC free article] [PubMed] [Google Scholar]
- Jidigam VK, Gunhaga L, 2013. Development of cranial placodes: insights from studies in chick. Dev. Growth Differ 55, 79–95. [DOI] [PubMed] [Google Scholar]
- Latta EJ, Golding JP, 2012. Regulation of PP2A activity by Mid1 controls cranial neural crest speed and gangliogenesis. Mech. Dev 128, 560–576. [DOI] [PubMed] [Google Scholar]
- Maiden SL, Hardin J, 2011. The secret life of Œ ±-catenin: moonlighting in morphogenesis. J. Cell Biol 195, 543–552. [DOI] [PMC free article] [PubMed] [Google Scholar]
- Mayor R, Theveneau E, 2013. The neural crest. Development 140, 2247–2251. [DOI] [PubMed] [Google Scholar]
- Nakagawa S, Takeichi M, 1998. Neural crest emigration from the neural tube depends on regulated cadherin expression. Development 125, 2963–2971. [DOI] [PubMed] [Google Scholar]
- Park C, Falls W, Finger JH, Longo-Guess CM, Ackerman SL, 2002a. Deletion in Catna2, encoding alpha N-catenin, causes cerebellar and hippocampal lamination defects and impaired startle modulation. Nat. Genet 31, 279–284. [DOI] [PubMed] [Google Scholar]
- Park C, Finger JH, Cooper JA, Ackerman SL, 2002b. The cerebellar deficient folia (cdf) gene acts intrinsically in Purkinje cell migrations. Genesis 32, 32–41. [DOI] [PubMed] [Google Scholar]
- Saint-Jeannet JP, Moody SA, 2014. Establishing the pre-placodal region and breaking it into placodes with distinct identities. Dev. Biol 389, 13–27. [DOI] [PMC free article] [PubMed] [Google Scholar]
- Sauka-Spengler T, Bronner M, 2010. Snapshot: neural crest. Cell 143, 486–486.e1. [DOI] [PubMed] [Google Scholar]
- Shiau C, Lwigale P, Das R, Wilson S, Bronner-Fraser M, 2008. Robo2-Slit1 dependent cell–cell interactions mediate assembly of the trigeminal ganglion. Nat. Neurosci 11, 269–276. [DOI] [PubMed] [Google Scholar]
- Shiau CE, Bronner-Fraser M, 2009. N-cadherin acts in concert with Slit1-Robo2 signaling in regulating aggregation of placode-derived cranial sensory neurons. Development 136, 4155–4164. [DOI] [PMC free article] [PubMed] [Google Scholar]
- Shibuya Y, Murata M, Munemoto S, Masago H, Takeuchi J, Wada K, Yokoo S, Umeda M, Komori T, 2003. Alpha E- and alpha N-catenin expression in dorsal root ganglia and spinal cord. Kobe J. Med. Sci 49, 93–98. [PubMed] [Google Scholar]
- Shigetani Y, Howard S, Guidato S, Furushima K, Abe T, Itasaki N, 2008. Wise promotes coalescence of cells of neural crest and placode origins in the trigeminal region during head development. Dev. Biol 319, 346–358. [DOI] [PubMed] [Google Scholar]
- Shimoyama Y, Nagafuchi A, Fujita S, Gotoh M, Takeichi M, Tsukita S, Hirohashi S, 1992. Cadherin dysfunction in a human cancer cell line: possible involvement of loss of alpha-catenin expression in reduced cell–cell adhesiveness. Cancer Res. 52, 5770–5774. [PubMed] [Google Scholar]
- Steventon B, Mayor R, Streit A, 2014. Neural crest and placode interaction during the development of the cranial sensory system. Dev. Biol 389, 28–38. [DOI] [PMC free article] [PubMed] [Google Scholar]
- Theveneau E, Steventon B, Scarpa E, Garcia S, Trepat X, Streit A, Mayor R, 2013. Chase-and-run between adjacent cell populations promotes directional collective migration. Nat. Cell Biol 15, 763–772. [DOI] [PMC free article] [PubMed] [Google Scholar]
- Uchida N, Shimamura K, Miyatani S, Copeland NG, Gilbert DJ, Jenkins NA, Takeichi M, 1994. Mouse alpha N-catenin: two isoforms, specific expression in the nervous system, and chromosomal localization of the gene. Dev. Biol 163, 75–85. [DOI] [PubMed] [Google Scholar]
- Uemura M, Takeichi M, 2006. Alpha N-catenin deficiency causes defects in axon migration and nuclear organization in restricted regions of the mouse brain. Dev. Dyn 235, 2559–2566. [DOI] [PubMed] [Google Scholar]
- Watabe M, Nagafuchi A, Tsukita S, Takeichi M, 1994. Induction of polarized cell–cell association and retardation of growth by activation of the E-cadherin–catenin adhesion system in a dispersed carcinoma line. J. Cell Biol 127, 247–256. [DOI] [PMC free article] [PubMed] [Google Scholar]
- Wilkinson DG, 1992. Whole mount in situ hybridization of vertebrate embryos In: Wilkinson DG (Ed.), in situ Hybridization. Oxford University Press, Oxford, pp. 75–83. [Google Scholar]
- Wilkinson DG, Nieto MA, 1993. Detection of messenger RNA by in situ hybridization to tissue sections and whole mounts. Methods Enzymol. 225, 361–373. [DOI] [PubMed] [Google Scholar]
- Wu CY, Jhingory S, Taneyhill LA, 2011. The tight junction scaffolding protein cingulin regulates neural crest cell migration. Dev. Dyn 240, 2309–2323. [DOI] [PMC free article] [PubMed] [Google Scholar]
- Wu CY, Taneyhill LA, 2012. Annexin A6 modulates chick cranial neural crest cell emigration. PLoS ONE 7, e44903. [DOI] [PMC free article] [PubMed] [Google Scholar]
Associated Data
This section collects any data citations, data availability statements, or supplementary materials included in this article.


