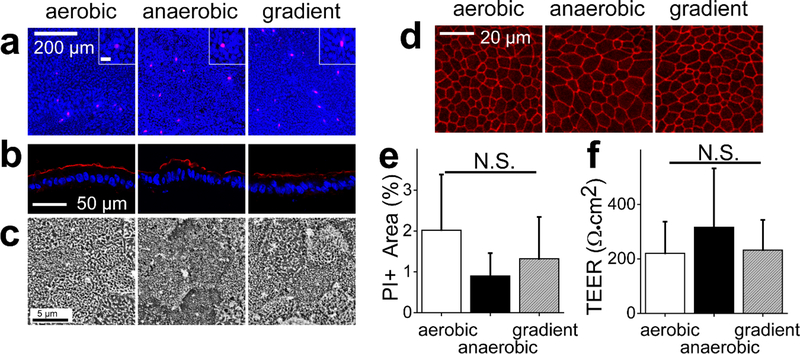
Figure 2.
Monolayer cell properties in different oxygen environments. a) Representative fluorescence images of monolayers stained with PI (magenta) and Hoechst 33342 (blue). Scale bar in the inset is 20 μm. b) Representative images of the human colonic epithelial cells cryosectioned and immunostained for ezrin (red: ezrin, blue: Hoechst 33342). d) Representative SEM images of the human colonic epithelial cells in the various oxygen conditions. d) Representative images of ZO-1 immunofluorescence (red) in the human colonic epithelial cells in aerobic, anaerobic, and oxygen-gradient environments. e) Measurement of dead cells under the various oxygen environments. The Y-axis is the PI-positive area divided by the Hoechst 33342 positive area. The data were obtained from 3 independent experiments. f) Monolayer TEER in the various oxygen environments. The aerobic conditions utilized 21 independent samples while the for anaerobic condition and oxygen gradient conditions used 20 independent samples

