

Correction to: BMC Cancer (2018) 18:264
https://doi.org/10.1186/s12885-018-4050-1
Following publication of the original article [1], the authors reported errors in Fig. 3, Fig. 14a, Fig. 18, Fig. 19b, Additional file 3 and Additional file 7. The title of Additional file 9 contains a typing error and is correctly given below.
Fig. 3.

Most active compound (IC50 = 0.2) mapped to all the features
Fig. 14.
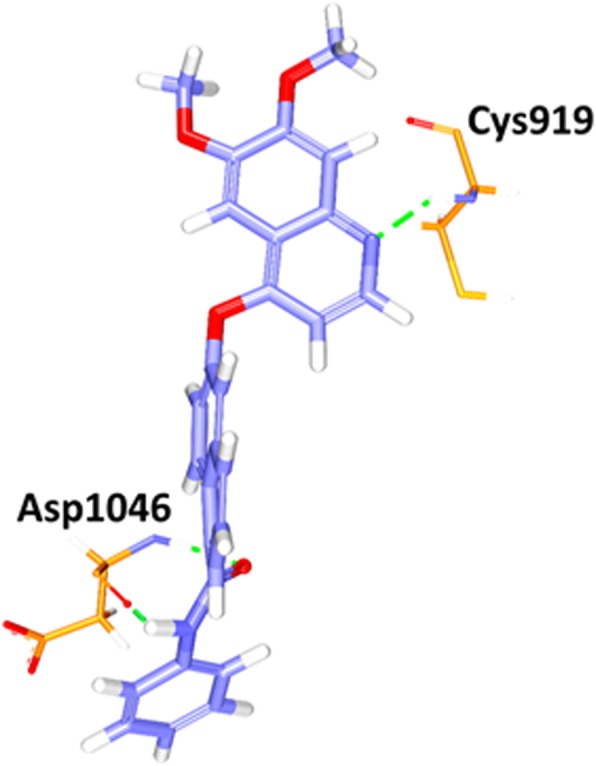
a Molecular interaction between the reference- protein (purple). Green dotted lines indicate the hydrogen bonds. The residues are represented in orange stick model
Fig. 18.
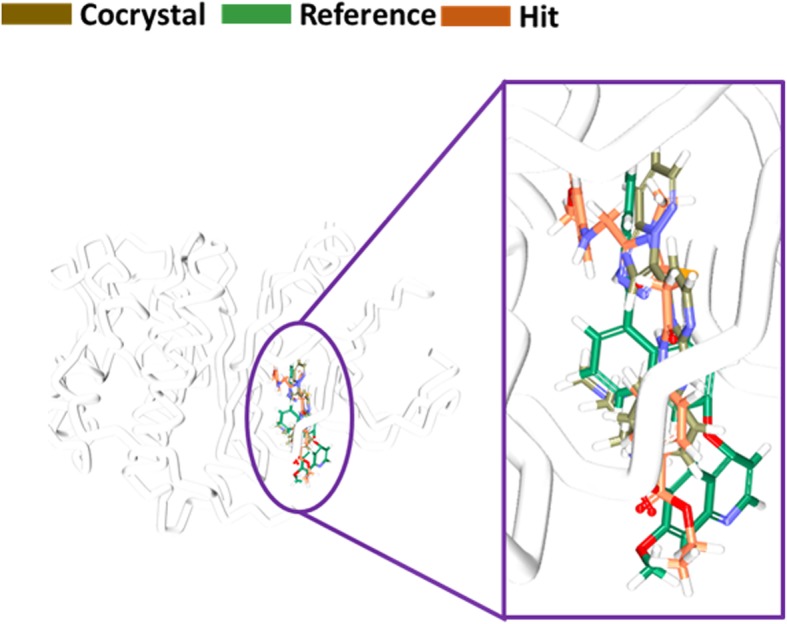
Binding mode assessment of compounds. The co-crystal is represented in gray, reference is denoted in green and the Hit in orange. All the three follow the same pattern
Fig. 19.
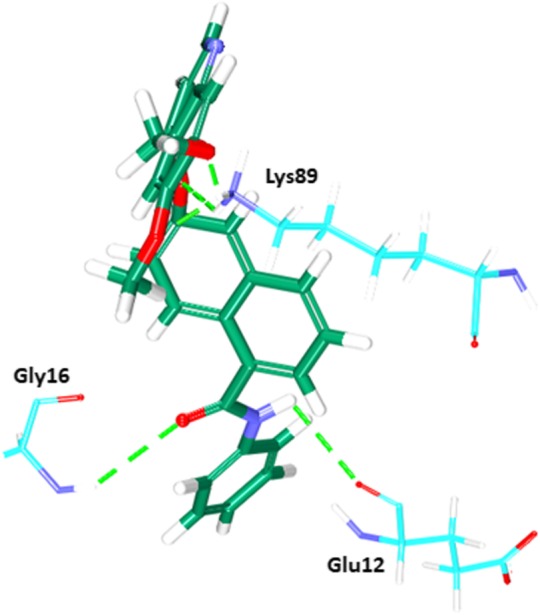
b Intermolecular interactions between the ligand and the protein. Green dotted lines represent the hydrogen bonds. The protein residues are indicated in cyan
The following typing errors have been identified:
| Page no | Column/paragraph | line | Present word | Change to |
|---|---|---|---|---|
| 1 | Abstract/results | 2 | of | above |
| 2 | 1/2 | 2 | Cyclic | Cyclin |
| 2 | 2/1 | 3 | VEGFR | VEGFR-2 |
| 12 | 2/1 | 3 | prognosis | progression |
| 12 | 2/1 | 10 | form | from |
| 19 | Above conclusions | 4 | Cyc919 | Cys919 |
| 10 | 2/1 | 13 | 20 ps | 20 ns |
| 10 | 2/1 | 15 | 25 ps | 25 ns |
| 13 | 2/1 | 6 | four | five |
| Table 5/ reference | van der Waals interactions | – | asn900leu1044 | Asn900, Ile1044 |
| Fig 10 | – | – | 30 ps | 30 ns |
| Fig 16 | – | – | refrence | reference |
Further to this, in Table 1, HyP is incorrectly represented as HyB and Hy-Ali as HyAli/HY-Ali. The corrected Table 1 can be found here.
Table 1
| Hypo no | Total costa | Cost difference | RMSDb | Correlation | Featuresc | Max fit |
|---|---|---|---|---|---|---|
| Hypo1 | 111.95 | 71.22 | 0.7 | 0.97 | Hy-Ali, 2HyP,RA | 11.4 |
| Hypo 2 | 113.31 | 69.86 | 0.7 | 0.96 | Hy-Ali, 2HyP,RA | 11.5 |
| Hypo 3 | 116.45 | 66.71 | 0.8 | 0.95 | Hy-Ali,HyP,RA,HBA | 11.9 |
| Hypo 4 | 116.47 | 66.69 | 1.0 | 0.94 | HBA, HBD 2HyP | 10.7 |
| Hypo 5 | 117.11 | 66.05 | 0.9 | 0.94 | Hy-Ali,HyP,RA,HBA | 11.5 |
| Hypo 6 | 119.51 | 63.65 | 1.0 | 0.93 | HBA,HBD,2HyP | 11.26 |
| Hypo 7 | 119.52 | 63.65 | 0.9 | 0.95 | HBA,2HyP,RA | 12.65 |
| Hypo 8 | 119.82 | 63.35 | 0.9 | 0.94 | HBA,Hy-Ali,HBD,RA | 12.33 |
| Hypo 9 | 119.94 | 63.23 | 1.2 | 0.91 | HBA,Hy-Ali,2HyP, RA | 11.98 |
| Hypo10 | 120.52 | 62.65 | 1.1 | 0.91 | HBA,HBD, Hy-Ali | 7.8 |
These corrections do not alter the context of the manuscript.
Supplementary information
Additional file 3. 2D interaction representation of the reference compound and 4AG8. Detailed molecular interactions of the reference compound.
Additional file 7. 2D interaction representation of the reference compound and 1URW. Molecular interaction details of the reference compound.
Additional file 9. Active sites comparison. Comparison of the active site residues of 4AG8 and 1URW.
Supplementary information
Supplementary information accompanies this paper at 10.1186/s12885-019-6378-6.
Reference
- 1.Rampogu S, et al. Exploration for novel inhibitors showing back-to-front approach against VEGFR-2 kinase domain (4AG8) employing molecular docking mechanism and molecular dynamics simulations. BMC Cancer. 2018;18:264. doi: 10.1186/s12885-018-4050-1. [DOI] [PMC free article] [PubMed] [Google Scholar]
Associated Data
This section collects any data citations, data availability statements, or supplementary materials included in this article.
Supplementary Materials
Additional file 3. 2D interaction representation of the reference compound and 4AG8. Detailed molecular interactions of the reference compound.
Additional file 7. 2D interaction representation of the reference compound and 1URW. Molecular interaction details of the reference compound.
Additional file 9. Active sites comparison. Comparison of the active site residues of 4AG8 and 1URW.