Abstract
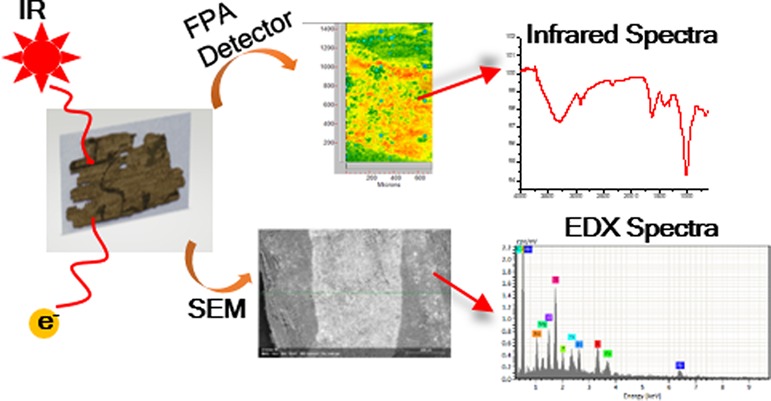
This paper reports the results of a spectroscopic study on the chemistry of some small papyrus fragments arising from three Egyptian excavation sites. The aim of this investigation was to verify the possibility to identify significant differences in ancient Egyptian papyri using noninvasive analytical methods, that is, ATR (attenuated total reflection)–FTIR (Fourier transform infrared) spectroscopic imaging and scanning electron microscopy–energy-dispersive X-ray spectroscopy. Differences in both lignin and cellulose compositions, which are difficult to detect with traditional FTIR and FTIR imaging spectral analysis, were revealed by the multivariate approach, and the second derivative spectroscopy was applied to enhance the spectrum resolution. Thus, it has been possible to recognize a fragment characterized by the presence of lead and of long chain aliphatic organic compound, which are not present in the other fragments, in the ink region. These data show not only that the combination of these techniques can provide important chemical information, such as to evidence the different compositions and manufacture of each papyrus, but also that metal inks were probably used also in ancient Egyptian papyri.
Introduction
The application of analytical techniques to art and archaeological artifacts can provide information about compositions, structures, and physico-chemical behavior of objects, which can be useful for historians, art experts, etc. These data are indeed fundamental to establish better conservation conditions to test the authenticity of the artifacts and to perform restoration. The development of sensitive and nondestructive techniques has favored the study of this kind of objects that, however, requires the interdisciplinary collaboration between the scientists, art historians, and archaeologists.
Egyptian papyri are surely one of our most important sources for understanding the culture and history of the ancient world, having preserved a wide range of texts, such as literary manuscripts, personal correspondence, contracts, petitions, census declarations, property declarations, and tax receipts. Furthermore, for many of them, we know the date and the place where they were written and/or found, providing a useful complement to other forms of ancient evidence.
Papyri served as a writing support for thousands of years. The first evidence for the use of papyrus in the production of writing substrates dates to the third millennium BCE, in ancient Egypt, and it remained in use until the Middle Ages. Centuries after production, the ancient papyri have been excavated or purchased and then stored in several museums and libraries. Today, hundreds of thousands of papyrus fragments serve as an important source for philological, literary, linguistic, and historical studies.
Papyri are generally constituted of different strips, derived from the homonymous plant, pressed, and dried in the sun. Their composition and manufacture techniques have been object of intensive investigation. Thermogravimetric and elemental analysis have been done on ancient and modern papyri by Wiedeman et al., showing that they are composed of lignocellulosic materials (50–60% cellulose and 20–30% lignin, with traces of silicon, aluminum, and calcium).1 However, different scriptoria or geographical areas as well as different periods have been characterized by the use of specific materials and preparation techniques. Furthermore, lignocellulosic materials can undergo more or less strong oxidation processes depending on the age of the manuscript, the source of the plant, the manufacturing processes, and the external environmental conditions.2 Recently, many analytical techniques have been used not only to evaluate the chemical composition of different historical artifacts but also to determine degradation parameters, that is, the overall oxidation of the lignocellulosic material, degree of polymerization, and crystallinity of cellulose.3 In particular, spectroscopy has offered the opportunity for nondestructive characterization of these materials.4,5 Thus, Raman and attenuated total reflection Fourier transform infrared (ATR–FTIR) spectroscopies have been extensively used to identify the chemical composition of selected pigments6−8 on manuscripts, including ancient Egyptian papyri, through determination of the characteristic vibrational frequencies of specific molecular entities. In the specific case of ancient papyri and parchments, several studies demonstrated that black inks were mainly composed of carbon black and arabic gum, egg tempera, or beeswax as binders,9 without any kind of added heavy metal (the introduction of these latter is normally traced to the advent of iron gall).10,11 Nonetheless, heavy metals have been found by modern analysis in black and colored inks used in various parts of Egypt;11 and recent works by Brun et al. have revealed the presence of lead also in papyri found at Herculaneum.12−14 Actually, in that work, the X-ray fluorescence (XRF) technique was able to detect the presence of metal in the ink. At the same time, copper has also been found by XRF analysis in Herculaneum papyri by Brun et al.,12 confirming once more that in papyri present in Italy, different metals were added in inks.
In recent years, FTIR spectroscopy has been coupled with imaging techniques, thanks to focal plane array (FPA) detectors, giving the possibility to obtain with relatively short analysis times spatial and spectroscopic information about the analyzed sample with minimal preparation and without destruction: ultrathin samples can be analyzed without resin embedding. Furthermore, the spatial resolution size (around 2 μm) characterizing this technique provides high levels of detail and chemical information and consents the identification of defects and variations in chemical composition on this scale. Thus, the FTIR imaging technique was applied to six fragments of ancient Egyptian papyri. Furthermore, since the analysis of the collected FTIR spectroscopic data resulted was made complicated by the overlapping of most of the absorption peaks, second derivative spectroscopy has been applied to enhance peak separation, and a multivariate analysis method has been used to evaluate differences in chemical composition, characterizing the examined fragments. Finally, scanning electron microscopy–energy-dispersive spectroscopy (SEM–EDXS) was carried out on the same fragments to obtain further information on the composition of papyri and inks.
Results and Discussion
Six small fragments of ancient Egyptian papyri were purchased from Istituto Papirologico Girolamo Vitelli (University of Florence). The six fragments came from three different sites (Antinoupolis, Tebtynis, and Oxyrhynchus) excavated by the Societá Italiana per la ricerca dei papiri greci e latini in Egitto during the first half of the 20th century. No other information about these fragments was available.
Initially, a rough analysis of the papyri fragments was done by SEM–EDXS and with an ATR–FTIR spectrometer.
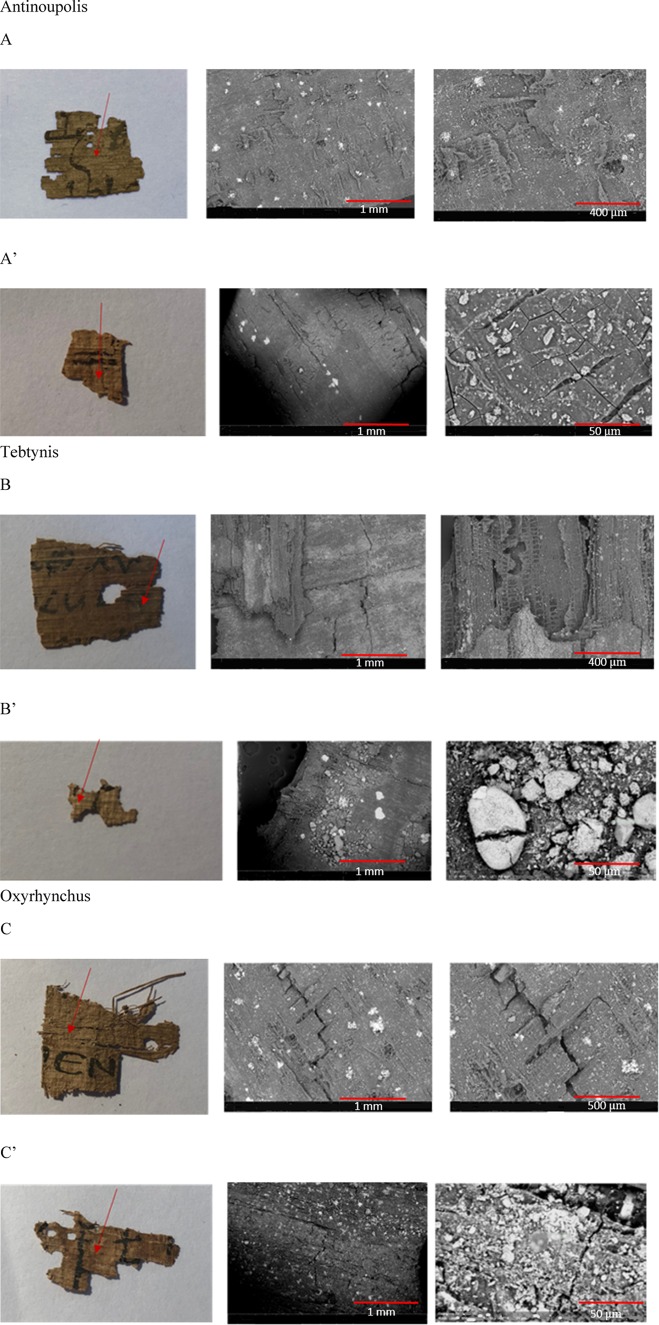
As shown in Figure 1, the SEM micrograph detail of the surface region of the examined fragments highlights the multilayer structure characterizing all the investigated samples: fibers and fractures are moreover evident in several fragments. Differences in compactness can be also seen in the region without ink, suggesting different manufacture procedures. Furthermore, on the surface of some of them, crystals can be also observed. These “white spots” (i.e., small crystal encrustations, almost absent in the Tebtynis papyrus fragment), have been identified on the basis of the EDXS analysis as sodium chloride, silicon, and calcium depositions. The presence of NaCl as small crystals on papyri is not unusual although their source is not clear yet. Different hypotheses have been formulated: NaCl could arise from the papyrus itself, from the manufactory procedure implying strips rewetting, or from subsequent contaminations. At the same time, the presence of silicon could also arise from the plant, whereas calcium origin is probably linked to the manufacture of the papyrus itself, as other studies already stated.15
Figure 1.
Visible and SEM images of six papyrus samples (A and A′: Antinoe, B and B′: Tebtynis, C and C′: Oxyrhynchus) analyzed in the region indicated by arrows.
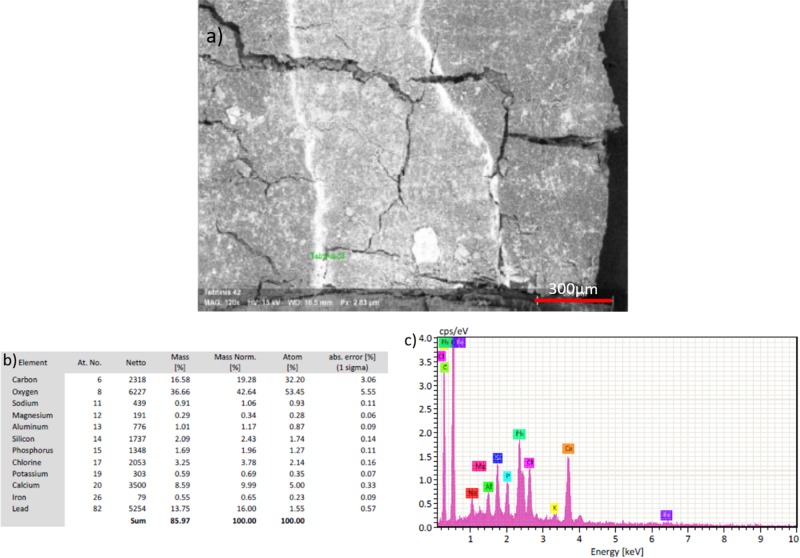
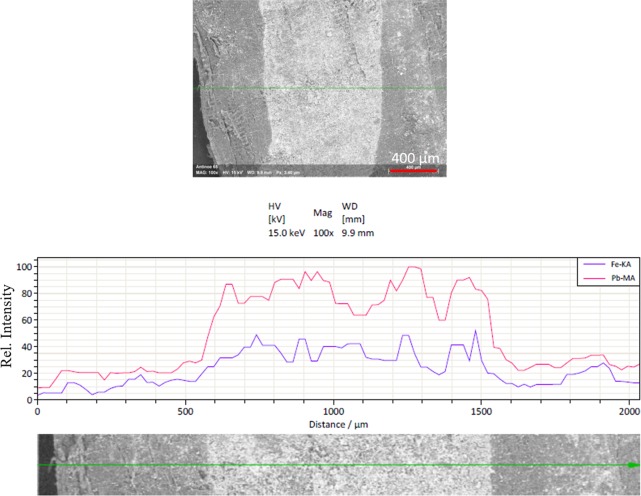
Furthermore, SEM–EDXS spectra (Supporting Information) show that all the examined ancient papyri fragments are constituted, as expected, by O, C, Ca, and Cl beside variable amounts of Al, P, S, K, Fe, and Si. Silicon, which is present in different amounts in all samples, is in the form of quartz grains, arising from sand (Table 1). Data that are much more interesting arise, however, by the EDXS analysis of the regions containing ink. In two samples, indeed, the presence of relevant amounts of heavy metals, in particular, Pb, was detected. Whereas most of the examined samples contain only small amounts of iron both in ink and bulk, sample B (Tebtynis papyrus ink in Figure 2) presents a significant amount of Pb (around 19%), and, when scanned, the Antinoe fragment A (Figure 3) shows that Pb is present at higher concentrations with respect to iron in the ink zone. The high concentration of Pb in the Tebtynis fragment seems to exclude contamination due to the water used to prepare the ink or to the employed inkpot, as the concentration is not only at a trace level. This might suggest that Pb was used by the scribe to give a specific effect to the work.
Table 1. Chemical Elements Revealed in the EDXS Analysis.
| fragment | inventory | dimensions (mm) | EDXS bulka | EDXS inka |
|---|---|---|---|---|
| A | Antinoupolis | 20 × 16 | K, Cl, Na, Si, Ca, | Pb, Si, Fe, K, Cl, Al, Na, Ca |
| A′ | Antinoupolis | 12 × 10 | Cl, Si, Na, K | Si, K, Ca, Cl, Fe, Na, Al |
| B | Tebtynis | 20 × 18 | Si, Ca, Al, Cl, Fe, Na | Pb, Ca, Cl, P, Si, Na |
| B′ | Tebtynis | 10 × 7 | Na, Si, Cl, Ca | Al, Si, Cl, K, Ca, Ti, Fe |
| C | Oxyrhynchus, | 24 × 19 | Cl, K, Na, Si, Ca | Si, Ca, Fe, Al, K, Cl, Na |
| C′ | Oxyrhynchus, | 24 × 10 | Cl, Si, Na, K, Ca, S | Si, Al, K, Fe, Na |
Quantitative scale
Figure 2.
SEM EDX analysis of the Tebtynis (B) papyrus black ink. (a) SEM image; (b) EDXS analysis; (c) element peaks of EDXS analysis.
Figure 3.
EDX line scans for Fe Kα (purple) and Pb Mα (pink) on the Antinoe (A) papyrus including the ink region.
Papyri are quite fragile and sensitive to dryness, and they are therefore normally wetted at the moment of finding. However, it is well-known that the presence of water in cellulosic materials can affect FTIR analysis of ancient and contemporary papyri, being the water bending band at around 1640 cm–1 able to shield the frequency range where we can find vibrations of cellulose products degradation (carbonyl groups). Thus, samples were gently dried in vacuum at 70 °C for 24 h, following a previously reported procedure, with slight modifications.3
As shown in Figure 4, the desorption of water from the Antinoe papyrus fragment A′ determines, as expected, a modification of the 1640 cm–1 band and the appearance of two new bands at around 1736 (practically, a shoulder) and 1618 cm–1, which could be attributed to aldehydic and conjugated ketonic groups arising from cellulose oxidation3 or on lignin, the other papyrus component.
Figure 4.
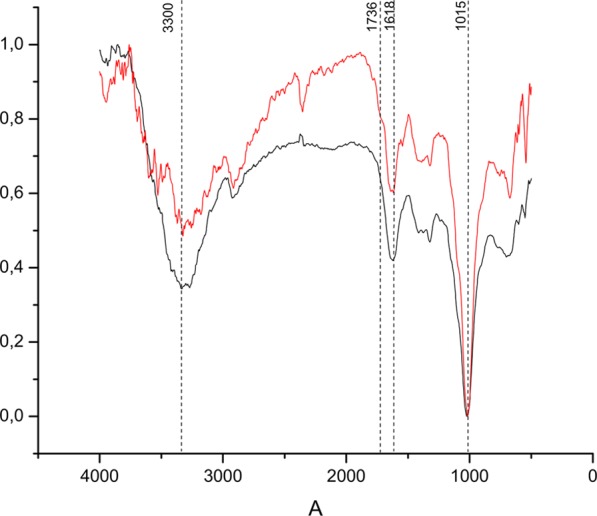
Normalized FTIR spectra of A′ Antinoe papyrus as it is (red) or after drying (black)
Furthermore, all the collected spectra (Supporting Information) both in the region with and without ink show a broad peak at around 3330 cm–1, imputable to the stretching band of cellulose OH and to the presence of water.16 At around 2900 cm–1 are instead the absorption bands due to aliphatic CH2 and CH stretching modes, whereas the small absorption bands between 1520 and 1200 cm–1 can be referred to stretching and deformations of various aromatic components of lignin. The strong absorption at 1000 cm–1 is instead due to the C–O stretching vibration mode of cellulose. Finally, small absorption bands between 800 and 500 cm–1 characterize all examined samples.
After drying, the more evident differences between fragment regions with or without ink, as well as among papyri fragments arising from different sites, appeared localized in the region between 1600 and 1100 cm–1, a region unfortunately characterized by the presence of a multitude of overlapped medium-weak bands (Figure 5). These FTIR spectra are removed from the average of about 1000 different spectra analyzed in regions without ink of papyri A, B, and C. At first glance, however, slight differences going from one sample to another can be evidenced.
Figure 5.
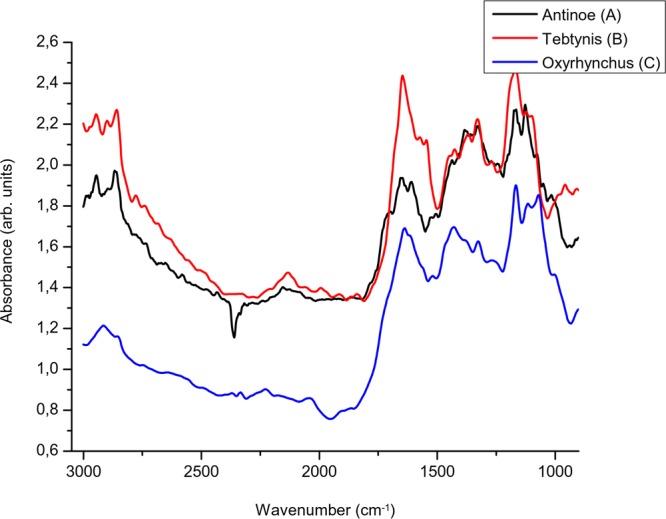
Spectra of papyrus fragments found in different sites: (A) Antinoe (black), (B) Tebtynis (red), and (C) Oxyrhynchus (blue)
In order to obtain further information about papyri and ink composition, the FTIR imaging analysis was performed on the same fragments.
In particular, analyses were conducted with 4 cm–1 resolution and 256 scans, in a range from 3000 to 900 cm–1, with 4 × 2 tiles mosaic, in absorbance mode. This procedure was applied to all six papyrus fragments. Different wavenumbers (2915, 1630, 1500, 1323, and 1020 cm–1) were monitored for each fragment in order to identify changes in false color images thanks to the focal plane array (FPA) detector and to make a comparison with respect to the visible picture of the papyri. This technique allowed us to obtain chemical and spatial information at a micrometer level. In particular, integrating the area of each band (1020, 1323, 1500, 1630, and 2915 cm–1), we obtained the corresponding false color image, representing the absorption intensity of a peculiar chemical group.
As expected, cellulose and lignin, characterized by the absorption bands at 1020 cm–1 (cellulose) and 1630, 1500, and 1323 cm–1 (lignin), are analogously distributed in all examined fragments. Generally, similar color variations from blue to red (blue: less concentrated, red: most concentrated) characterize, with the exception of B′ Tebtynis, all the fragments when monitored at 1020 cm–1 or 1630, 1500, and 1323 cm–1.
Finally, it is noteworthy that, whereas in the visible images, a clear distinction between regions containing or not ink can be immediately detected, in the false color images, this difference emerges only in the case of Antinoe sample, in particular when monitored at 2915 cm–1, corresponding to the stretching bands of aliphatic C–H. This could suggest, in our opinion, the presence in this region, and therefore in the employed ink, of higher concentrations of compounds containing long aliphatic chains, for example, the use of wax as binder could justify this behavior. It is noteworthy that Antinoe papyrus A contains also relevant amounts of Pb in the ink region, and the fact that this sample shows a different organic component associated to the same region might support the hypothesis that a different ink was used.
Finally, in order to evaluate more accurately eventual other differences in the chemical composition characterizing the examined papyri, principal component analysis (PCA) of the imaging spectra reported in Figure 6 has been performed. Second derivative spectroscopy was applied to the collected spectra to enhance resolution, obtaining information from molecular vibration data.
Figure 6.
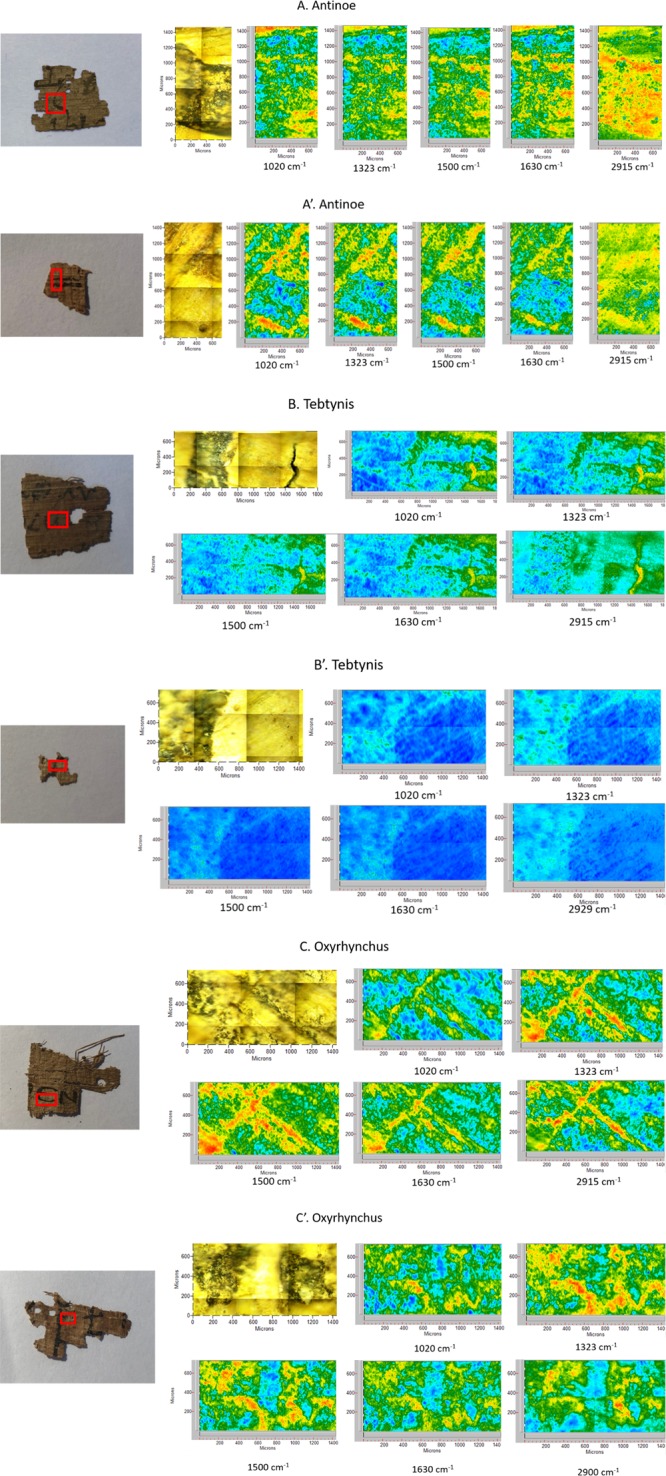
Visible and FPA images of six papyri (A and A′: Antinoe, B and B′: Tebtynis, C and C′: Oxyrhynchus) integrating the band at each indicated wavenumber.
Each recorded wavelength is a variable.17 The spectra has been sampled with a step of 1.93 cm–1, corresponding to a number of variables ranging from 1100 to 1300, and each point sampled by the FPA matrix corresponds to a different value for each variable (from 6500 to 8200 points, depending on sample size). PCA is indeed widely used when a large amount of data, in this case thousands of FTIR spectra for each sample, is available.17 A different and independent analysis has been performed for each sample. For each sample, the first principal component spectrum has been reported in Figure 7.
Figure 7.
Principal component analysis of FPA spectra of the six papyri. Wavenumber in cm–1. First principal components are reported. Transmittance are renormalized as centered unitary scale (−0.5 to 0.5). The scores are in percentage.
The percentage of information carried by each of these components lies in the range of 70–80%. This means that information is well concentrated, dispensing us from the analysis of further principal components. Interestingly, the most remarkable difference, as already noted in the visual analysis of Figure 6, has been found between the two Antinoe fragments: in the region of aliphatic C–H stretching modes, fragment A plot is relatively flat, whereas fragment A′ presents a large negative band. This behavior can be attributed to the presence in A of the previously mentioned organic compounds presenting long alkyl chains.
On the other hand, also the comparison of the fingerprint region between 900 and 1600 cm–1 for the six examined fragments shows significant differences that can be attributed to a modified composition in the species having absorption bands in this region, that is, to a different cellulose/lignin ratio and/or lignin composition. Hovewer, given the nature of samples, effects due to different initial compositions and to aging issues are, obiovusly, indistinguishable.
Conclusions
ATR–FTIR imaging and SEM–EDXS, when applied together, are able to provide important information to characterize and distinguish the ancient Egyptian papyri arising from different geographic areas. In particular, we have shown that chemometric approach applied to FTIR spectra can reveal subtle differences between fragments that are not obvious from simple inspection of the spectra. The possibility to interpret the loading spectra might provide a powerful tool to evaluate lignin and cellulose constituents.
Furthermore, SEM–EDXS analysis has shown the presence of lead in the ink region of one of the fragments, whereas the ATR–FTIR imaging has evidenced the presence in the same region of organic compounds characterized by long alkyl chains, suggesting a peculiar ink composition.
Methods
Papyri Fragments
The six papyrus fragments came from three different sites but in two distinct excavation campaigns during the first half of the 20th century, thanks to Societá Italiana per la ricerca dei papiri greci e latini in Egitto. The first site is Antinoupolis, an important city founded by the emperor Hadrian in 130 CE on the east bank of the Nile, about 300 km south of Cairo. Papyri from this site dated with certitude on the base of contents range from the 2nd to the 8th century CE. The second site is represented by Tebtynis, a village in the south part of the Fayyum region (ancient Arsinoite district). The excavations of this site by the Florentine mission were focused on the sanctuary of the crocodile god. The already studied fragments from this site range from the 2nd century BC to the beginning of the 3rd century CE. The last samples come from Oxyrhynchus, a city in Middle Egypt built on the West branch of the Nile called Bahr Jussuf (the canal of Joseph), about 160 km south of Cairo. Datable papyri from this site range mostly from the 1st to the 6th century AD.
All the papyri were subjected to FTIR analysis without any kind of preparation of the samples. Only a gentle drying procedure was done, in order to remove water. This was possible at a temperature of 70 °C under vacuum in a period of 24 h.
FTIR Analysis
In the macro-ATR study, each sample was analyzed thanks to a Cary 660 FTIR spectrometer with a ZnSe crystal and a DLaTGS detector in the range from 4000 to 500 cm–1, with 32 scans both for background and samples, with a resolution of 4 cm–1. FTIR spectroscopic imaging was conducted using an Agilent Cary 620 microscope coupled to the Cary 660 spectrometer in mosaic mode with a 4 × 2 image tiles and a 64 × 64 Focal Plane Array (FPA) detector cooled with liquid nitrogen. In this case, each image pixel corresponds to a unique infrared spectrum, which allows the determination of chemical composition in an area of 5.5 μm2. The spectral range was from 3000 to 900 cm–1, with 256 scans both for background and for sample, with a spectral resolution of 4 cm–1. In this last case, samples were subjected to a drying procedure in order to remove water at a temperature of 70 °C and under vacuum for 24 h before the analysis.
The Fourier transformation was conducted using Agilent Resolution Pro software.
SEM-EDX Analysis
SEM images were acquired on papyri using a FEI Quanta 450 ESEM FEG from Bruker. Typical imaging conditions were: magnification 130–180×, horizontal field width 3.19–1.48 mm, working distance 10.3 mm, HV 15.00 kV, and pressure 90 Pa.
PCA Analysis
Due to the very large amount of data that does not permit the use of statistical packages like R, a FORTRAN program has been written. BLAS and LAPACK standard routines for matrix handling and transformations have been used.
Acknowledgments
We kindly thank Dr. Francesca Maltomini of Istituto Papirologico Girolamo Vitelli (University of Florence) who provided us papyrus fragments and Prof. Maria Carmela Betró of University of Pisa who helped us with her experience with Egyptian history.
Supporting Information Available
The Supporting Information is available free of charge at https://pubs.acs.org/doi/10.1021/acsomega.9b03145.
Additional SEM images, EDX spectra, and FTIR spectra of all the analyzed papyri (PDF)
The authors declare no competing financial interest.
Notes
C.C., C.S.P., and S.S. designed and performed the research, analyzed data, and wrote the paper.
Supplementary Material
References
- Wiedeman H. G.; Bayer G. Papyrus The Paper of Ancient Egypt. Anal. Chem. 1983, 55, 1220A–1230A. 10.1021/ac00262a774. [DOI] [Google Scholar]
- Wiedemann H. G.; Bayer G. Thermoanalytical Study on Ancient Materials and Light It Sheds on the Origin of Letters and Words. Thermochim. Acta 1986, 100, 283–314. 10.1016/0040-6031(86)87062-9. [DOI] [Google Scholar]
- Łojewska J.; Rabin I.; Pawcenis D.; Bagniuk J.; Aksamit-Koperska M. A.; Sitarz M.; Missori M.; Krutzsch M. Recognizing Ancient Papyri by a Combination of Spectroscopic, Diffractional and Chromatographic Analytical Tools. Sci. Rep. 2017, 7, 46236. 10.1038/srep46236. [DOI] [PMC free article] [PubMed] [Google Scholar]
- Vichi A.; Eliazyan G.; Kazarian S. G. Study of the Degradation and Conservation of Historical Leather Book Covers with Macro Attenuated Total Reflection–Fourier Transform Infrared Spectroscopic Imaging. ACS Omega 2018, 3, 7150–7157. 10.1021/acsomega.8b00773. [DOI] [PMC free article] [PubMed] [Google Scholar]
- Spring M.; Ricci C.; Peggie D. A.; Kazarian S. G. ATR-FTIR Imaging for the Analysis of Organic Materials in Paint Cross Sections: Case Studies on Paint Samples from the National Gallery, London. Anal. Bioanal. Chem. 2008, 392, 37–45. 10.1007/s00216-008-2092-y. [DOI] [PubMed] [Google Scholar]
- Bruni S.; Guglielmi V.; Della Foglia E.; Castoldi M.; Bagnasco Gianni G. A Non-Destructive Spectroscopic Study of the Decoration of Archaeological Pottery: From Matt-Painted Bichrome Ceramic Sherds (Southern Italy, VIII-VII B.C.) to an Intact Etruscan Cinerary Urn. Spectrochim. Acta, Part A 2018, 191, 88–97. 10.1016/j.saa.2017.10.010. [DOI] [PubMed] [Google Scholar]
- Monico L.; Rosi F.; Miliani C.; Daveri A.; Brunetti B. G. Non-Invasive Identification of Metal-Oxalate Complexes on Polychrome Artwork Surfaces by Reflection Mid-Infrared Spectroscopy. Spectrochim. Acta, Part A 2013, 116, 270–280. 10.1016/j.saa.2013.06.084. [DOI] [PubMed] [Google Scholar]
- Rosi F.; Burnstock A.; Van den Berg K. J.; Miliani C.; Brunetti B. G.; Sgamellotti A. A Non-Invasive XRF Study Supported by Multivariate Statistical Analysis and Reflectance FTIR to Assess the Composition of Modern Painting Materials. Spectrochim. Acta, Part A 2009, 71, 1655–1662. 10.1016/j.saa.2008.06.011. [DOI] [PubMed] [Google Scholar]
- Http://Www.Rsc.Org/Learn-Chemistry/Resource/Res00001621/Egyptian-Materials-and-Pigments?Cmpid=CMP00004576#!Cmpid=CMP00006300
- Burgio L.; Clark R. J. H. Comparative Pigment Analysis of Six Modern Egyptian Papyri and an Authentic One of the 13th Century BC by Raman Microscopy and Other Techniques. J. Raman Spectrosc. 2000, 31, 395–401. . [DOI] [Google Scholar]
- Christiansen T.; Buti D.; Dalby K. N.; Lindelof P. E.; Ryholt K.; Vila A. Chemical Characterization of Black and Red Inks Inscribed on Ancient Egyptian Papyri: The Tebtunis Temple Library. J. Archaeol. Sci. Rep. 2017, 14, 208–219. 10.1016/j.jasrep.2017.05.042. [DOI] [Google Scholar]
- Brun E.; Cotte M.; Wright J.; Ruat M.; Tack P.; Vincze L.; Ferrero C.; Delattre D.; Mocella V. Revealing Metallic Ink in Herculaneum Papyri. Proc. Natl. Acad. Sci. 2016, 113, 3751. 10.1073/pnas.1519958113. [DOI] [PMC free article] [PubMed] [Google Scholar]
- Tack P.; Cotte M.; Bauters S.; Brun E.; Banerjee D.; Bras W.; Ferrero C.; Delattre D.; Mocella V.; Vincze L. Tracking Ink Composition on Herculaneum Papyrus Scrolls: Quantification and Speciation of Lead by X-Ray Based Techniques and Monte Carlo Simulations. Sci. Rep. 2016, 6, 20763. 10.1038/srep20763. [DOI] [PMC free article] [PubMed] [Google Scholar]
- Mocella V.; Brun E.; Ferrero C.; Delattre D. Revealing Letters in Rolled Herculaneum Papyri by X-Ray Phase-Contrast Imaging. Nat. Commun. 2015, 6, 5895. 10.1038/ncomms6895. [DOI] [PubMed] [Google Scholar]
- Olsson A.-M. B.; Calligaro T.; Colinart S.; Dran J. C.; Lövestam N. E. G.; Moignard B.; Salomon J. Micro-PIXE Analysis of an Ancient Egyptian Papyrus: Identification of Pigments Used for the “Book of the Dead.”. Nucl. Instrum. Methods Phys. Res. Sec. B: Beam Interac. Mater. Atoms 2001, 181, 707–714. 10.1016/S0168-583X(01)00545-6. [DOI] [Google Scholar]
- Azzarelli J. M.; Goods J. B.; Swager T. M. Study of Two Papyrus Fragments with Fourier Transform Infrared Microspectroscopy. Harvard Theological Rev. 2014, 107, 165–165. 10.1017/S0017816014000169. [DOI] [Google Scholar]
- Ami D.; Mereghetti P.; Maria S. Multivariate Analysis for Fourier Transform Infrared Spectra of Complex Biological Systems and Processes. Multivar. Anal. Manag. Eng. Sci. 2013, 10.5772/53850. [DOI] [Google Scholar]
Associated Data
This section collects any data citations, data availability statements, or supplementary materials included in this article.


