

Abstract

Cytosolic sulfotransferases (SULTs) acting as phase II metabolic enzymes can be used in the sulfonation of small molecules by transferring a sulfonate group from the unique co-factor 3′-phosphoadenosine 5′-phosphosulfate (PAPS) to the substrates. In the present study, molecular dynamics (MD) simulations and ensemble docking study were employed to theoretically characterize the mechanism for the effect of co-factor (PAP) and ligands (LCA, raloxifene, α-hydroxytamoxifen, ouabain, and 3′-phosphoadenylyl sulfate) on structural stability and selectivity of SULT2A1 from the perspective of the dynamic behavior of SULT2A1 structures. Structural stability and network analyses indicated that the cooperation between PAP and LCA may enhance the thermal stability and compact communication in enzymes. During the MD simulations, the obviously rigid region and inward displacement were detected in the active-site cap (loop16) of the conformation containing PAP, which may be responsible for the significant changes in substrate accessibility and catalytic activity. The smaller substrates such as LCA could bind stably to the active pocket in the presence of PAP. However, the substrates or inhibitors with a large spatial structure needed to bind to the open conformation (without PAP) prior to PAPS binding.
1. Introduction
Metabolism of drugs in the body mainly includes phase I and phase II reactions. To be specific, phase I metabolism can convert a parent drug to more polar (water soluble) active metabolites, occurring through oxidation, reduction, and hydrolysis, whereas phase II metabolism involves reactions that chemically change the drug or phase I metabolites into compounds that are soluble enough to be excreted in urine.1 As phase II metabolic enzymes, cytosolic sulfotransferases (SULTs) can be used in the sulfonation of small molecules by transferring a sulfonate group from the unique co-factor 3′-phosphoadenosine 5′-phosphosulfate (PAPS) to the substrates.2,3 Besides, they play a key role in detoxification by transforming a wide array of small endo- and exogenous substrates from pharmaceutical, nutritional, or environmental sources into more easily excretable metabolites.4,5 However, in some cases, SULTs transform their substrates to chemically reactive or toxic metabolites, thereby inducing severe side effects.3,6,7 Apart from the functional sulfonation of small molecules acting as substrates, various endo- and exogenous substances such as drugs and environmental products can inhibit SULTs so as to decrease sulfonation rates, therefore possibly promoting various diseases.8−11
Human cytosolic sulfotransferases (hSULTs) could be classified into four families (hSULT1, hSULT2, hSULT4, and hSULT6) based on sequence similarity.12,13 Many family members are estimated to have very broad and overlapping substrate specificities, which are required in their detoxifying roles. Besides, the co-factor binding to the active sites may further influence the spectrum of substrates.12 SULT2A1 is critical in xenobiotic metabolism in adults and is mainly found in the tissue and liver.14 To date, the crystal structures of SULT2A1 with co-factor 3′-phosphoadenosine 5′-phosphate (SULT2A1/PAP), SULT2A1 with substrate dehydro-epiandrosterone (SULT2A1/DHEA), SULT2A1 with substrate androsterone (SULT2A1/ADT), and SULT2A1 with co-factor PAP and substrate lithocholic acid (SULT2A1/PAP/LCA) have been accessible in the Protein Data Bank with PDB ID 1EFH, 1J99, 1OV4, and 3F3Y, respectively.13,15,16 Recent studies have found that the free enzyme and the ligand-bound complex show significant conformational differences in the active-site cap region (a dynamic ∼30 residue stretch of amino acids), which can dominate the specificity and activity of the enzyme.17,18 The SULT2A1 complex with the co-factor tends to exhibit a relatively closed entrance and a compact local structural ordering around the pathway, while the complex with the substrate shows an open entrance.19
In recent years, while experimental and structural studies on the SULT2A1 complex are generally developed, computer-based investigation for the ligand binding mechanism and accompanying structural differences remains scarce.17,20,21 In our study, a combination of molecular dynamics (MD) simulations and the ensemble docking study was applied to investigate the impact of ligands (co-factor and substrate) on the structural stability and selectivity of SULT2A1. We explored four systems for SULT2A1, including free enzyme, binary complexes (SULT2A1/PAP or SULT2A1/LCA), and ternary complex (SULT2A1/LCA/PAP). The computational data may prove that the binding of ligands (PAP and LCA) had a significant impact on the structural stability of SULT2A1, and the PAP binding generating the structural displacement in the active-site cap (loop16) could affect the substrate selectivity of SULT2A1. Our investment could provide the theoretical basis for the discovery of the binding mechanism of SULT2A1.
2. Results and Discussion
2.1. Structural Stability Analysis
In general, enzymes working during metabolism have rather broad and overlapping substrate specificities. It is reported that SULT2A1 shows the highly flexible active binding pocket, including loop5 (residues 42–45), loop7 (residues 76–79), loop12 (residues 138–144), and loop16 (residues 227–251). Particularly speaking, loop16 simultaneously mediates substrate and co-factor interactions and is defined as the dynamic active-site cap. Here, the dynamics-based analysis of structural stability was employed for different ligand binding complexes. First, analyses of the root-mean-square deviation (rmsd) of the protein backbone were calculated to describe conformational changes of the four systems. As shown in Figure 1A, all three systems remained comparatively stable for at least 200 ns except for SULT2A1 without any ligand. Especially, the PAP-bound complexes experienced the more stable trend than the conformations without co-factor bounds. The probabilities based on the rmsd plots (Figure 1B) indicated that the rmsd value of SULT2A1/LCA/PAP fluctuated at 0.5–1.5 Å, which was the lowest among the four systems. The radius of gyration (Rg) is often used to estimate the potential for the plasticity of the protein structure. The plot of Rg and corresponding probability (Figure 1C,D) indicated that the Rg value of the SULT2A1/LCA/PAP complex was stabilized at around 18.6 Å, which represented the most compact structure compared with that of other three systems, while the Rg value of enzymes without any ligand was approximately 19.0 Å. Besides, the structure of the SULT2A1/PAP complex was more coherent than that of the enzyme with the substrate LCA-bound (SULT2A1/LCA). Further, the solvent accessible surface area (SASA) is able to quantify the area in enzymes exposed to the solvent. It is now a commonly accepted concept that the active site of the enzyme is located in the cavity of the hydrophobic environment. Because the substrate is bound with the active site, the interaction between the substrate and the catalytic group will be stronger than that in the polar environment. The tendencies of SASA for the active binding pocket and its relative frequency (Figure 1E,F) showed that the SASA contribution of the SULT2A1/LCA/PAP complex was the lowest among the four systems, which indicated that the SULT2A1/LCA/PAP complex could provide a decent hydrophobic environment for the next substrate binding. All these suggested that the co-factor (PAP) and substrate (LCA) showed mutual stabilizing effect for each other and the cooperation between them had synergy effect on the thermal stability of the enzyme.
Figure 1.

Stability analysis for SULT2A1 (yellow), SULT2A1/LCA (pink), SULT2A1/PAP (green), and SULT2A1/LCA/PAP (blue) during the 500ns simulations. (A) rmsd plot and (B) corresponding frequency. (C) Radius of gyration (Rg) plot and (D) corresponding frequency. (E) Average SASA plot and (F) corresponding frequency for the active binding pocket of structures.
2.2. Ligand Binding Enhanced the Communication between Residues in Protein–Ligand Complexes: Network Centrality and Protein Structure Network Analysis
To explore the effect of ligands on the structural communication of the active site, we employed the network centrality parameter, namely, betweenness, for studying the representative structures obtained from the four trajectories. The betweenness analysis enables us to identify the critical mediating node as a bridge for communication between residues in network graphs. The frequency distribution graphs of the betweenness values (Figure S2) indicated that the frequency of complexes combined with PAP had a longer tail of the distribution in comparison with other two conformations (SULT2A1 and SULT2A1/LCA), which indicated that the PAP binding may induce a dramatic promotion of communication flow through several functional residues. In order to verify this conjecture, the betweenness calculation for every residue was performed to establish a relationship between the structural stability and network centrality in functional residues (Figure 2A). In the SULT2A1/LCA/PAP complex, the betweenness graph revealed the noticeable peaks in accordance with relatively flexible residues gathered at the active binding site (loop5, loop7, and loop12) and its surrounding region (loop3 and α7/α8), while the enzyme without any ligand binding showed the lowest betweenness value among four structures (Figure 2A,B). The high betweenness residue is apt to establish a more compact communication module connecting structurally stable communities, which may be responsible for the stable conformation.
Figure 2.

Network centrality and protein structure network analysis of the four representative structures, including the SULT2A1 (yellow), SULT2A1/LCA (pink), SULT2A1/PAP (green), and SULT2A1/LCA/PAP (blue) conformations. (A) Residue-based betweenness profiles. (B) Structural mapping of high betweenness residues for the representative structure of the SULT2A1/LCA/PAP complex. (C) Distribution of cliques. (D) Distribution of communities. (E) Degree distribution of residue hubs.
Then, the structure-based network analysis was carried out to detect the stable interaction communities/cliques and the organization of local hubs for the representative structures obtained from the four trajectories. The cliques are defined as a group node (k = 3, k = 4, and k = 5), which are connected to each other. As depicted in Figure 2C, the number of cliques for PAP-bound complexes (SULT2A1/PAP and SULT2A1/LCA/PAP) (the clique number = 440) was larger than that for the free enzyme and SULT2A1/LCA complex (the clique number = 395, 382). Similarly, the total number of stable communities for PAP-bound complexes moderately increased compared with that for free enzyme and only LCA-bound complex (Figure 2D). In addition, the local residue hubs in the networks were also computed to describe the degree of highly connected nodes (at least 4). As shown in the graph (Figure 2E), when the degree of a residue hub (the number of nodes in a hub) was greater than 8, the larger distribution of hubs was detected in the SULT2A1/LCA/PAP complex, which could be responsible for the tighter connectivity of communities in the ternary complex.
Finally, the subnetworks for interfaces between ligands and protein were extracted to comprehend the discrepancy of binding affinity of PAP and LCA for complexes (Figure 3). The interfaces revealed that the cooperation of PAP and LCA binding may strengthen the interactions between ligands and protein, reflected in the fact that the number of interactions in the ternary complex was greater than that in the PAP- or LCA-binding complexes. Given these results, we could figure out that the combination of PAP may give rise to more inseparable communication between nodes in the active pockets and more stable interaction between ligands and protein in a synergistic fashion. On the contrary, we could conclude that the substrate LCA as a small ligand was difficult to stably bind to the conformation in the absence of PAP. The results obtained here slightly differ from the known conclusions. Cook et al. stated that the active-site access to ligands that are small enough to pass through the closed pore should not be restricted by the position of the active-site cap (or the presence of PAP).17
Figure 3.

Subnetwork analysis of the protein–ligand interaction. The subnetwork between protein and co-factor PAP in the (A) SULT2A1/PAP complex and (B) SULT2A1/LCA/PAP complex. The subnetwork between protein and substrate LCA in the (C) SULT2A1/LCA complex and (D) SULT2A1/LCA/PAP complex.
2.3. Effect of Ligands on Protein–Ligand Interaction
Because proteins perform their functions through their interaction with ligands, the interaction between the ligand and protein is crucial for understanding biochemical processes in drug designing and pharmacology. Here, the probability of hydrogen bond formation between protein and ligands is listed in Table 1. Obviously, the hydrogen bond interaction between ligands and protein in the SULT2A1/LCA/PAP complex was stronger than that in the PAP- or LCA-bound complex. Specifically, for the interaction of protein and substrate LCA, the hydrogen bonds were centered on residues Tyr231 and Tyr238 located at loop16 (the active-site cap), and their occupancy in the ternary complex was larger than that in the SULT2A1/LCA complex. Besides, one new hydrogen bond was formed between residue Asn48 (located in α2) and the substrate LCA in the ternary complex. Further insights into the interactions between protein and PAP help comprehend the fact that residues Lys44 (located in loop5) could form more stable hydrogen bonds with co-factor PAP in the ternary complex compared with the SULT2A1/PAP complex, which are 93.1 and 75.8%, respectively. Equivalently, the occupancy of the hydrogen bond occurred in residues Thr47/Asn48 (located in α2), Arg121/Ser129 (located in α7), and Arg247/Lys248/Gly249 (located in loop16) of the ternary complex was larger than that of the SULT2A1/PAP complex. Apart from hydrogen bond interaction, the alkyl−π interaction, one of the weak interactions, was calculated for ligand-bound complexes on 500 ns time scales. Seen from the visual inspection of structures in Figure 4A,B, residues Phe18, Trp72, Trp77, and Tyr238 could form alkyl−π interaction with the substrate LCA. As shown in Figure 4C–F, it is apparent that the distance between two atoms which could form alkyl−π interaction in the ternary complex could be stable at around 4–5 Å, indicating the stronger interactions compared with that in the SULT2A1/LCA complex. All these results could offer a clue that the cooperative binding of the co-factor and substrate could remarkably strengthen the protein–ligand interactions, which is critical for proteins to accomplish their functions through binding with various ligands. At the same time, it is further confirmed that the substrate LCA could strongly interact with protein in the presence of PAP.
Table 1. Probability of Hydrogen Bond Formation between Protein and Ligands (PAP and LCA) for the SULT2A1, SULT2A1/LCA, SULT2A1/PAP, and SULT2A1/LCA/PAP Structures during the 500 ns Simulations.
| system | donor | receptor | occupancy (%) | donor | receptor | occupancy (%) |
|---|---|---|---|---|---|---|
| 2A1/LCA | Y238:OH | LCA:OE2 | 15.8 | Y231:OH | LCA:O3 | 11.3 |
| Y238:OH | LCA:OE1 | 14.9 | ||||
| 2A1/LCA/PAP | Y238:OH | LCA:OE2 | 35.8 | Y231:OH | LCA:O3 | 30.6 |
| Y238:OH | LCA:OE1 | 33.6 | N48:ND2 | LCA:O3 | 21.6 | |
| 2A1/PAP | G249:N | PAP:O1P3 | 67.3 | R121:NH2 | PAP:O3P3 | 56.0 |
| K248:N | PAP:O1P3 | 52.4 | N48:N | PAP:O2P | 84.5 | |
| R247:NE | PAP:O2P3 | 64.9 | N48:ND2 | PAP:O2P | 67.3 | |
| R247:NH2 | PAP:O3P3 | 38.1 | T47:OG1 | PAP:O1P | 83.0 | |
| S129:OG | PAP:O2P3 | 64.3 | K44:NZ | PAP:O3P | 75.8 | |
| 2A1/LCA/PAP | G249:N | PAP:O1P3 | 92.0 | R121:NH2 | PAP:O3P3 | 92.6 |
| K248:N | PAP:O1P3 | 82.8 | N48:N | PAP:O2P | 88.4 | |
| R247:NE | PAP:O2P3 | 88.1 | N48:ND2 | PAP:O2P | 87.4 | |
| R247:NH2 | PAP:O3P3 | 84.6 | T47:OG1 | PAP:O1P | 92.8 | |
| S129:OG | PAP:O2P3 | 92.9 | K44:NZ | PAP:O3P | 93.1 |
Figure 4.

Distance between the substrate LCA and the residues (Phe18, Trp72, Trp77, and Tyr238) that can form alkyl−π interactions with LCA. The structural visualization of alkyl−π interactions for the (A) SULT2A1/LCA complex and (B) SULT2A1/LCA/PAP complex. Distance changes of interaction between (C) LCA and Tyr 238, (D) LCA and Trp77, (E) LCA and Trp72, and (F) LCA and Phe18, respectively.
2.4. Structural Motion after Binding of Ligands
To explain the enhancement of protein–ligand interaction and the communication between residues in the network from the perspective of conformational changes, the analysis of the correlated intermolecular motions was performed as shown in Figure 5, which can reflect the intense relevant conformational changes in protein regions. In general, the red regions represented as positive values indicated the strongly correlated motions of residues, while the blue regions standing for negative values may be associated with the anticorrelated movements. The diagonal region showed the highly correlated structural motions because it was the relevant movement of a residue with itself. Apparently, SULT2A1 without any ligand displayed the largest thermal fluctuations among the four systems (Figure 5A). The substrate- or co-factor-bound complexes (SULT2A1/LCA or SULT2A1/PAP) experienced the decreased flexibility, which manifested as the lighter color in the cross-correlation matrix maps (Figure 5B,C). The correlated motion of the ternary complex became the weakest (Figure 5D), which is consistent with the structural stability analysis above. Besides, the fluctuations of the dynamic active-site cap (loop16) in the four systems signified the steadiest conformational mobility in the ternary complex.
Figure 5.
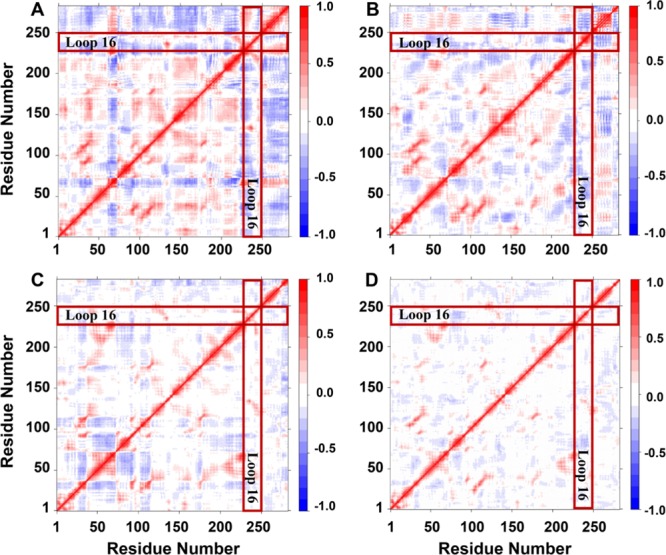
Dynamical cross-correlation map for the 500 ns MD trajectories of the (A) SULT2A1, (B) SULT2A1/LCA, (C) SULT2A1/PAP, and (D) SULT2A1/LCA/PAP complexes. Positive regions (colored in red) indicated strongly correlated residue motions, whereas negative regions (colored in blue) indicated anti-correlated movements. The position of the active site cap (loop16) was highlighted by boxes in each map.
Through in-depth studies of the specific motion trend and dominant motions of the four systems during the 500 ns MD, the first principal components of the Cα atoms (PC1) were visualized with the color scale from blue to red depicting low to high atomic displacement (Figure 6). Notably, the PC1(s) of loop12/loop16 (the active site) in the apo-enzyme showed the moderate atomic displacement (Figure 6A). The quite active motions occurred in the PC1(s) of loop7/loop16 in the SULT2A1/LCA complex (Figure 6B) and that of loop12 in the SULT2A1/PAP complex (Figure 6C). Conversely, the motion of the active-site loop was much weaker in the presence of PAP and LCA (Figure 6D) compared with that of other three systems, which conforms well to the cross-correlation analysis mentioned above. These analyses of structural motion suggested that the cooperative binding of PAP and LCA could strengthen the compactness of the protein. Especially for the active binding site, these loops showed obvious and stable rigidity in the ternary complex. In addition, we could detect that the PAP binding resulted in the structural rearrangement in the active-site cap (loop16) with an inward moving trend (closed motion). Such a dynamic motion detected in the simulation is in agreement with the model proposed by Cook et al., which allows the enzyme to isomerize between open and closed states when PAPS is bound.17 The free energy landscape (FEL) was depicted to characterize the first two principal components of the Cα trajectory. As shown in Figure S3, the surface of the SULT2A1/LCA/PAP complex was flatter than that of other three systems. In addition, the lowest-energy region for the ternary complex was achieved after 110 ns and was the largest zone compared with that of other three complexes, which indicated that the co-factor- and substrate-bound complex went through a relatively short transition stage to reach equilibrium. The lowest-energy structures from the four trajectories were obtained at 245, 170, 136, and 118 ns, respectively. All these structures were extracted as representative structures for the protein structure network analysis mentioned above.
Figure 6.
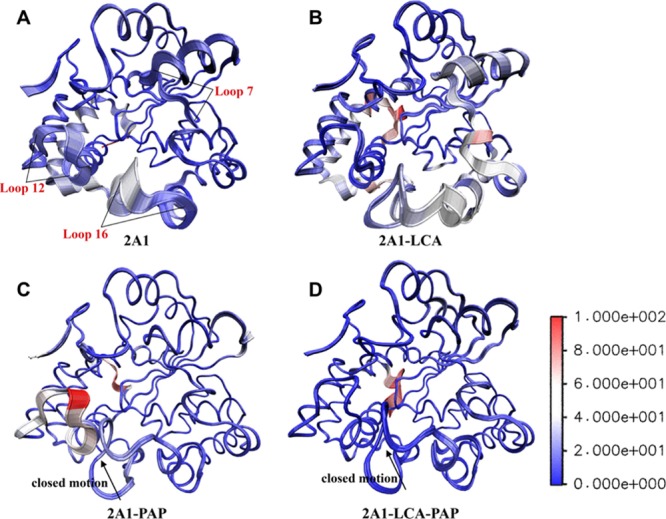
Visualization of the first principal component of the (A) SULT2A1, (B) SULT2A1/LCA, (C) SULT2A1/PAP, and (D) SULT2A1/LCA/PAP trajectories. Color scale from blue to red depicts low to high atomic displacements.
Further, the dynamics-based analysis of the pliability of the dynamic active-site cap (loop16) also confirmed the motion results. As shown in Figure 7A,F, loop16 of the SULT2A1/LCA/PAP complex experienced minimal conformation variations among the four systems, with a fluctuation of 0.84 Å. Loop16 of the SULT2A1/PAP complex was more stable than that of SULT2A1 containing LCA only (SULT2A1/LCA), corresponding to fluctuations of 1.94 and 2.55 Å, respectively (Figure 7E,C). Notably, there was significant inward displacement of the cap in the PAP-binding structure, which has been reported crucial for substrate selectivity (Figure 7D).17,22 It has been reported that the active-site cap (loop16) is segmented into two parts that cover the co-factor and the substrate binding site.17 From the fluctuation analysis, we could detect that the presence of PAP resulted in stabilization of the cap with a closed conformation, which may provide a clue for the assumption that the substrate LCA is prone to stably interact with protein in the PAP-containing complex rather than the SULT2A1 structure without PAP binding.
Figure 7.

Fluctuation of the active-site cap (loop16) for four systems. (A) Total rmsd plot of four MD simulations. Superposition of extracted enzyme conformations from MD trajectories for the (B) SULT2A1, (C) SULT2A1/LCA, (E) SULT2A1/PAP, and (F) SULT2A1/LCA/PAP complexes. (D) Conformational distribution of the first cluster of the active-site cap region (loop16) and crucial active loop (loop3) in the SULT2A1 (colored in pink) and SULT2A1/PAP (colored in red) enzymes.
2.5. Selectivity of SULT2A1 Based on the Plasticity of a Conserved Active-Site Cap
Apart from the effect of SULT2A1 on small molecules which act as substrates, SULT2A1 can also be inhibited by a variety of endogenous or exogenous substances that perform their inhibitor functions.9−11 Inspired by the work of Martiny et al.,23 we decided to explore the selectivity of SULT2A1 using the ensemble docking method. Because molecular docking has been optimized for the prediction of ligand binding positions and affinity, our goal was to research the selectivity of sulfotransferases based on the position and affinity from the best mode. To obtain sufficient protein structures for the ensemble docking, cluster analysis was performed on two MD simulation trajectories (SULT2A1/LCA and SULT2A1/LCA/PAP). After clustering, the frames of SULT2A1/LCA and SULT2A1/LCA/PAP trajectories were divided into five and six clusters according to conformational similarity (Figure S4). After removing the LCA from the representative structures, 177 substrates and inhibitors collected from the BRENDA database (Figures S5 and S6) were docked in these structures. Here, the lowest binding affinity of the docked conformation was visualized in heat maps (Figure S7). It is worth noting that a large proportion of small molecules docked with the closed SULT2A1/LCA/PAP conformation (shown as the deeper color) presented lower energy compared with the SULT2A1/LCA complex. However, for very small ligands such as 1-butanol (no. 28), 2-propanol (no. 55), ethanol (no. 117), and methanol (no. 126), there was almost no binding affinity for either open or closed conformations. Further, the free energy of large-size molecules, such as raloxifene (no. 21), 3′-phosphoadenylyl sulfate (no. 145), and adenosine 3′,5′-bisphosphate (no. 156) binding to the open conformation (SULT2A1/LCA), was lower than that of the molecules binding to the closed conformation. In addition, the binding affinity of α-hydroxytamoxifen (no. 94) and ouabain (no. 131) for open conformation was merely slightly lower than that for the closed one. By comparing the size of these molecules, we suspected that the larger the molecule is, the easier it is to combine with the open SULT2A1/LCA.
Visualization of the docking position is presented in Figure 8. In the absence of the PAP structure, the docking positions were dispersed both at the substrate and co-factor binding pocket (Figure 8A). However, in the presence of the PAP structure, most of substrates and inhibitors were aptly docked into the substrate binding pocket except for several molecules with large size. The visualization of large-molecule docking events (Figure 8C,D) indicated that the large molecules were merely able to bind to the open structure (without PAP) because in the PAP-containing structure, the inward motion of the cap narrowed the space of the substrate binding pocket to prevent the large molecules such as raloxifene (no. 21) from binding in the active binding pocket. Moreover, the computed atlas of surface topography of the protein (CASTp) server24 was used to measure the area and volume of the active pocket. The results of calculation are listed in Table 2. We could find that the area and volume of the SULT2A1/LCA/PAP complex decreased approximately 50% compared with that of the SULT2A1/LCA complex, reflecting significant discrepancy in substrate accessibility between the presence and absence of PAP, which may be pivotal in the catalytic process. The structure diagram of representative structures confirmed that the active binding pockets of SULT2A1/LCA/PAP displayed relatively narrow space compared with the conformations without PAP (Figure S8). Based on these results, we could conclude that the structural rearrangement of the active-site cap (loop16) upon PAP binding determined the selectivity of the substrates, which fits with the study of the binding affinities of SULT2A1 presented by Cook et al.17,18 Their binding studies showed that the affinity of raloxifene will decrease in the presence of PAP; Kd (raloxifene) increases 21-fold (1.1 ± 0.2 to 29 ± 4 μM) at a saturating concentration of PAP.17 To be efficiently sulfated, the large substrate such as raloxifene with a side group needed to bind to the open conformation (without PAP) prior to PAP binding, which can also be seen in the study of structural rearrangement of SULT2A1 published by Cook et al.22 Nevertheless, the smaller substrate, such as LCA, was more likely to bind in the closed substrate binding pocket (with PAP) because the closed conformation may provide a more favorable space and environment of the pocket that may enhance the binding affinity between protein and ligands.
Figure 8.

Structural visualization of the ensemble docking events of SULT2A1 ligands and representative protein conformations extracted from MD simulations. No. 1–177 ligands docked with (A) SULT2A1/LCA and (B) SULT2A1/LCA/PAP conformations. Comparison of docking conformations for the large ligands docked with (C) SULT2A1/LCA and (D) SULT2A1/LCA/PAP conformations, respectively.
Table 2. Results of the Area and Volume of the Active Pocket Calculated by the CASTp Server.
| system | structure | area_sa (Å2) | vol_sa (Å3) |
|---|---|---|---|
| 2A1 | 1 | 1917.798 | 1418.356 |
| 2 | 1215.209 | 874.937 | |
| 2A1/PAP | 1 | 876.189 | 460.191 |
| 2 | 846.406 | 480.631 |
2.6. Interaction Fingerprint Analysis
To investigate the interactions between protein and ligands in the open and closed complexes, we generated the interaction fingerprint (IFP) analysis based on the docking conformations. In the open SULT2A1/LCA complexes (Table 3), Phe18 (located in loop3), Lys44 (located in loop5), Trp72 (located in α3), Trp77 (located in loop7), Phe133/Trp134 (located in α7/α8), Phe139 (located in loop12), Tyr160 (located in loop13), and Leu234 (located in loop16) were critical for the ligand binding. Specifically, most ligands (92 and 84%) could form strong hydrophobic interactions with Phe18 and Phe133, respectively. A part of ligands (56, 40, 56, and 56%) could form polar interactions with Lys44, Asn48, His99, and Tyr160 separately. Further, for the closed SULT2A1/LCA/PAP conformation (Table 4), we could figure out that Pro14/Met16/Gly17/Phe18 (located in loop3), Pro43/Lys44 (located in loop5), Asn48 (located in α2), Trp77 (located in loop7), Phe133/Trp134 (located in α7/α8), Phe139 (located in loop12), Tyr160 (located in loop13), and Tyr 231/Leu234/Tyr238 (located in loop16) mainly participated in ligand binding. Compared to open conformation, more ligands could form hydrophobic interactions with Met16, Phe139, Phe18, Phe133, and Leu234, respectively. In addition, polar interaction was more important to stabilize the structure, indicating that more ligands (72, 96, and 72%) could form polar interactions with Lys44, Asn48, and His99 compared with the SULT2A1/LCA complex. Overall, for most ratio ligands, α2, loop3, loop5, α7/α8, and loop16 of closed conformation (PAP-containing) played a more important role in ligand binding in comparison with the interactions in open conformation.
Table 3. Structural IFP Analysis Based on the Docking Conformations of Open SULT2A1/LCA Complexes.
| amino acid | any | backbone | side chain | polar | hydrophobic | H-bond acceptor | H-bond donor | aromatic |
|---|---|---|---|---|---|---|---|---|
| M16 | 0.32 | 0.04 | 0.02 | 0.12 | 0 | 0.04 | 0 | 0 |
| G17 | 0.28 | 0.04 | 0 | 0.08 | 0 | 0.04 | 0 | 0 |
| F18 | 0.92 | 0 | 0.28 | 0 | 0.92 | 0 | 0 | 0.16 |
| K44 | 0.72 | 0.04 | 0.44 | 0.56 | 0 | 0 | 0.32 | 0 |
| N48 | 0.52 | 0 | 0.24 | 0.40 | 0 | 0.04 | 0.20 | 0 |
| I71 | 0.32 | 0 | 0 | 0.08 | 0.32 | 0 | 0 | 0 |
| W72 | 0.80 | 0.08 | 0.28 | 0.04 | 0 | 0 | 0 | 0 |
| S75 | 0.24 | 0 | 0.04 | 0.24 | 0 | 0.04 | 0 | 0 |
| W77 | 0.96 | 0 | 0.88 | 0.32 | 0 | 0 | 0.04 | 0.36 |
| E79 | 0.56 | 0 | 0.24 | 0.32 | 0 | 0.12 | 0 | 0 |
| S80 | 0.48 | 0 | 0.08 | 0.20 | 0 | 0.08 | 0 | 0 |
| H99 | 0.96 | 0 | 0.44 | 0.56 | 0 | 0.16 | 0.12 | 0 |
| F133 | 0.84 | 0 | 0.32 | 0 | 0.84 | 0 | 0 | 0.04 |
| W134 | 0.88 | 0 | 0.48 | 0.20 | 0 | 0 | 0.08 | 0.12 |
| M137 | 0.16 | 0 | 0.16 | 0.04 | 0.16 | 0 | 0 | 0 |
| F139 | 0.76 | 0 | 0.36 | 0 | 0.76 | 0 | 0 | 0.02 |
| Y160 | 0.84 | 0 | 0.28 | 0.56 | 0 | 0.24 | 0.04 | 0 |
| Y231 | 0.56 | 0 | 0.40 | 0.24 | 0 | 0.04 | 0.08 | 0 |
| L234 | 0.68 | 0 | 0.36 | 0 | 0.72 | 0 | 0 | 0 |
| Y238 | 0.40 | 0 | 0.32 | 0 | 0 | 0 | 0 | 0.02 |
Table 4. Structural IFP Analysis Based on the Docking Conformations of Closed SULT2A1/LCA/PAP Complexes.
| amino acid | any | backbone | side chain | polar | hydrophobic | H-bond acceptor | H-bond donor | aromatic |
|---|---|---|---|---|---|---|---|---|
| P14 | 0.92 | 0 | 0.44 | 0 | 0 | 0 | 0 | 0 |
| M16 | 1 | 0.02 | 0.02 | 0.36 | 1 | 0.04 | 0 | 0 |
| G17 | 0.64 | 0.12 | 0 | 0.12 | 0 | 0 | 0 | 0 |
| F18 | 0.96 | 0 | 0.20 | 0 | 0.96 | 0 | 0 | 0.12 |
| P43 | 0.84 | 0.12 | 0.04 | 0.04 | 0 | 0 | 0 | 0 |
| K44 | 0.72 | 0.20 | 0.02 | 0.72 | 0 | 0 | 0.76 | 0 |
| T47 | 0.44 | 0 | 0.44 | 0.44 | 0 | 0.04 | 0.48 | 0 |
| N48 | 0.96 | 0 | 0.32 | 0.96 | 0 | 0 | 1 | 0 |
| W72 | 0.68 | 0.12 | 0.36 | 0.20 | 0 | 0.04 | 0 | 0 |
| S75 | 0.04 | 0.04 | 0.02 | 0.04 | 0 | 0 | 0 | 0 |
| W77 | 0.72 | 0.20 | 0.70 | 0.40 | 0 | 0.04 | 0.16 | 0.12 |
| S80 | 0.52 | 0 | 0.20 | 0.32 | 0 | 0.12 | 0 | 0 |
| H99 | 0.92 | 0 | 0.52 | 0.72 | 0 | 0 | 0.28 | 0 |
| F133 | 0.92 | 0 | 0.12 | 0.04 | 0.92 | 0 | 0 | 0 |
| W134 | 1 | 0 | 0.60 | 0 | 0 | 0 | 0 | 0.16 |
| M137 | 0.12 | 0 | 0 | 0 | 0.12 | 0 | 0 | 0 |
| F139 | 1 | 0 | 0.80 | 0 | 1 | 0 | 0 | 0.28 |
| Y160 | 0.84 | 0 | 0.20 | 0.32 | 0 | 0.08 | 0 | 0 |
| Y231 | 0.92 | 0.04 | 0.36 | 0.36 | 0 | 0.20 | 0 | 0 |
| L234 | 0.88 | 0 | 0.24 | 0 | 0.88 | 0 | 0 | 0 |
| Y238 | 0.76 | 0 | 0.52 | 0.24 | 0 | 0 | 0.04 | 0.12 |
2.7. Structural Stability and Movement after Binding of Large Ligands
To explore the structural stability and movement of large molecules for the open/closed conformation, raloxifene (no. 21), α-hydroxytamoxifen (no. 94), ouabain (no. 131), and 3′-phosphoadenylyl sulfate (no. 145) bound to SULT2A1 and SULT2A1/PAP structures were used in MD simulation with 500 ns time scales. Seen from Figure S9, the rmsd of the protein backbone calculations was performed to describe conformational changes of the four systems. It is obvious to find that the PAP-bound complexes experienced the more stable trend than the conformations without PAP. The compactness of the protein structure was estimated using the Rg calculation (Figure S10). Apparently, the PAP-binding complexes were more coherent than the structures without the presence of PAP.
Thus, it is interesting to investigate the intense relevant conformational changes in protein regions based on these MD trajectories. The map of correlated intermolecular motions (Figure S11) indicated that the PAP-containing structures displayed the lighter thermal fluctuations compared to the structures without PAP, which were reflected in shallower color in the map. In addition, the first principal components of the Cα atoms (PC1) were visualized to describe the specific motion trend with the color scale from blue to red depicting low to high atomic displacement (Figure 9). Notably, the PAP binding was able to stabilize the motion of the structure and promote loop16 present in an inward mode (Figure 9B,D,F,H). Furthermore, from analysis of the pliability of loop16 (Figure 10), we could detect that the PAP binding resulted in the more rigid conformation than the structures without PAP. Meanwhile, the closed mode in loop16 occurred after PAP binding. The cooperative binding of PAP and inhibitors could not only strengthen the compactness of the protein but also induce the closed motion in loop16. These analyses of structural stability and motion are consistent with the analysis based on the MD simulations of LCA and/or PAP binding.
Figure 9.

Visualization of the first principal component of the (A) SULT2A1/α-hydroxytamoxifen, (B) SULT2A1/α-hydroxytamoxifen/PAP, (C) SULT2A1/ouabain, (D) SULT2A1/ouabain/PAP, (E) SULT2A1/3′-phosphoadenylyl sulfate, (F) SULT2A1/3′-phosphoadenylyl sulfate/PAP, (G) SULT2A1/raloxifene, and (H) SULT2A1/raloxifene/PAP trajectories. Color scale from blue to red depicts low to high atomic displacements.
Figure 10.

Fluctuation of the active-site cap (loop16) for eight systems. Superposition of extracted enzyme conformations from MD trajectories for the (A) SULT2A1/α-hydroxytamoxifen, (B) SULT2A1/α-hydroxytamoxifen/PAP, (C) SULT2A1/ouabain, (D) SULT2A1/ouabain/PAP, (E) SULT2A1/3′-phosphoadenylyl sulfate, (F) SULT2A1/3′-phosphoadenylyl sulfate/PAP, (G) SULT2A1/raloxifene, and (H) SULT2A1/raloxifene/PAP complexes.
2.8. Interaction Changes between Large Ligands and the Open/Closed Conformation
First, the subnetworks for interactions between protein and ligand were obtained to compare the binding affinity of different ligands for the absence and presence of complexes (Figure 11). The subnetworks for different representative structures revealed that the larger ligands such as 3′-phosphoadenylyl sulfate (no. 145) and raloxifene (no. 21) could form stronger interactions with the open conformations (absence of PAP) (Figure 11E,G), compared with that with the closed conformations (presence of PAP) (Figure 11F,H). Interestingly, for α-hydroxytamoxifen (no. 94) and ouabain (no. 131), the number of interactions in the absence and presence of complexes did not differ extensively (Figure 11A–D).
Figure 11.

Subnetwork analysis of interaction between protein and large ligands for the (A) SULT2A1/α-hydroxytamoxifen, (B) SULT2A1/α-hydroxytamoxifen/PAP, (C) SULT2A1/ouabain, (D) SULT2A1/ouabain/PAP, (E) SULT2A1/3′-phosphoadenylyl sulfate, (F) SULT2A1/3′-phosphoadenylyl sulfate/PAP, (G) SULT2A1/raloxifene, and (H) SULT2A1/raloxifene/PAP complexes.
Second, the changes of nonbond interaction energy [van der Waals (vdW) and electrostatic energy] between protein and ligand in MD simulation were recorded to verify the analysis mentioned above. From Figure S12C,D, we could learn that the nonbond energy in the SULT2A1/3′-phosphoadenylyl sulfate and SULT2A1/raloxifene complexes (black) was significantly lower than that in the presence of PAP structures (red). Besides, the electrostatic interaction could be the main interaction for the SULT2A1/3′-phosphoadenylyl sulfate complex, while in the SULT2A1/raloxifene complex, electrostatic and vdW interactions were both reasons of stabilizing protein and ligand interactions. Meanwhile, as shown in Figure S12A,B, the nonbond energy in the SULT2A1/α-hydroxytamoxifen and SULT2A1/ouabain (black) was simply slightly less than the energy in the complexes containing PAP (red). Thus, for α-hydroxytamoxifen (no. 94) and ouabain (no. 131), the binding affinity in their complexes with SULT2A1 (the open mode) was not much less, compared with that in the SULT2A1/PAP complexes (the closed mode).
Finally, the hydrogen bond and alkyl−π interactions were calculated for the MD simulations of raloxifene (no. 21) and 3′-phosphoadenylyl sulfate (no. 145) bound to SULT2A1 and SULT2A1/PAP structures. As shown in Figure 12A–C, residues Lys44, Asn48, Glu79, and His99 were capable of forming stable hydrogen bonding interactions with 3′-phosphoadenylyl sulfate in the absence of PAP for most of the simulation time (shown as pink). Similarly, seen from Figure 12D,E, residues Lys44 and Asn48 could form hydrogen bonding interactions with raloxifene. Besides, residues Phe133 and Trp134 could form alkyl−π interactions with raloxifene in the complexes without PAP, indicating that the distance of two atoms could be stable at around 4–8 Å. All these results could verify the conclusion of ensemble docking, that the large molecules (3′-phosphoadenylyl sulfate, raloxifene) may be more likely to bind to the open conformation first, while the molecules such as hydroxytamoxifen and ouabain had no prominent advantage in binding to the open conformation, compared with the closed mode (in the presence of PAP).
Figure 12.

(A) Structural visualization of interactions between SULT2A1 and 3′-phosphoadenylyl sulfate. (B,C) Distance changes of interactions between 3′-phosphoadenylyl sulfate and Lys44/Asn48/Glu79/His99 in the SULT2A1/3′-phosphoadenylyl sulfate (pink) and SULT2A1/3′-phosphoadenylyl sulfate/PAP (blue). (D) Structural visualization of interactions between SULT2A1 and raloxifene. (E,F) Distance changes of interactions between raloxifene and Lys44/Asn48/Phe133/Trp134 in the SULT2A1/raloxifene (pink) and SULT2A1/raloxifene/PAP (blue).
3. Conclusions
The effect of ligands on structural stability and selectivity of sulfotransferases is significant for understanding the sulfonation process of small molecules catalyzed by sulfotransferases. In the present work, we applied the MD simulations with protein structure network analysis and the ensemble docking study for SULT2A1, SULT2A1/LCA, SULT2A1/PAP, and SULT2A1/LCA/PAP systems first. The analysis of structural stability during the MD simulations indicated that the co-factor (PAP) and substrate (LCA) presented mutual stabilizing effect on the structural stability of enzymes. Further, the network centrality and protein structure network analyses confirmed that the cooperation of PAP and LCA was able to enhance the structural stability and compact connectivity in the protein structure network. Besides, we detected that PAP binding played a crucial role in increasing the binding affinity of the substrate LCA. Specifically, the substrate LCA was prone to stably binding to the active binding pocket in the presence of PAP, and the interaction between protein and the substrate LCA was strengthened since the PAP binding. To gain some insights into the mechanism of the enhanced stability and interaction in terms of conformational changes, the structural motion after binding of ligands was described using cross-correlation and principal component analysis (PCA). Obviously, the most stable conformational mobility was detected in the SULT2A1/LCA/PAP complexes. Meanwhile, since the PAP binding, the active-site cap (covering both the co-factor and the substrate binding site) had inward displacement to close the active binding pocket, which could be responsible for drastic changes in the substrate accessibility and the catalytic activity. Such dynamic displacement detected in the simulation is in line with the model proposed by Cook et al., which allows the enzyme to isomerize between open and closed states when PAPS is bound.17 To research the selectivity of sulfotransferases based on the position and affinity, the ensemble docking study for 177 substrates and inhibitors was performed to comprehend the significant alteration. Based on the docking study, we could find that PAP binding to the conformation resulted in a narrower active pocket in comparison with the absence of PAP. Such a small spatial active binding pocket may prevent the large substrate such as raloxifene and 3′-phosphoadenylyl sulfate from binding to the pocket. On the contrary, the small pocket consisting of α2, loop3, loop5, α7/α8, and loop16 may play a more important role in the binding of small ligands such as LCA to a closed conformation (PAP-containing). In addition, the dynamic behavior of conformation and changes of protein–ligand interactions in MD simulations of large molecules bound to the proteins with/without PAP can improve our understanding of changes in the SULT structure during the reaction cycle. The analysis of structural stability and movement after binding of large ligands also showed that the cooperation of PAP and inhibitors could enforce that structures are more compact, and loop16 presented a closed motion after PAP binding, which could be responsible for the selectivity of SULT2A1. The interaction changes between large ligands and the open/closed conformation also demonstrated that the larger the molecule is, the easier it is to bind to the open SULT2A1.
4. Materials and Methods
4.1. Protein Preparation and MD Simulation
The X-ray structure of the SULT2A1 complex with PAP and lithocholic acid (LCA) was obtained from the RCSB Protein Data Bank (www.rcsb.org) (PDB ID: 3F3Y). The free SULT2A1 and binary complexes (SULT2A1/LCA and SULT2A1/PAP) were derived from the crystal structure of the SULT2A1 complex with both PAP and LCA (PDB ID: 3F3Y). PAP rather than PAPS was chosen to study the influence of PAP(S) on the structural flexibility of SULTs based on the nearly identical binding site for PAP or PAPS and the belief that they have the same effects.18,25 Therefore, in the present study, 500 ns MD simulations were performed for four systems: (1) SULT2A1, (2) SULT2A1/LCA, (3) SULT2A1/PAP, and (4) SULT2A1/LCA/PAP. All four initial structures were constructed with crystallization water molecules. After molecules were removed, four models were solvated in a cubic periodic box with TIP3P water and 125 000 water molecules. The distance between the periodic boundary conditions and the closest protein atom was set to 12 Å. The charge of four systems was neutralized with counterions (Na+, Cl–) concentrated at 0.15 mol/L. The protonation states of co-factor PAP and substrate LCA were assigned to mimic the experimental pH conditions. The H++ server was utilized to determine the protonation states of charged amino acids.26 The long-range electrostatic interactions were calculated using the particle mesh Ewald algorithm.27 Noncovalent vdW interactions were cut off at 13.5 Å. Bond length involving hydrogen atoms was constrained using the SHAKE algorithm28 with the integration time step of 2 fs. Prior to MD simulations, in order to prevent improper geometry and steric clashes, energy of four systems was minimized with the steepest-descent algorithm. The 500 ns MD simulations for four systems were performed using NAMD 2.7 package29 with CHARMM27 force fields30 and the TIP3P water model.31 Topology and parameters of PAP and LCA were acquired from CHARMM CGenFF files. All production was performed under constant temperature (310 K) and 1 atm constant pressure with a time step of 2 fs.31 The snapshots of the 500 ns were taken with an interval of 100 ps to analyze the impact of the cofactor and the substrate on the structure and dynamics of the enzyme.
4.2. Network Centrality Analysis
Network centrality analysis is able to compute weighted centrality with corresponding selected nodes, incorporating the analysis of the weighted degree, shortest path closeness, and betweenness.32,33 The edge weights in residue interaction networks (RINs) are assumed to be the strength of the residue interaction. Therefore, the scores of weights must be converted to distance scores, that is, smaller distance scores are deemed as stronger interactions between the connected nodes. Shortest path centralities indicate that the distance between two nodes is the length of the shortest path between them. Specially speaking, the shortest path betweenness computes the frequency that pairs of nodes (not directly connected) pass through the node of interest (the bridge node) over the shortest paths. A bridge node that frequently occurs in the shortest paths is more capable of facilitating connections between pairs of nodes. The formula is as follows
| 1 |
where Pjk, determined by the Floyd–Warshall algorithm,34 is the number of shortest paths between nodes j and k and Pjk(i) is the number of shortest paths through node i between nodes j and k.35
The network centrality computations were performed using the Cytoscape plugin RINalyzer.36,37 The analysis settings are shown as follows. The attribution as edge weight was assigned to NrInteractions, and the multiple edges were handled via using the average weight option. Besides, the weighted degree was cut off at 1 Å, and the max-value option was used for converting scores into distances.
4.3. Protein Structure Network Analysis of Protein–Ligand Complexes
Recent advances have demonstrated that protein structure networks provide valuable insights into the global structural properties, functions, and stability of protein.38,39 Protein structure can be represented as networks by defining the amino acids as nodes and the noncovalent interactions as edges identified by the probe.36,40 In our study, RINs for 3D structures of SULT2A1/PAP, SULT2A1/LCA, and SULT2A1/LCA/PAP were generated from RINerator software.36 Nonbonded side-chain interactions were calculated in line with the normalization values of contact between residues.40 The analysis of RINs was performed using the RINalyzer and visualized in Cytoscape.37 The corresponding structures were displayed in PyMOL package. The network parameters were utilized to analyze the RINs covering clusters, hubs, cliques, and communities.41 The hubs represent highly connected nodes in the network whose degrees are at least 4. A k = n clique is a group of “n” nodes with each node connected to every other node in networks. A community of k = n cliques is a collection of cliques that share n – 1 nodes among them. All these network parameters were computed by using CFinder 2.0.6 software.42 Input parameters for CFinder originate from RINerator. The protein structures used in the protein network analysis were the representative structures from the snapshots of the 500 ns MD in the free SULT2A1, SULT2A1/LCA, SULT2A1/PAP, and SULT2A1/LCA/PAP complexes.
4.4. Cross-Correlation Analysis
Cross-correlation analysis was performed using Bio3D version 2.3.043,44 to assess the extent to which the atomic fluctuations/displacement of a system are/is correlated with one another by examining the magnitude of all pairwise cross-correlation coefficients.45 The Bio3D dccm() function returns a matrix of all atom-wise cross-correlations whose elements may be displayed in graphical representation frequently termed a dynamical cross-correlation map or DCCM. In this map, the coordinate axis scale corresponds to the atomic number. The red region indicates that the more positive the matrix element value, the more positive the correlation is between the two atomic motion modes; the white region in agreement with the matrix element value is 0. More blue regions signify that the matrix element value is more negative, indicating that the corresponding two atomic motion modes tend to be negatively correlated. The diagonal of the matrix is the variance, which must be greater than zero, and so it is white or reddish.
4.5. PCA and FEL Analysis
PCA was performed using Bio3D version 2.3.043,44 for examining the relationship between different conformations, and the most significant conformational changes in 500 ns MD of the SULT2A1, SULT2A1/LCA, SULT2A1/PAP, and SULT2A1/LCA/PAP structures during the trajectory were taken as samples. All representative structures based on disparate conformational motions were extracted by package ncdf4 implemented in the Bio3D functions46,47 and visualized by VMD 1.9.3.48 The energy of macromolecule conformations such as the first two principal components (PC1, PC2) were characterized in the FEL.49 By using the program converting dot distribution to probability distribution (ddtpd), the trajectories to PC1 and PC2 of motion were mapped.50−52
4.6. Cluster Analysis
Clustering of the structures of a trajectory can be accomplished using disparate methods (algorithms) and different criteria to judge structure similarity.53 Here, according to the quality threshold-like (qt) method, rmsd-based clustering was performed to classify the similar structures in two trajectories of SULT2A1 and SULT2A1/PAP into the distinct group. The rmsd cutoff was set to 1.5 Å for each trajectory. After clustering, the proportion of each cluster was counted, and the similar conformation in trajectories of SULT2A1 and SULT2A1/PAP was split into the same cluster. The representative structures extracted based on the cluster analysis were used for further ensemble docking.
4.7. Ensemble Docking Study
AutoDock is a suite of automated docking tools, consisting of two generations of software: AutoDock 4 and AutoDock Vina. It is designed to predict the substrates or drug candidates bound to a receptor of known 3D structures. AutoDock 4.2 is the latest faster version, combining rapid energy evaluation to find suitable binding positions for a candidate on a known 3D structure.54 AutoDock Vina is an open-source program for doing molecular docking and virtual screening.55 For the preparation of the receptor (macromolecules), AD4-type atoms and Kollman charges were assigned into the receptor, and polar hydrogen atoms were merged into the associated heavy atoms. Besides, the grid box containing active-site residues was added using the AutoDock tool program.54 For the preparation of ligands, the substrates and inhibitors of SULT2A1 were obtained from the BRENDA database.56 The MOL files of small molecules were converted into the PDBQT form using the AutoDock tool program. After the ensemble docking, eight bits (any, backbone, side chain, polar, hydrophobic, H-donor, H-acceptor, aromatic) were used to describe IFP. For each ligand’s atom, the residues within the cutoff range were selected. The occurrence of interaction was determined by atom–atom distance, type of atoms/residues, and appropriate angle when bound with hydrogen. On this basis, an average SIFt may be generated for the population of ligands and/or receptors.
Acknowledgments
This work was supported by the Natural Science Foundation of Jilin Province as a major scientific research project [20170101068JC] and the Graduate Innovation Fund of Jilin University [101832018C180]. This work was conducted at the High-Performance Computing Center of Jilin University.
Supporting Information Available
The Supporting Information is available free of charge at https://pubs.acs.org/doi/10.1021/acsomega.9b03136.
Sequence alignment and secondary structure of SULT2A1; frequency distributions of the betweenness values; FEL; cluster analysis data; substrates and inhibitors for SULT2A1; lowest binding affinity of SULT2A1 ligands for protein; superposition of representative enzyme conformations; rmsd plot; radius of gyration (Rg) plot; dynamical cross-correlation map; and nonbond energy (vdW and electrostatic energy) changes plot (PDF)
The authors declare no competing financial interest.
Supplementary Material
References
- Xu C.; Li Y.-T.; Kong A. N. T. Induction of phase I, II and III drug metabolism/transport by xenobiotics. Arch. Pharmacal Res. 2005, 28, 249–268. 10.1007/bf02977789. [DOI] [PubMed] [Google Scholar]
- Negishi M.; Pedersen L. G.; Petrotchenko E.; Shevtsov S.; Gorokhov A.; Kakuta Y.; Pedersen L. C. Structure and function of sulfotransferases. Arch. Biochem. Biophys. 2001, 390, 149–157. 10.1006/abbi.2001.2368. [DOI] [PubMed] [Google Scholar]
- Chapman E.; Best M. D.; Hanson S. R.; Chi-Huey W. Sulfotransferases: structure, mechanism, biological activity, inhibition, and synthetic utility. Angew. Chem., Int. Ed. Engl. 2004, 43, 3526–3548. 10.1002/anie.200300631. [DOI] [PubMed] [Google Scholar]
- Falany C. N. Enzymology of human cytosolic sulfotransferases. FASEB J. 1997, 11, 206. 10.1096/fasebj.11.4.9068609. [DOI] [PubMed] [Google Scholar]
- Li D. The role of drug metabolizing enzymes in clearance. Expert Opin. Drug Metab. Toxicol. 2014, 10, 379–393. 10.1517/17425255.2014.876006. [DOI] [PubMed] [Google Scholar]
- Gamage N. U.; Duggleby RGBarnett A. C.; Tresillian M.; Latham C. F.; Liyou N. E.; Mcmanus M. E.; Martin J. L. Structure of a human carcinogen-converting enzyme, SULT1A1. J. Biol. Chem. 2003, 278, 7655–7662. 10.1074/jbc.m207246200. [DOI] [PubMed] [Google Scholar]
- Bojarová P.; Williams S. J. Sulfotransferases, sulfatases and formylglycine-generating enzymes: a sulfation fascination. Curr. Opin. Chem. Biol. 2008, 12, 573–581. 10.1016/j.cbpa.2008.06.018. [DOI] [PubMed] [Google Scholar]
- Bamforth K. J.; Dalgliesh K.; Coughtrie M. W. H. Inhibition of human liver steroid sulfotransferase activities by drugs: a novel mechanism of drug toxicity?. Eur. J. Pharmacol. 1992, 228, 15–21. 10.1016/0926-6917(92)90006-x. [DOI] [PubMed] [Google Scholar]
- Vietri M.; Santi C. D.; Pietrabissa A.; Mosca F.; Pacifici G. M. Inhibition of human liver phenol sulfotransferase by nonsteroidal anti-inflammatory drugs. Eur. J. Clin. Pharmacol. 2000, 56, 81–87. 10.1007/s002280050725. [DOI] [PubMed] [Google Scholar]
- Kester M. H. A.; Sema B.; Hans V. T.; Dick T.; Walter M.; Hansruedi G.; Falany C. N.; Coughtrie M. W. H.; A Gerlienke S.; Abraham B. Potent inhibition of estrogen sulfotransferase by hydroxylated metabolites of polyhalogenated aromatic hydrocarbons reveals alternative mechanism for estrogenic activity of endocrine disrupters. J. Clin. Endocrinol. Metab. 2002, 87, 1142–1150. 10.1210/jc.87.3.1142. [DOI] [PubMed] [Google Scholar]
- Ohkimoto K.; Sakakibara Y.; Suiko M.; Yoshikawa H.; Liu M.-C.; Tamura H. Biocides, tributyltin and triphenyltin, as possible inhibitors of the human sulfotransferase involved in the estrogen homeostasis. Pestic. Biochem. Physiol. 2005, 81, 32–38. 10.1016/j.pestbp.2004.08.003. [DOI] [Google Scholar]
- Allali-Hassani A.; Pan P. W.; Dombrovski L.; Najmanovich R.; Tempel W.; Dong A.; Loppnau P.; Martin F.; Thornton J.; Thonton J.; Bochkarev A.; Plotnikov A. N.; Vedadi M.; Arrowsmith C. H. Structural and chemical profiling of the human cytosolic sulfotransferases. PLoS Biol. 2007, 5, e97 10.1371/journal.pbio.0050097. [DOI] [PMC free article] [PubMed] [Google Scholar]
- Dong D.; Ako R.; Wu B. Crystal structures of human sulfotransferases: insights into the mechanisms of action and substrate selectivity. Expert Opin. Drug Metab. Toxicol. 2012, 8, 635. 10.1517/17425255.2012.677027. [DOI] [PubMed] [Google Scholar]
- Pedersen L. C.; Petrotchenko E. V.; Negishi M. Crystal structure of SULT2A3, human hydroxysteroid sulfotransferase. FEBS Lett. 2000, 475, 61–64. 10.1016/s0014-5793(00)01479-4. [DOI] [PubMed] [Google Scholar]
- Rehse P. H.; Zhou M.; Lin S.-X. Crystal structure of human dehydroepiandrosterone sulphotransferase in complex with substrate. Biochem. J. 2002, 364, 165. 10.1042/bj3640165. [DOI] [PMC free article] [PubMed] [Google Scholar]
- Tibbs Z. E.; Rohn-Glowacki K. J.; Crittenden F.; Guidry A. L.; Falany C. N. Structural plasticity in the human cytosolic sulfotransferase dimer and its role in substrate selectivity and catalysis. Drug Metab. Pharmacokinet. 2015, 30, 3–20. 10.1016/j.dmpk.2014.10.004. [DOI] [PubMed] [Google Scholar]
- Cook I.; Ting W.; Almo S. C.; Jungwook K.; Falany C. N.; Leyh T. S. The gate that governs sulfotransferase selectivity. Biochemistry 2013, 52, 415–424. 10.1021/bi301492j. [DOI] [PMC free article] [PubMed] [Google Scholar]
- Cook I.; Ting W.; Falany C. N.; Leyh T. S. A nucleotide-gated molecular pore selects sulfotransferase substrates. Biochemistry 2012, 51, 5674–5683. 10.1021/bi300631g. [DOI] [PMC free article] [PubMed] [Google Scholar]
- Leyh T. S.; Cook I.; Wang T. Structure, dynamics and selectivity in the sulfotransferase family. Drug Metab. Rev. 2013, 45, 423–430. 10.3109/03602532.2013.835625. [DOI] [PMC free article] [PubMed] [Google Scholar]
- Stjernschantz E.; Reinen J.; Meinl W.; George B. J.; Glatt H.; Vermeulen N. P. E. Comparison of murine and human estrogen sulfotransferase inhibition in vitro and in silico-Implications for differences in activity, subunit dimerization and substrate inhibition. Mol. Cell. Endocrinol. 2010, 317, 127–140. 10.1016/j.mce.2009.12.001. [DOI] [PubMed] [Google Scholar]
- Rakers C.; Schumacher F.; Meinl W.; Glatt H.; Kleuser B.; Wolber G. In SilicoPrediction of Human Sulfotransferase 1E1 Activity Guided by Pharmacophores from Molecular Dynamics Simulations. J. Biol. Chem. 2016, 291, 58–71. 10.1074/jbc.m115.685610. [DOI] [PMC free article] [PubMed] [Google Scholar]
- Cook I. T.; Leyh T. S.; Kadlubar S. A.; Falany C. N. Structural rearrangement of SULT2A1: effects on dehydroepiandrosterone and raloxifene sulfation. Horm. Mol. Biol. Clin. Invest. 2010, 1, 81–87. 10.1515/hmbci.2010.012. [DOI] [PMC free article] [PubMed] [Google Scholar]
- Martiny V. Y.; Carbonell P.; Lagorce D.; Villoutreix B. O.; Moroy G.; Miteva M. A. In silico mechanistic profiling to probe small molecule binding to sulfotransferases. PLoS One 2013, 8, e73587 10.1371/journal.pone.0073587. [DOI] [PMC free article] [PubMed] [Google Scholar]
- Tian W.; Chen C.; Lei X.; Zhao J.; Liang J. CASTp 3.0: computed atlas of surface topography of proteins. Nucleic Acids Res. 2018, 46, W363–W367. 10.1093/nar/gky473. [DOI] [PMC free article] [PubMed] [Google Scholar]
- Allali-Hassani A.; Pan W.; Dombrovski L.; Najmanovich R.; Tempel W.; Dong A.; Loppnau P.; Martin F.; Thornton J.; Edwards A.; Bochkarev A.; Plotnikov A.; Vedadi M.; Arrowsmith C. Correction: Structural and Chemical Profiling of the Human Cytosolic Sulfotransferases. PLoS Biol. 2007, 5, e165 10.1371/journal.pbio.0050165. [DOI] [PMC free article] [PubMed] [Google Scholar]
- Anandakrishnan R.; Boris A.; Onufriev A. V. H++ 3.0: automating pK prediction and the preparation of biomolecular structures for atomistic molecular modeling and simulations. Nucleic Acids Res. 2012, 40, W537–W541. 10.1093/nar/gks375. [DOI] [PMC free article] [PubMed] [Google Scholar]
- Batcho P. F.; Case D. A.; Schlick T. Optimized particle-mesh Ewald/multiple-time for molecular dynamics simulations. J. Chem. Phys. 2001, 115, 4003–4018. 10.1063/1.1389854. [DOI] [Google Scholar]
- Ryckaert J.-P.; Ciccotti G.; Berendsen H. J. C. Numerical integration of the cartesian equations of motion of a system with constraints: molecular dynamics of n-alkanes. J. Comput. Phys. 1977, 23, 327–341. 10.1016/0021-9991(77)90098-5. [DOI] [Google Scholar]
- Phillips J. C.; Rosemary B.; Wei W.; James G.; Emad T.; Elizabeth V.; Christophe C.; Skeel R. D.; Laxmikant K.; Klaus S. Scalable molecular dynamics with NAMD. J. Comput. Chem. 2005, 26, 1781–1802. 10.1002/jcc.20289. [DOI] [PMC free article] [PubMed] [Google Scholar]
- MacKerell A. D.; Bashford D.; Bellott M.; Dunbrack R. L.; Evanseck J. D.; Field M. J.; Fischer S.; Gao J.; Guo H.; Ha S.; Joseph-McCarthy D.; Kuchnir L.; Kuczera K.; Lau F. T. K.; Mattos C.; Michnick S.; Ngo T.; Nguyen D. T.; Prodhom B.; Reiher W. E.; Roux B.; Schlenkrich M.; Smith J. C.; Stote R.; Straub J.; Watanabe M.; Wiórkiewicz-Kuczera J.; Yin D.; Karplus M. All-atom empirical potential for molecular modeling and dynamics studies of proteins. J. Phys. Chem. B 1998, 102, 3586–3616. 10.1021/jp973084f. [DOI] [PubMed] [Google Scholar]
- Jorgensen W. L.; Jenson C. Temperature dependence of TIP3P, SPC, and TIP4P water from NPT Monte Carlo simulations: Seeking temperatures of maximum density. J. Comput. Chem. 1998, 19, 1179–1186. . [DOI] [Google Scholar]
- Yan E.; Ding Y. Applying centrality measures to impact analysis: A coauthorship network analysis. J. Assoc. Inf. Sci. Technol. 2014, 60, 2107–2118. 10.1002/asi.21128. [DOI] [Google Scholar]
- del Sol A.; Fujihashi H.; Amoros D.; Nussinov R. Residue centrality, functionally important residues, and active site shape: analysis of enzyme and non-enzyme families. Protein Sci. 2010, 15, 2120–2128. 10.1110/ps.062249106. [DOI] [PMC free article] [PubMed] [Google Scholar]
- Pallottino S. Shortest-path methods: Complexity, interrelations and new propositions. Networks 2010, 14, 257–267. 10.1002/net.3230140206. [DOI] [Google Scholar]
- Daly E. M.; Haahr M. Social Network Analysis for Information Flow in Disconnected Delay-Tolerant MANETs. IEEE T. Mobile Comput. 2009, 8, 606–621. 10.1109/tmc.2008.161. [DOI] [Google Scholar]
- Doncheva N. T.; Klein K.; Domingues F. S.; Albrecht M. Analyzing and visualizing residue networks of protein structures. Trends Biochem. Sci. 2011, 36, 179–182. 10.1016/j.tibs.2011.01.002. [DOI] [PubMed] [Google Scholar]
- Shannon P.; Markiel A.; Ozier O.; Baliga N. S.; Wang J. T.; Ramage D.; Amin N.; Schwikowski B.; Ideker T. Cytoscape: a software environment for integrated models of biomolecular interaction networks. Genome Res. 2003, 13, 2498–2504. 10.1101/gr.1239303. [DOI] [PMC free article] [PubMed] [Google Scholar]
- Brinda K. V.; Vishveshwara S. A network representation of protein structures: implications for protein stability. Biophys. J. 2005, 89, 4159–4170. 10.1529/biophysj.105.064485. [DOI] [PMC free article] [PubMed] [Google Scholar]
- Atilgan A. R.; Pelin A.; Canan B. Small-World Communication of Residues and Significance for Protein Dynamics. Biophys. J. 2004, 86, 85–91. 10.1016/s0006-3495(04)74086-2. [DOI] [PMC free article] [PubMed] [Google Scholar]
- Kannan N.; Vishveshwara S. Identification of side-chain clusters in protein structures by a graph spectral method. J. Mol. Biol. 1999, 292, 441–464. 10.1006/jmbi.1999.3058. [DOI] [PubMed] [Google Scholar]
- Li J.; Wang X.; Cui Y. Uncovering the overlapping community structure of complex networks by maximal cliques. Phys. A 2014, 415, 398–406. 10.1016/j.physa.2014.08.025. [DOI] [Google Scholar]
- Kang Y.-B.; Delir Haghighi P.; Burstein F. CFinder: An intelligent key concept finder from text for ontology development. Expert Syst. Appl. 2014, 41, 4494–4504. 10.1016/j.eswa.2014.01.006. [DOI] [Google Scholar]
- Grant B. J.; Rodrigues A. P. C.; Elsawy K. M.; Mccammon J. A.; Caves L. S. D. Bio3d: an R package for the comparative analysis of protein structures. Bioinformatics 2006, 22, 2695–2696. 10.1093/bioinformatics/btl461. [DOI] [PubMed] [Google Scholar]
- Skjærven L.; Yao X. Q.; Scarabelli G.; Grant B. J. Integrating protein structural dynamics and evolutionary analysis with Bio3D. BMC Bioinf. 2014, 15, 399. 10.1186/s12859-014-0399-6. [DOI] [PMC free article] [PubMed] [Google Scholar]
- Hünenberger P. H.; Mark A. E.; Van Gunsteren W. F. Fluctuation and cross-correlation analysis of protein motions observed in nanosecond molecular dynamics simulations. J. Mol. Biol. 1995, 252, 492–503. 10.1006/jmbi.1995.0514. [DOI] [PubMed] [Google Scholar]
- Fischer S.; Karplus M. Conjugate peak refinement: an algorithm for finding reaction paths and accurate transition states in systems with many degrees of freedom. Chem. Phys. Lett. 1992, 194, 252–261. 10.1016/0009-2614(92)85543-j. [DOI] [Google Scholar]
- Hayward S.; Berendsen H. Systematic analysis of domain motions in proteins from conformational change: new results on citrate synthase and T4 lysozyme. Proteins: Struct., Funct., Genet. 2015, 30, 144–154. . [DOI] [PubMed] [Google Scholar]
- Hsin J.; Arkhipov A.; Yin Y.; Stone J. E.; Schulten K. Using VMD: an introductory tutorial. Curr. Protoc. Bioinf. 2008, 24, 5.7.1–5.7.48. 10.1002/0471250953.bi0507s24. [DOI] [PMC free article] [PubMed] [Google Scholar]
- Odagaki T.; Yoshidome T.; Koyama A.; Yoshimori A. Free energy landscape approach to glass transition. J. Non-Cryst. Solids 2006, 352, 4843–4846. 10.1016/j.jnoncrysol.2006.02.146. [DOI] [Google Scholar]
- Nicolaï A.; Delarue P.; Senet P. Decipher the Mechanisms of Protein Conformational Changes Induced by Nucleotide Binding through Free-Energy Landscape Analysis: ATP Binding to Hsp70. PLoS Comput. Biol. 2013, 9, e1003379 10.1371/journal.pcbi.1003379. [DOI] [PMC free article] [PubMed] [Google Scholar]
- Iida S.; Mashimo T.; Kurosawa T.; Hojo H.; Muta H.; Goto Y.; Fukunishi Y.; Nakamura H.; Higo J. Variation of free-energy landscape of the p53 C-terminal domain induced by acetylation: Enhanced conformational sampling. J. Comput. Chem. 2016, 37, 2687–2700. 10.1002/jcc.24494. [DOI] [PMC free article] [PubMed] [Google Scholar]
- Tripathi S.; Srivastava G.; Sharma A. Molecular dynamics simulation and free energy landscape methods in probing L215H, L217R and L225M βI-tubulin mutations causing paclitaxel resistance in cancer cells. Biochem. Biophys. Res. Commun. 2016, 476, 273–279. 10.1016/j.bbrc.2016.05.112. [DOI] [PubMed] [Google Scholar]
- Jain A. K.; Murty M. N.; Flynn P. J. Data clustering: a review. ACM Comput. Surv. 1999, 31, 264–323. 10.1145/331499.331504. [DOI] [Google Scholar]
- Morris G. M.; Ruth H.; William L.; Sanner M. F.; Belew R. K.; Goodsell D. S.; Olson A. J. AutoDock4 and AutoDockTools4: Automated docking with selective receptor flexibility. J. Comput. Chem. 2010, 30, 2785–2791. 10.1002/jcc.21256. [DOI] [PMC free article] [PubMed] [Google Scholar]
- Trott O.; Olson A. J. AutoDock Vina: improving the speed and accuracy of docking with a new scoring function, efficient optimization, and multithreading. J. Comput. Chem. 2010, 31, 455–461. 10.1002/jcc.21334. [DOI] [PMC free article] [PubMed] [Google Scholar]
- Placzek S.; Schomburg I.; Chang A.; Jeske L.; Ulbrich M.; Tillack J.; Schomburg D. BRENDA in 2017: new perspectives and new tools in BRENDA. Nucleic Acids Res. 2017, 45, D380–D388. 10.1093/nar/gkw952. [DOI] [PMC free article] [PubMed] [Google Scholar]
Associated Data
This section collects any data citations, data availability statements, or supplementary materials included in this article.