

Abstract
Aims
Central adiposity is associated with increased cardiovascular disease (CVD) risk, even among people with normal body mass index (BMI). We tested the hypothesis that regional body fat deposits (trunk or leg fat) are associated with altered risk of CVD among postmenopausal women with normal BMI.
Methods and results
We included 2683 postmenopausal women with normal BMI (18.5 to <25 kg/m2) who participated in the Women’s Health Initiative and had no known CVD at baseline. Body composition was determined by dual energy X-ray absorptiometry. Incident CVD events including coronary heart disease and stroke were ascertained through February 2017. During a median 17.9 years of follow-up, 291 incident CVD cases occurred. After adjustment for demographic, lifestyle, and clinical risk factors, neither whole-body fat mass nor fat percentage was associated with CVD risk. Higher percent trunk fat was associated with increased risk of CVD [highest vs. lowest quartile hazard ratio (HR) = 1.91, 95% confidence interval (CI) 1.33–2.74; P-trend <0.001], whereas higher percent leg fat was associated with decreased risk of CVD (highest vs. lowest quartile HR = 0.62, 95% CI 0.43–0.89; P-trend = 0.008). The association for trunk fat was attenuated yet remained significant after further adjustment for waist circumference or waist-to-hip ratio. Higher percent trunk fat combined with lower percent leg fat was associated with particularly high risk of CVD (HR comparing extreme groups = 3.33, 95% CI 1.46–7.62).
Conclusion
Among postmenopausal women with normal BMI, both elevated trunk fat and reduced leg fat are associated with increased risk of CVD.

Keywords: Body fat, Normal-weight obesity, Metabolically unhealthy normal weight, Postmenopausal, Cardiovascular disease
Introduction
Despite being widely used in clinical practice and epidemiological research, body mass index (BMI) as a proxy for adiposity is often criticized for its limited capacity to distinguish between fat mass and fat-free mass (i.e. lean mass, bone mass, and fluid mass).1 Individuals within the same BMI category could have substantial differences in the amount and distribution of body fat and therefore variable health risks. It is known, for example, that larger waist circumference is associated with increased risk of cardiovascular disease (CVD) mortality among people with normal BMI.2,3
The biological functions of adipose tissue are location dependent, with upper-body and lower-body fat exhibiting opposing effects (i.e. detrimental vs. beneficial) on various metabolic processes including glucose regulation and lipid storage.4–6 There is mounting evidence that trunk fat mass is a strong predictor of unfavourable metabolic features (e.g. insulin resistance) that increase CVD risk, whereas increased leg fat may be associated with decreased risk of metabolic disturbances.7–10 These evidence bases underscore the potential importance of fat distribution in the development of cardiometabolic disease.
Postmenopausal women are prone to metabolic alterations resulting, in part, from a shift from subcutaneous to intra-abdominal visceral fat.11 Such metabolic abnormalities have been associated with increased CVD risk among normal BMI populations.12 However, studies that assess regional fat accumulation (e.g. upper body vs. lower body) and its relationship with CVD risk among normal BMI postmenopausal women are still lacking. In the current study, using body composition data as defined by dual energy X-ray absorptiometry (DXA) in a subset of the Women’s Health Initiative (WHI),13 we examined the associations of whole-body fat, upper-body (trunk) fat, and lower-body (leg) fat with risk of CVD among postmenopausal women with normal BMI.
Methods
Study design and population
Details of the WHI design and study population have been presented elsewhere.13 Between 1993 and 1998, 161 808 postmenopausal women aged 50–79 years were recruited from the general population at 40 clinical centres throughout the USA. The participants were either enrolled in the WHI Observational Study (OS) or in one or more of the WHI Clinical Trials (CT) testing the health effects of hormone replacement therapy, low-fat dietary modification, and/or calcium and vitamin D supplementation. At the end of the initial WHI study in 2005, the first (2005–2010) and the second (2010–2020) WHI Extension Studies continued follow-up of all women who consented. The study was approved by the institutional review boards of all participating institutions, and all participants provided written informed consent.
At enrolment, a subset of 11 393 participants underwent whole-body DXA scans at three designated WHI clinical centres (Birmingham, Tucson/Phoenix, and Pittsburgh), among whom there were 3464 participants with normal BMI (18.5 to <25 kg/m2).14 For the current analysis, we excluded 781women who reported one or more cardiovascular conditions at the study entry, had implausibly high or low energy intake, or missed follow-up data, leaving 2683 eligible participants (Supplementary material online, Figure S1).
Body composition assessment
Using the same standard protocol across all study sites, body composition including whole-body and regional fat mass, bone mass, and lean mass were determined by DXA performed in fan-beam mode and obtained from Hologic QDR scanners (QDR 2000, 2000+, or 4500; Hologic Inc., Waltham, MA, USA). Among the 2683 eligible participants with body composition data at baseline, 908 (33.8%), 2260 (84.2%), 2019 (75.3%), and 1080 (40.3%) also had DXA scans at the year 1, 3, 6, and 9 follow-up visits, respectively. Standard WHI protocols were used for the positioning and analysis of DXA scans by radiology technicians who were trained and certified by Hologic and the DXA Coordinating Center at the University of California, San Francisco. Quality control of the DXA scans in WHI are described in detail in the Supplementary material online, Methods.
Both absolute (in kilogram) and relative body fat measures were evaluated in the present analysis. Relative fat measures were percentage of whole-body or regional fat mass to total mass in the respective region. The trunk and leg regions excluded both head and arms and were separated by the angled lines defining the pelvic triangle (Supplementary material online, Methods). Trunk-to-leg fat ratio was the ratio of absolute trunk fat mass to leg fat mass. Fat mass indices were also calculated by dividing total or regional fat mass in kilogram by the square of standing height in metres.
Measurements of covariates and biomarkers
Information on demographic characteristics, reproductive and medical histories, exogenous hormone use, family history, and diet and lifestyle factors was collected at baseline via self-report. Blood pressure including systolic blood pressure (SBP) and diastolic blood pressure (DBP) and anthropometric variables such as height, weight, and waist and hip circumferences were measured by trained staff using standard procedures. Information on diagnosis and treatment of diabetes and hypertension by a physician were collected via questionnaire. For subsets of the study participants, a number of biomarkers were measured using fasting blood samples collected at baseline, including glycaemic traits (glucose, insulin, and HOMA-IR), adipokines (leptin and adiponectin), inflammatory markers [WBC count, high-sensitivity C-reactive protein (CRP), and interleukin-6], lipids (triglycerides and LDL and HDL cholesterol), and sex steroid hormones [estradiol and sex hormone-binding globulin (SHBG)]. More information on collection of baseline covariates and selection of participants for the biomarker measurements is reported in the Supplementary material online, Methods.
Outcome ascertainment
The primary outcome was the first occurrence of major CVD defined as coronary heart disease (CHD), stroke, or both combined. Coronary heart disease included possible or definite coronary death, non-fatal myocardial infarction or coronary revascularization, and stroke included ischaemic or haemorrhagic stroke or death due to a cerebrovascular event. Participants were followed up (through 28 February 2017) semiannually in the WHI CT and annually in the OS using in-person, mailed, or telephone questionnaires to collect information on clinical outcomes. Fatal CVD was confirmed by hospital records or autopsy reports, or listed as the cause of death on death certificates. All incident CVD events documented during the initial WHI or during the first Extension Study were adjudicated locally by trained physicians, followed by centralized adjudication using standard criteria.15 Although CVD events were only partially adjudicated for the second Extension Study, we included all CVD cases recorded throughout the three study periods given the substantial-to-excellent agreements between self-reported events and locally adjudicated diagnosis (Kappa statistics 0.64–0.90).16
Statistical analysis
Baseline characteristics of participants were described by quartile of trunk or leg fat percentage. Pearson partial correlation coefficients between baseline body fat and anthropometric measures were calculated. Cox proportional hazards models were used to estimate hazard ratios (HRs) and 95% confidence intervals (CIs) of CVD according to quartiles of the body fat measures. Based on tests using Schoenfeld’s residuals, there was no evidence of violation of the proportional hazards assumption. Person-time of follow-up was computed from date of enrolment until date of diagnosis of CVD (the date of the first event if a participant had multiple CVD events), death or withdrawal from the study, or end of follow-up, whichever came first. Two Cox models were constructed to account for potential confounders. The first model included age at baseline, race/ethnicity and, where appropriate, regional fat measures (i.e. mutual adjustment for trunk and leg fat). The second model further included age at menopause, education, family income, smoking, alcohol consumption, physical activity, dietary energy, family history of myocardial infarction or stroke, use of hormone therapy, and other medications at baseline, WHI randomization status, and height.
Potential nonlinear relationships between body fat and CVD risk were examined using restricted cubic splines with three knots at percentiles 10%, 50%, and 90% of the distribution. A P-value for nonlinearity was calculated by testing the null hypothesis that the coefficient of the second spline was equal to zero. To avoid over-adjustment, we further adjusted for diabetes or SBP, DBP, and use of antihypertensive drugs in separate exploratory models because each could be a potential mediator for the association between body fat and CVD. Additional exploratory analyses were performed to adjust for other common anthropometric measures. The discrimination of the models was assessed by using Harrell’s C statistics. We further evaluated the joint association of trunk and leg fat with risk of CVD by categorizing both body fat measures by tertiles.
We performed several sensitivity analyses by excluding participants who received diet or hormone interventions in the WHI CT, or reported current hormone uses at baseline, or had dyslipidaemia or thyroid problems; and by using chronological age as the primary time scale instead of follow-up time. To account for long-term changes in body fat over time, we conducted time-dependent covariate analyses using available DXA measures from all time points. Finally, we assessed cross-sectional relationships between trunk or leg fat percentage and the 13 biomarkers by multivariable linear regression after adjustment for the covariates as described above, taking into account multiple comparisons. All statistical tests were two-sided and analyses were performed using Stata (version 14.1; StataCorp), SAS (release 9.4; SAS Institute Inc.), and R (version 3.3.2; R Foundation).
Results
Participant characteristics
Baseline characteristics of the study participants by quartile of trunk or leg fat percentage are reported in Supplementary material online, Table S1. Both higher trunk and leg fat percentages were associated with lower physical activity, higher BMI, and use of statins and non-steroidal anti-inflammatory drugs. Participants with higher percent trunk (but not leg) fat had higher SBP and DBP and were more likely to be treated for hypertension. Participants with higher percent leg (but not trunk) fat were less likely to be current smokers or have diabetes and were more likely to use hormone therapy.
Both trunk and leg fat were substantially correlated with whole-body fat, and they were correlated positively with each other (r = 0.39 between trunk and leg fat percentages) (Figure 1). Percent trunk fat was correlated positively with waist circumference (r = 0.54), waist-to-hip ratio (WHR) (r = 0.30), and hip circumference (r = 0.39), whereas percent leg fat was correlated positively with hip circumference (r = 0.43), inversely with WHR (r = −0.29), and weakly with waist circumference (r = 0.02).
Figure 1.

Correlations between body fat, lean mass, and anthropometric measures. Results are partial Pearson correlation coefficients adjusted for age and race/ethnicity. BMI, body mass index; FM, fat mass; HC, hip circumference; LM, lean mass; WC, waist circumference; WHR, waist-to-hip ratio.
Body fat and risk of cardiovascular disease
During a median 17.9 years of follow-up (40 421 person-years), 291 incident CVD cases occurred, including 202 CHD and 105 stroke cases (16 women had both outcomes).
With adjustment for age and race/ethnicity (and mutual adjustment for regional fat measures), whole-body fat was not significantly associated with CVD risk (P-trend >0.05). However, trunk fat was positively, whereas leg fat was inversely associated with risk of CVD (Table 1). Further adjustment for demographic, lifestyle, and clinical risk factors yielded similar results. The HRs comparing the highest with the lowest quartile were 1.91 (95% CI 1.33–2.74; P-trend <0.001) for percent trunk fat and 0.62 (95% CI 0.43–0.89; P-trend = 0.008) for percent leg fat. Results were similar for absolute trunk or leg fat mass (Table 1). Higher ratio of trunk-to-leg fat mass also was associated with increased risk of CVD (HR = 1.99, 95% CI 1.39–2.85; P-trend <0.001). There was no evidence for nonlinear associations between body fat and CVD risk (P-nonlinearity ≥0.70; Supplementary material online, Figure S2).
Table 1.
Associations between body fat and risk of cardiovascular disease among postmenopausal women with normal body mass index
| Quartile for body fat |
P for trend | Each SD increment | ||||
|---|---|---|---|---|---|---|
| Q1 | Q2 | Q3 | Q4 | |||
| Whole-body fat mass | ||||||
| Range (median), kg | <18.1 (16.4) | 18.1 to <22.0 (20.6) | 22.0 to <25.0 (23.5) | ≥25.0 (27.2) | ||
| Cases/person-years | 66/10 175 | 70/10 043 | 80/10 020 | 75/10 182 | ||
| Model 1 [HR (95% CI)] | Reference | 1.15 (0.82–1.60) | 1.27 (0.92–1.76) | 1.25 (0.90–1.75) | 0.14 | 1.12 (0.99–1.26) |
| Model 2 [HR (95% CI)] | Reference | 1.18 (0.84–1.67) | 1.27 (0.91–1.79) | 1.34 (0.93–1.92) | 0.10 | 1.14 (1.01–1.30) |
| % Whole-body fat mass | ||||||
| Range (median), % | <33.4 (30.4) | 33.4 to <37.7 (35.8) | 37.7 to <41.1 (39.4) | ≥41.1 (43.5) | ||
| Cases/person-years | 59/10 165 | 76/10 410 | 72/10 142 | 84/9704 | ||
| Model 1 [HR (95% CI)] | Reference | 1.26 (0.90–1.77) | 1.20 (0.85–1.70) | 1.42 (1.01–1.98) | 0.054 | 1.12 (0.99–1.27) |
| Model 2 [HR (95% CI)] | Reference | 1.26 (0.89–1.78) | 1.24 (0.87–1.78) | 1.35 (0.95–1.92) | 0.11 | 1.14 (1.01–1.28) |
| Trunk fat mass | ||||||
| Range (median), kg | <7.2 (5.9) | 7.2 to <9.3 (8.3) | 9.3 to <11.2 (10.2) | ≥11.2 (12.7) | ||
| Cases/person-years | 50/10 474 | 69/10 341 | 83/9968 | 89/9638 | ||
| Model 1 [HR (95% CI)]a | Reference | 1.51 (1.05–2.19) | 1.87 (1.30–2.68) | 2.21 (1.54–3.18) | <0.001 | 1.34 (1.18–1.50) |
| Model 2 [HR (95% CI)]a | Reference | 1.60 (1.09–2.33) | 1.82 (1.25–2.64) | 2.17 (1.49–3.16) | <0.001 | 1.32 (1.16–1.49) |
| % Trunk fat mass | ||||||
| Range (median), % | <27.1 (23.0) | 27.1 to <32.9 (30.4) | 32.9 to <37.7 (35.3) | ≥37.7 (41.80) | ||
| Cases/person-years | 55/10 550 | 65/10 429 | 73/10 186 | 98/9255 | ||
| Model 1 [HR (95% CI)]a | Reference | 1.18 (0.82–1.70) | 1.43 (0.99–2.05) | 2.07 (1.46–2.93) | <0.001 | 1.36 (1.19–1.55) |
| Model 2 [HR (95% CI)]a | Reference | 1.21 (0.83–1.75) | 1.35 (0.93–1.96) | 1.91 (1.33–2.74) | <0.001 | 1.32 (1.16–1.51) |
| Leg fat mass | ||||||
| Range (median), kg | 2.5 to <7.6 (6.7) | 7.6 to <8.9 (8.3) | 8.9 to <10.4 (9.6) | ≥10.4 (11.5) | ||
| Cases/person-years | 82/9734 | 82/9783 | 69/10 275 | 58/10 629 | ||
| Model 1 [HR (95% CI)]a | Reference | 0.95 (0.70–1.29) | 0.73 (0.52–1.01) | 0.62 (0.44–0.88) | 0.003 | 0.78 (0.69–0.89) |
| Model 2 [HR (95% CI)]a | Reference | 1.02 (0.74–1.40) | 0.76 (0.54–1.07) | 0.68 (0.46–0.98) | 0.017 | 0.81 (0.71–0.93) |
| % Leg fat mass | ||||||
| Range (median), % | <41.1 (37.9) | 41.1 to <45.7 (43.6) | 45.7 to <49.8 (47.7) | ≥49.8 (52.6) | ||
| Cases/person-years | 81/9991 | 77/9978 | 70/10 189 | 63/10 263 | ||
| Model 1 [HR (95% CI)]a | Reference | 0.88 (0.64–1.21) | 0.78 (0.56–1.08) | 0.63 (0.45–0.89) | 0.008 | 0.83 (0.74–0.94) |
| Model 2 [HR (95% CI)]a | Reference | 0.94 (0.68–1.29) | 0.82 (0.58–1.15) | 0.62 (0.43–0.89) | 0.008 | 0.85 (0.76–0.96) |
| Trunk-to-leg fat ratio | ||||||
| Range (median) | <0.81 (0.66) | 0.81 to <1.02 (0.92) | 1.02 to <1.26 (1.12) | ≥1.26 (1.47) | ||
| Cases/person-years | 46/10 603 | 70/10 584 | 74/9902 | 101/9332 | ||
| Model 1 [HR (95% CI)] | Reference | 1.41 (0.97–2.05) | 1.53 (1.06–2.21) | 2.11 (1.48–3.00) | <0.001 | 1.37 (1.24–1.51) |
| Model 2 [HR (95% CI)] | Reference | 1.35 (0.93–1.97) | 1.46 (1.00–2.12) | 1.99 (1.39–2.85) | <0.001 | 1.31 (1.19–1.46) |
Model 1 was adjusted for age at baseline (years) and race/ethnicity (White, Black, Hispanic/African American, other).
Model 2 was adjusted for covariates in Model 1 and was additionally adjusted for age at menopause (<45, 45 to <50, 50 to <55, ≥55 years), education (at most high school, some college, college, or above), annual family income (<20 000, 20 000 to <50 000, 50 000 to <75 000, ≥75 000 USD), smoking status (never, former, current), alcohol consumption (0, <0.5, 0.5 to <1, ≥1 drink/day), physical activity (MET-h/week), dietary energy intake (Kcal/day), family history of myocardial infarction or stroke (yes, no), hormone therapy at baseline [never, former, current (<5, 5 to <10, 10 to <15, ≥15 years)], statins use (never, ever), aspirin use (never, ever), use of non-steroidal anti-inflammatory drug (never, ever), randomization status (three trial groups with each being classified as none, control, and intervention), and height (in quartile).
Both absolute trunk fat and leg fat and percent trunk fat and percent leg fat were mutually adjusted for each other (in quartile).
Associations of fat mass indices with risk of CVD were similar to the associations for fat percentages (Supplementary material online, Table S2). No significant association was found between total or regional lean mass and risk of CVD (P-trend ≥0.72; Supplementary material online, Table S3). Additional adjustment for diabetes or blood pressure and antihypertensive drugs did not materially alter the observed associations between body fat and risk of CVD (Supplementary material online, Table S4). The associations of trunk fat mass or fat percentage with CVD remained significant after further adjustment for waist circumference or WHR; for leg fat, the association became non-significant after WHR adjustment (Figure 2). The C-statistic estimate for the multivariable model including traditional CVD risk factors (0.777) was improved very slightly after the addition of percent trunk and leg fat (0.784) or other anthropometric measures such as WHR (0.784) to the model (Supplementary material online, Table S5).
Figure 2.

Association of trunk or leg fat percentage with risk of cardiovascular disease. Results were adjusted for covariates listed for Model 2 in Table 1 and additionally adjusted for other anthropometric measures. BMI, body mass index; CI, confidence interval; HC, hip circumference; HR, hazard ratio; WC, waist circumference; WHR, waist-to-hip ratio.
When regional fat measures were jointly evaluated, participants who had the highest percent trunk fat and the lowest percent leg fat were found to have a particularly higher risk of CVD (HR = 3.33, 95% CI 1.46–7.62), when comparing with those who were in the opposite extreme tertiles of the two measures (Figure 3).
Figure 3.
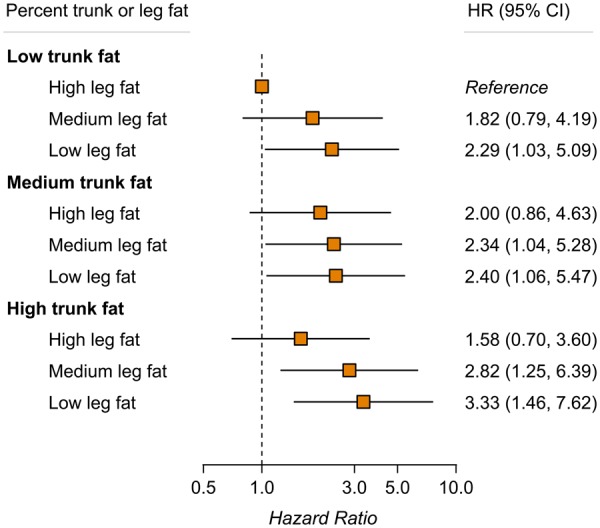
Joint association of trunk and leg fat percentages with risk of cardiovascular disease. Results were adjusted for covariates listed for Model 2 in Table 1. There was no significant interaction between trunk and leg fat percentages on cardiovascular disease risk (P-interaction = 0.57). CI, confidence interval; HR, hazard ratio.
Take home figure.
Among postmenopausal with normal body mass index, higher trunk fat is associated with increased risk of cardiovascular disease, whereas higher leg fat is associated with decreased risk of cardiovascular disease.
Secondary outcomes
Associations of body fat with CHD were similar to the associations with CVD, with multivariable-adjusted HRs of 1.84 (95% CI 1.20–2.81; P-trend = 0.003) and 0.60 (95% CI 0.39–0.93; P-trend = 0.023) comparing the extreme quartiles of trunk or leg fat percentage. For stroke, associations were in the expected directions but were not statistically significant (Supplementary material online, Table S6).
Sensitivity analyses
The observed associations between body fat and risk of CVD were similar after excluding participants who received diet or hormone intervention in the WHI CT, were current users of hormones, or reported dyslipidaemia or thyroid problems at baseline (Supplementary material online, Table S7). Results were also similar when chronological age was used as the primary time scale instead of follow-up time (Supplementary material online, Table S8). When the repeated measures of body fat were analysed in time-dependent models, the HRs comparing the extreme quartiles of trunk or leg fat percentage were 1.96 (95% CI 1.36–2.82; P-trend <0.001) and 0.63 (95% CI 0.43–0.91; P-trend = 0.011) (Supplementary material online, Table S9).
Body fat and biomarkers
Results for the multivariable-adjusted associations between trunk or leg fat percentage and biomarker levels are shown in Supplementary material online, Table S10. Higher percent trunk fat was significantly (at P < 0.002 level) associated with nine (including three glycaemic traits, three lipids, leptin, CRP, and SHBG) of the 13 biomarkers in the directions thought to promote CVD development. Conversely, higher percent leg fat was significantly associated with reduced insulin resistance and increased HDL cholesterol.
Discussion
In our analysis of US postmenopausal women with normal BMI, total body fat was not substantially associated with CVD risk. However, upper-body and lower-body fat exhibited contrasting associations with CVD risk, with higher trunk fat being associated with increased risk of CVD and higher leg fat being associated with decreased risk of CVD. Participants who had both high trunk fat and low leg fat had a more than three-fold increased risk of CVD when compared with those in the opposite groups of the two measures.
To our knowledge, this is the first study of regional body fat and risk of CVD in a cohort of postmenopausal women with normal BMI. While a few prior studies of body fat and CVD were conducted in populations across the entire BMI range,17–20 only one study21 focused on a subset of US adults with normal BMI in the NHANES III (the Third National Health and Nutrition Examination Survey). That study demonstrated that a surrogate measure of whole-body fat (derived from bioelectrical impedance-determined lean mass) was associated with increased risk of CVD mortality (only in women), even after adjustment for waist circumference or WHR. However, data were not available for regional fat measures since bioelectrical impedance analysis was used rather than DXA.
Larger waist circumference has been associated with increased risk of CVD mortality in other populations with normal BMI.2,3 Although participants in our study had relatively low waist circumference (median 73 cm) such that only a small proportion (∼2%) surpassed the threshold for high waist circumference (≥88 cm) among women defined by current guidelines,22,23 higher trunk fat was nevertheless associated with increased risk of CVD. It is noteworthy that the observed positive association between trunk fat and CVD risk was only partially explained by central adiposity measures (i.e. waist circumference or WHR) in our study. It is possible that, among postmenopausal women with normal BMI, trunk fat measures when compared with waist circumference might better characterize certain upper-body adipose tissue depots most predictive of CVD risk, such as visceral fat mass24 and liver fat content.25 Results from the Framingham Heart Study showed that visceral fat was associated with increased risk of CVD after adjustment for waist circumference.24
A few studies have investigated DXA-measured lower-body fat in relation to CVD risk among populations with wide BMI ranges.19,20 Higher gynoid fat was associated with decreased risk of myocardial infarction in men but not in women in a Swedish cohort of middle aged and older adults.19 In the NHANES study of US men and women, leg fat percentage was not associated with CVD mortality.20 While the association between DXA-measured lower-body fat and CVD risk remains unclear, results from many prospective studies have shown an inverse association of hip circumference, a proxy measure of gluteofemoral fat deposition, with risk of major CVD.26 Interestingly, in some previous studies consisting of female participants, larger hip circumference was significantly associated with reduced CVD risk only among women within the lower BMI range (i.e. normal-weight27 or non-obese women28). Nevertheless, because hip and gynoid fat measures capture only parts of total leg fat, whether the inverse association of leg fat with risk of CVD is specific to normal BMI individuals warrants further study.
Consistent with previous findings,7–10 our results showed that relatively higher trunk fat levels were associated with various metabolic disturbances such as worse glycaemic control, elevated insulin levels, systemic inflammation, and dyslipidaemia. The associations for leg fat were generally in the opposite directions to those for trunk fat. Previous studies also have shown contrasting (i.e. detrimental vs. beneficial) associations of upper-body and lower-body fat with long-term blood pressure,29 subclinical atherosclerosis,30,31 and with risk of incident diabetes.32
The region-specific associations between body fat and CVD risk factors or CVD events are plausible given that upper and lower body contain divergent fat depots with profoundly distinct biological functions.6 Multiple mechanisms potentially responsible for these depot-dependent associations have been proposed, including regional differences in the severity of adipose inflammation, lipid storage and turnover, release of adipokines, and endocrine effects.4–6 Even for similar types of fat, leg subcutaneous adipose tissue has been found less susceptible to dysregulated release of free fatty acids resulting in lipotoxicity than is abdominal subcutaneous adipose tissue,33 supporting lower-body depots as an ideal place for fat storage. Recent results from genetic association studies showed that genetically determined low gluteofemoral fat and high abdominal fat both were associated with increased risk of coronary disease and diabetes.34
Strengths of our study include the prospective design, long-term follow-up, repeated measures of body composition using DXA scans, and adjudication of CVD events. The analyses of multiple blood biomarkers provided additional information concerning the biological plausibility for a mechanistic link between regional body fat and the development of CVD. Our study also has several limitations. Due to the observational nature, we are unable to conclude from our study that the observed associations between regional body fat and CVD risk are causal. However, some weight-loss studies have demonstrated that a reduction of trunk fat can result in expected improvements in cardiometabolic traits, whereas a reduction of leg fat may lead to CVD increasing metabolic features,35 though more clinical trials are still needed. Because trunk fat measured by DXA scans is a combination of subcutaneous and visceral fat mass, further research is needed to evaluate their associations with CVD risk individually. Our findings were derived in postmenopausal women who were predominantly whites and are yet to be investigated in men and in other age or ethnic groups.
In summary, our findings suggest that normal BMI postmenopausal women who have higher trunk fat or lower leg fat are at elevated risk of CVD. These findings highlight the importance of fat distribution beyond overall fat mass in the development of CVD.
Supplementary Material
Acknowledgements
A full list of all the investigators who have contributed to Women’s Health Initiative science appears at: https://www.whi.org/researchers/Documents%20%20Write%20a%20Paper/WHI%20Investigator%20Long%20List.pdf. We thank the Women’s Health Initiative investigators, staff, and the trial participants for their outstanding dedication and commitment. We thank Dr. Zheng Zhang (Medical College of Soochow University, Suzhou, China) for help with editing the “Take home figure”.
Funding
This work was supported by the National Heart, Lung, and Blood Institute (NHLBI), National Institutes of Health, U.S. Department of Health and Human Services through contracts HHSN268201600018C, HHSN268201600001C, HHSN268201600002C, HHSN268201600003C, and HHSN268201600004C. Q.Q. is supported by NHLBI K01HL129892, R01HL060712, and R01HL140976; and by the National Institute of Diabetes and Digestive and Kidney Diseases (NIDDK) R01DK119268.
Conflict of interest: N.M.I. has received consulting fees from Novartis and Puma Biotechnology. All other authors declared no conflict of interest.
See page 2856 for the editorial comment on this article (doi: 10.1093/eurheartj/ehz411)
References
- 1. Romero-Corral A, Lopez-Jimenez F, Sierra-Johnson J, Somers VK.. Differentiating between body fat and lean mass-how should we measure obesity? Nat Clin Pract Endocrinol Metab 2008;4:322–323. [DOI] [PubMed] [Google Scholar]
- 2. Sahakyan KR, Somers VK, Rodriguez-Escudero JP, Hodge DO, Carter RE, Sochor O, Coutinho T, Jensen MD, Roger VL, Singh P, Lopez-Jimenez F.. Normal-weight central obesity: implications for total and cardiovascular mortality. Ann Intern Med 2015;163:827–835. [DOI] [PMC free article] [PubMed] [Google Scholar]
- 3. Zhang C, Rexrode KM, van Dam RM, Li TY, Hu FB.. Abdominal obesity and the risk of all-cause, cardiovascular, and cancer mortality: sixteen years of follow-up in US women. Circulation 2008;117:1658–1667. [DOI] [PubMed] [Google Scholar]
- 4. Karpe F, Pinnick KE.. Biology of upper-body and lower-body adipose tissue—link to whole-body phenotypes. Nat Rev Endocrinol 2015;11:90–100. [DOI] [PubMed] [Google Scholar]
- 5. Stefan N, Schick F, Haring HU.. Causes, characteristics, and consequences of metabolically unhealthy normal weight in humans. Cell Metab 2017;26:292–300. [DOI] [PubMed] [Google Scholar]
- 6. Tchkonia T, Thomou T, Zhu Y, Karagiannides I, Pothoulakis C, Jensen MD, Kirkland JL.. Mechanisms and metabolic implications of regional differences among fat depots. Cell Metab 2013;17:644–656. [DOI] [PMC free article] [PubMed] [Google Scholar]
- 7. Snijder MB, Dekker JM, Visser M, Bouter LM, Stehouwer CD, Yudkin JS, Heine RJ, Nijpels G, Seidell JC, Hoorn S.. Trunk fat and leg fat have independent and opposite associations with fasting and postload glucose levels: the Hoorn study. Diabetes Care 2004;27:372–377. [DOI] [PubMed] [Google Scholar]
- 8. Van Pelt RE, Jankowski CM, Gozansky WS, Schwartz RS, Kohrt WM.. Lower-body adiposity and metabolic protection in postmenopausal women. J Clin Endocrinol Metab 2005;90:4573–4578. [DOI] [PMC free article] [PubMed] [Google Scholar]
- 9. Vasan SK, Osmond C, Canoy D, Christodoulides C, Neville MJ, Di Gravio C, Fall CHD, Karpe F.. Comparison of regional fat measurements by dual-energy X-ray absorptiometry and conventional anthropometry and their association with markers of diabetes and cardiovascular disease risk. Int J Obes (Lond) 2018;42:850–857. [DOI] [PMC free article] [PubMed] [Google Scholar]
- 10. Williams MJ, Hunter GR, Kekes-Szabo T, Snyder S, Treuth MS.. Regional fat distribution in women and risk of cardiovascular disease. Am J Clin Nutr 1997;65:855–860. [DOI] [PubMed] [Google Scholar]
- 11. JafariNasabian P, Inglis JE, Reilly W, Kelly OJ, Ilich JZ.. Aging human body: changes in bone, muscle and body fat with consequent changes in nutrient intake. J Endocrinol 2017;234:R37–R51. [DOI] [PubMed] [Google Scholar]
- 12. Kramer CK, Zinman B, Retnakaran R.. Are metabolically healthy overweight and obesity benign conditions?: A systematic review and meta-analysis. Ann Intern Med 2013;159:758–769. [DOI] [PubMed] [Google Scholar]
- 13. Design of the Women's Health Initiative clinical trial and observational study. The Women's Health Initiative Study Group. Control Clin Trials 1998;19:61–109. [DOI] [PubMed] [Google Scholar]
- 14. Iyengar NM, Arthur R, Manson JE, Chlebowski RT, Kroenke CH, Peterson L, Cheng TD, Feliciano EC, Lane D, Luo J, Nassir R, Pan K, Wassertheil-Smoller S, Kamensky V, Rohan TE, Dannenberg AJ.. Association of body fat and risk of breast cancer in postmenopausal women with normal body mass index: a secondary analysis of a randomized clinical trial and observational study. JAMA Oncol 2018. [Epub ahead of print]. [DOI] [PMC free article] [PubMed] [Google Scholar]
- 15. Curb JD, McTiernan A, Heckbert SR, Kooperberg C, Stanford J, Nevitt M, Johnson KC, Proulx-Burns L, Pastore L, Criqui M, Daugherty S; WHI Morbidity and Mortality Committee. Outcomes ascertainment and adjudication methods in the Women's Health Initiative. Ann Epidemiol 2003;13:S122–S128. [DOI] [PubMed] [Google Scholar]
- 16. Heckbert SR, Kooperberg C, Safford MM, Psaty BM, Hsia J, McTiernan A, Gaziano JM, Frishman WH, Curb JD.. Comparison of self-report, hospital discharge codes, and adjudication of cardiovascular events in the Women's Health Initiative. Am J Epidemiol 2004;160:1152–1158. [DOI] [PubMed] [Google Scholar]
- 17. Iliodromiti S, Celis-Morales CA, Lyall DM, Anderson J, Gray SR, Mackay DF, Nelson SM, Welsh P, Pell JP, Gill JMR, Sattar N.. The impact of confounding on the associations of different adiposity measures with the incidence of cardiovascular disease: a cohort study of 296 535 adults of white European descent. Eur Heart J 2018;39:1514–1520. [DOI] [PMC free article] [PubMed] [Google Scholar]
- 18. Myint PK, Kwok CS, Luben RN, Wareham NJ, Khaw KT.. Body fat percentage, body mass index and waist-to-hip ratio as predictors of mortality and cardiovascular disease. Heart 2014;100:1613–1619. [DOI] [PubMed] [Google Scholar]
- 19. Wiklund P, Toss F, Jansson JH, Eliasson M, Hallmans G, Nordstrom A, Franks PW, Nordstrom P.. Abdominal and gynoid adipose distribution and incident myocardial infarction in women and men. Int J Obes (Lond) 2010;34:1752–1758. [DOI] [PubMed] [Google Scholar]
- 20. Zong G, Zhang Z, Yang Q, Wu H, Hu FB, Sun Q.. Total and regional adiposity measured by dual-energy X-ray absorptiometry and mortality in NHANES 1999-2006. Obesity (Silver Spring) 2016;24:2414–2421. [DOI] [PMC free article] [PubMed] [Google Scholar]
- 21. Romero-Corral A, Somers VK, Sierra-Johnson J, Korenfeld Y, Boarin S, Korinek J, Jensen MD, Parati G, Lopez-Jimenez F.. Normal weight obesity: a risk factor for cardiometabolic dysregulation and cardiovascular mortality. Eur Heart J 2010;31:737–746. [DOI] [PMC free article] [PubMed] [Google Scholar]
- 22. Cornier MA, Després JP, Davis N, Grossniklaus DA, Klein S, Lamarche B, Lopez-Jimenez F, Rao G, St-Onge MP, Towfighi A, Poirier P; American Heart Association Obesity Committee of the Council on Nutrition; Physical Activity and Metabolism; Council on Arteriosclerosis; Thrombosis and Vascular Biology; Council on Cardiovascular Disease in the Young; Council on Cardiovascular Radiology and Intervention; Council on Cardiovascular Nursing, Council on Epidemiology and Prevention; Council on the Kidney in Cardiovascular Disease, and Stroke Council. Assessing adiposity: a scientific statement from the American Heart Association. Circulation 2011;124:1996–2019. [DOI] [PubMed] [Google Scholar]
- 23. Piepoli MF, Hoes AW, Agewall S, Albus C, Brotons C, Catapano AL, Cooney MT, Corrà U, Cosyns B, Deaton C, Graham I, Hall MS, Hobbs FDR, Løchen ML1, Löllgen H, Marques-Vidal P, Perk J, Prescott E, Redon J, Richter DJ, Sattar N, Smulders Y, Tiberi M, van der Worp HB, van Dis I, Verschuren WMM, Binno SESC Scientific Document Group. 2016 European Guidelines on cardiovascular disease prevention in clinical practice: The Sixth Joint Task Force of the European Society of Cardiology and Other Societies on Cardiovascular Disease Prevention in Clinical Practice (constituted by representatives of 10 societies and by invited experts) Developed with the special contribution of the European Association for Cardiovascular Prevention & Rehabilitation (EACPR). Eur Heart J 2016;37:2315–2381. [DOI] [PMC free article] [PubMed] [Google Scholar]
- 24. Britton KA, Massaro JM, Murabito JM, Kreger BE, Hoffmann U, Fox CS.. Body fat distribution, incident cardiovascular disease, cancer, and all-cause mortality. J Am Coll Cardiol 2013;62:921–925. [DOI] [PMC free article] [PubMed] [Google Scholar]
- 25. Lauridsen BK, Stender S, Kristensen TS, Kofoed KF, Køber L, Nordestgaard BG, Tybjærg-Hansen A.. Liver fat content, non-alcoholic fatty liver disease, and ischaemic heart disease: Mendelian randomization and meta-analysis of 279 013 individuals. Eur Heart J 2018;39:385–393. [DOI] [PubMed] [Google Scholar]
- 26. Heitmann BL, Lissner L.. Hip Hip Hurrah! Hip size inversely related to heart disease and total mortality. Obes Rev 2011;12:478–481. [DOI] [PubMed] [Google Scholar]
- 27. Lanfer A, Mehlig K, Heitmann BL, Lissner L.. Does change in hip circumference predict cardiovascular disease and overall mortality in Danish and Swedish women? Obesity (Silver Spring) 2014;22:957–963. [DOI] [PubMed] [Google Scholar]
- 28. Mohebi R, Bozorgmanesh M, Azizi F, Hadaegh F.. Effects of obesity on the impact of short-term changes in anthropometric measurements on coronary heart disease in women. Mayo Clin Proc 2013;88:487–494. [DOI] [PubMed] [Google Scholar]
- 29. Yano Y, Vongpatanasin W, Ayers C, Turer A, Chandra A, Carnethon MR, Greenland P, de Lemos JA, Neeland IJ.. Regional fat distribution and blood pressure level and variability: the Dallas heart study. Hypertension 2016;68:576–583. [DOI] [PMC free article] [PubMed] [Google Scholar]
- 30. Lee M, Choh AC, Demerath EW, Towne B, Siervogel RM, Czerwinski SA.. Associations between trunk, leg and total body adiposity with arterial stiffness. Am J Hypertens 2012;25:1131–1137. [DOI] [PMC free article] [PubMed] [Google Scholar]
- 31. Tanko LB, Bagger YZ, Alexandersen P, Larsen PJ, Christiansen C.. Peripheral adiposity exhibits an independent dominant antiatherogenic effect in elderly women. Circulation 2003;107:1626–1631. [DOI] [PubMed] [Google Scholar]
- 32. Tatsukawa Y, Misumi M, Kim YM, Yamada M, Ohishi W, Fujiwara S, Nakanishi S, Yoneda M.. Body composition and development of diabetes: a 15-year follow-up study in a Japanese population. Eur J Clin Nutr 2018;72:374–380. [DOI] [PubMed] [Google Scholar]
- 33. Jensen MD. Gender differences in regional fatty acid metabolism before and after meal ingestion. J Clin Invest 1995;96:2297–2303. [DOI] [PMC free article] [PubMed] [Google Scholar]
- 34. Lotta LA, Wittemans LBL, Zuber V, Stewart ID, Sharp SJ, Luan J, Day FR, Li C, Bowker N, Cai L, De Lucia Rolfe E, Khaw KT, Perry JRB, O’Rahilly S, Scott RA, Savage DB, Burgess S, Wareham NJ, Langenberg C.. Association of genetic variants related to gluteofemoral vs abdominal fat distribution with type 2 diabetes, coronary disease, and cardiovascular risk factors. JAMA 2018;320:2553–2563. [DOI] [PMC free article] [PubMed] [Google Scholar]
- 35. Okura T, Nakata Y, Yamabuki K, Tanaka K.. Regional body composition changes exhibit opposing effects on coronary heart disease risk factors. Arterioscler Thromb Vasc Biol 2004;24:923–929. [DOI] [PubMed] [Google Scholar]
Associated Data
This section collects any data citations, data availability statements, or supplementary materials included in this article.