Abstract
The c-MYC (MYC) oncoprotein is often overexpressed in human breast cancer; however, its role in driving disease phenotypes is poorly understood. Here, we investigate the role of MYC in HER2+ disease, examining the relationship between HER2 expression and MYC phosphorylation in HER2+ patient tumors and characterizing the functional effects of deregulating MYC expression in the murine NeuNT model of amplified-HER2 breast cancer. Deregulated MYC alone was not tumorigenic, but coexpression with NeuNT resulted in increased MYC Ser62 phosphorylation and accelerated tumorigenesis. The resulting tumors were metastatic and associated with decreased survival compared with NeuNT alone. MYC;NeuNT tumors had increased intertumoral heterogeneity including a subtype of tumors not observed in NeuNT tumors, which showed distinct metaplastic histology and worse survival. The distinct subtypes of MYC;NeuNT tumors match existing subtypes of amplified-HER2, estrogen receptor–negative human tumors by molecular expression, identifying the preclinical utility of this murine model to interrogate subtype-specific differences in amplified-HER2 breast cancer. We show that these subtypes have differential sensitivity to clinical HER2/EGFR–targeted therapeutics, but small-molecule activators of PP2A, the phosphatase that regulates MYC Ser62 phosphorylation, circumvents these subtype-specific differences and ubiquitously suppresses tumor growth, demonstrating the therapeutic utility of this approach in targeting deregulated MYC breast cancers.
Keywords: Cell Biology, Oncology
Keywords: Breast cancer, Mouse models, Oncogenes
Introduction
Amplified-HER2 breast cancer is an aggressive disease that until recently had the worst overall survival prognosis among breast cancer subtypes (1, 2). The clinical implementation of HER2-targeted therapies, including antibody-based approaches (e.g., trastuzumab, pertuzumab) and small-molecule inhibitors (lapatinib, neratinib) have greatly improved overall survival in this subtype (3, 4). However, despite these positive results, many patients still experience innate or acquired resistance to HER2-targeted agents (3–6), with nearly a quarter of women relapsing within the first 3 years despite the use of HER2-targeted therapy (7, 8). These results highlight the need for increased molecular understanding of how tumors differ in the patient population, and how HER2 amplification may cooperate with different deregulated oncogenic pathways to drive distinct tumor biology and drug resistance.
A likely cooperative factor in the tumorigenesis of amplified-HER2 breast cancer is the deregulation of the oncoprotein c-MYC (MYC). MYC levels are tightly regulated in normal cells both transcriptionally and posttranscriptionally (9–12). Most human cancers evolve to lose this regulation, which can contribute to almost all aspects of oncogenesis (13–18). In breast cancer, MYC expression is deregulated through gene amplification or increased transcription, translation, or enhanced protein stability in a high percentage of tumors (19–22). Our lab has previously published examples of increased phosphorylation of MYC at Ser62 (p-S62-MYC), which increases MYC protein stability and transactivation of target genes, in human breast tumors and breast cancer cell lines including estrogen receptor–positive (ER+), triple-negative, and amplified-HER2 breast cancer (23, 24). Deregulation of MYC stability may be particularly relevant in amplified-HER2 breast cancer, in which MYC amplification occurs at a higher rate than other breast tumor subtypes, and coamplification of MYC and HER2 is associated with worse outcome than either amplification alone (25–28). In addition, high nuclear staining for MYC protein was associated with HER2 positivity and lymph node–positive disease (29). These observations support the notion that there is cooperation between HER2 signaling and deregulated MYC. Indeed, several studies have shown that HER2 signaling supports MYC expression at both the transcriptional and translational level (30–32) and as we and others have shown at the level of posttranslational stabilization mediated by Ser62 phosphorylation (23, 24, 33). However, these effects have not been characterized in vivo, and the contribution of HER2 signaling and posttranslational activation of MYC to tumor phenotypes, particularly in relation to response to HER2-targeted therapy, has not been studied. Additionally, pharmacologically targeting MYC phosphorylation in relevant in vivo models of amplified-HER disease has not been explored.
Here we investigated the relationship between amplified HER2 and the posttranslational regulation of MYC using human breast cancer cell lines, human HER2+ patient samples, and the NeuNT murine model of amplified-HER breast cancer (34). Through the generation of a genetically engineered mouse model combining a Rosa-LSL-Myc;Blg-Cre strain with the NeuNT mouse model, we characterize the phenotypic and behavioral consequences of tumors that have deregulated MYC and HER2. This combination of deregulated MYC and amplified activated HER2 accelerated tumorigenesis, metastasis, and lethality. Interestingly, tumors with deregulated MYC and HER2 generated a larger array of distinct subgroups of tumor phenotypes compared with NeuNT alone, and these subgroups show high molecular similarity to tumor subtypes observed in the HER2+ER– human patient population, indicating that this model may provide a unique tool for assessing the spectrum of patient HER2+ tumor behavior and drug response. Indeed, our investigation reveals that the distinct tumor subgroups respond differently to the EGFR/HER2–targeted therapy lapatinib. Despite these subtype-specific differences in HER2-targeted therapy response, we also demonstrate that by directly targeting MYC stabilization through use of a small-molecule activator of PP2A that stimulates the dephosphorylation of Ser62, we can overcome this heterogeneity and effectively inhibit all tumor subgroups, identifying a therapeutic approach that may circumvent the innate resistance associated with HER-targeted agents. Together, these findings expand our understanding of how deregulated MYC contributes to the evolution of aggressive tumor subtypes, increasing intertumoral heterogeneity and varied tumor responses to targeted therapeutics, and we introduce a therapeutic strategy that can circumvent such issues in intertumoral heterogeneity.
Results
HER2 signaling increases MYC phosphorylation at Ser62 and protein stability.
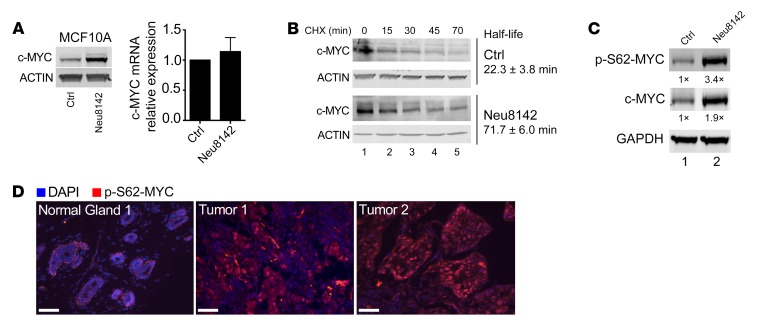
Signaling pathways downstream of activated HER2, including RAS/ERK and PI3K/AKT, have been shown to stabilize MYC protein in several cell systems (35, 36). To directly examine whether HER2 activation regulates MYC posttranslationally in breast cancer, we generated stable cell lines using the nontransformed mammary epithelial cell line MCF10A engineered to express Neu8142 (MCF10A-Neu8142), which has a deletion mutation in its extracellular domain to allow it to constitutively form an activated HER2 dimer (37); conversely, control MCF10A (MCF10A-Ctrl) cells were generated with an empty vector. Neu expression was confirmed through reverse transcription PCR (RT-PCR) (Supplemental Figure 1A; supplemental material available online with this article; https://doi.org/10.1172/JCI126390DS1). Western blot analysis revealed an increase in the endogenous MYC protein level in MCF10A-Neu8142 compared with MCF10A-Ctrl (Figure 1A, Western), while MYC mRNA was not significantly altered (Figure 1A, graph). Previously, the MYC 5′ UTR and 3′ UTR have been shown to harbor sequences that can affect MYC mRNA translation and stability (38–40). To test whether Neu8142 could increase MYC protein independently of this mechanism, we utilized expression of adenoviral MYC (Ad-MYC) that lacks most of the 5′ and 3′ UTR sequences and observed increased ectopic MYC protein but not mRNA levels in Ad-MYC–infected MCF10A-Neu8142 cells (Supplemental Figure 1B). Furthermore, we examined the half-life of MYC protein in these cells. MYC protein half-life was increased from 22 minutes in MCF10A-Ctrl cells to 71 minutes in MCF10A-Neu8142 cells (Figure 1B). MYC stability is highly regulated in cells and MYC protein is usually quickly degraded, with a half-life of only 20–30 minutes (11, 41). MYC is significantly stabilized in tumor-derived cell lines, including Burkitt’s lymphoma–derived lines that have impaired posttranslational regulation of MYC and show a 2- to 6-fold increase in MYC half-life (14, 23, 41–44). Based on these studies, we believe the observed 3-fold increase in MYC stabilization in NeuNT-expressing cells is likely to have substantial biological impact through MYC’s oncogenic functions. Consistent with its deregulated stability, MCF10A-Neu8142 cells lack the normally tight peak of MYC expression in response to mitogen stimulation, with a higher baseline MYC expression in starved conditions and a slower downregulation following peak expression (Supplemental Figure 1C). Together, these results demonstrate that HER2 activation posttranslationally stabilizes MYC.
Figure 1. HER2 regulates MYC protein stability and phosphorylation at Ser62.
(A) Western and quantitative RT-PCR (qRT-PCR) analysis in MCF10A-Ctrl and MCF10A-Neu8142 cells showing endogenous MYC protein (representative Western blots [n = 3], left) and mRNA levels (right graph, mean ± SEM, n = 3). (B) Western blot and MYC half-life calculation in MCF10A-Ctrl (top) and MCF10A-Neu8142 cells (bottom) infected with Ad-MYC. Representative Westerns and mean half-life ± SD indicated, from 2 independent experiments. CHX, cycloheximide. (C) Western blot of MCF10A-TR-MYC-Ctrl and MCF10A-TR-MYC-Neu8142 cells treated with doxycycline for 24 hours. Representative (n = 3) expression of ectopic MYC protein levels and p-S62-MYC levels are shown and quantified. (D) Immunofluorescence images of 2 human HER2+ breast tumors and patient-matched normal region adjacent to tumor 1. Scale bars: 50 μm. See Supplemental Figure 1D for quantification of these and additional tumors and normal tissues.
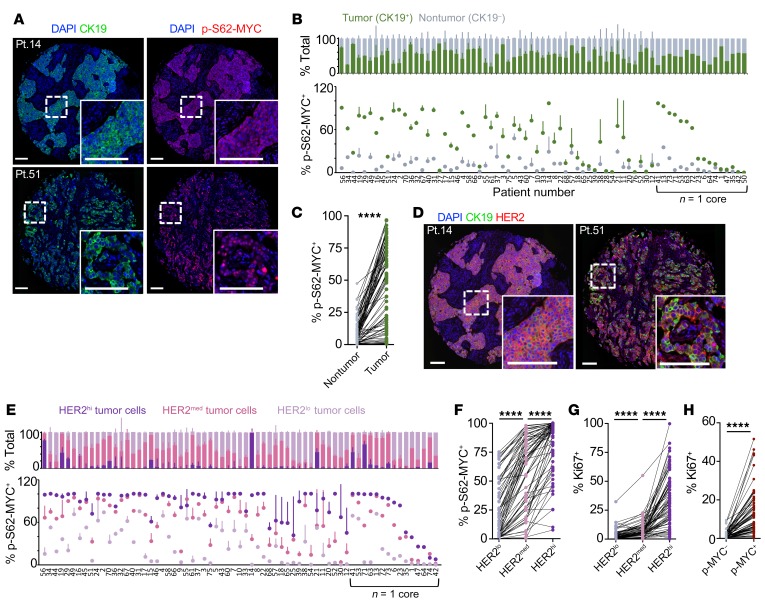
Since Ser62 phosphorylation has been previously associated with increased MYC stability (23, 24), we examined this phosphorylation site in response to Neu8142 expression. We observed increased p-S62-MYC in MCF10A-TR-MYC-Neu8142 cells compared with MCF10A-TR-MYC control cells, which lacked Neu (Figure 1C). To determine if a similar increase in Ser62 phosphorylation is present in primary HER2+ breast cancer patient samples, we obtained 4 HER2+ breast tumors chosen at random from the Oregon Health and Science University (OHSU) patient biobank by a clinical pathologist and examined expression of p-S62-MYC in the tumors and adjacent normal regions present in 2 of the tumors. Three of these tumor samples showed increased phosphorylation of MYC at Ser62 relative to matched available adjacent ducts (Figure 1D and Supplemental Figure 1D), and combined with our previous HER2+ patient tumor data (23, 24), we found that the majority of the HER2+ breast tumors we examined (6 of 10) showed high p-S62-MYC relative to matched normal tissue. To more robustly investigate the expression of p-S62-MYC in HER2+ patient tumors, and its relationship with tumor versus stromal cells, HER2 expression, and proliferation, we obtained a tissue microarray (TMA) containing 76 patient tumors with 75 HER2+ cases and 1 HER2– tumor and 2 cores per case (Supplemental Figure 2A). We performed cyclic immunofluorescence and single-cell image segmentation and image cytometry to assess cellular expression of p-S62-MYC, the epithelial tumor marker cytokeratin 19 (CK19), HER2, and the proliferation marker, Ki-67, in the tumors (Supplemental Figure 2, B and C). We found that almost all tumor cells expressed CK19, and we used CK19+ cells to examine p-S62-MYC levels in tumor and nontumor fractions (Figure 2A). p-S62-MYC–positive cells were determined based on bimodal cellular expression gates (Supplemental Figure 2C). We found that the frequency of p-S62-MYC–positive cells was higher in the tumor cell fraction in all cases that showed some p-S62-MYC–positive staining (71 of 75) (Figure 2, B and C). We observed that most of the HER2+ cases had tumor cells with variable levels of HER2 expression, and we sought to understand the relationship between the level of HER2 expression and p-S62-MYC positivity. We created gates for HER2hi, HER2med, and HER2lo tumor cell populations (Supplemental Figure 2D) and compared the frequency of p-S62-MYC–positive cells among these populations in tumors that contained at least 2% HER2hi and/or HER2med cells (67 of 71 cases, Figure 2D). We found that p-S62-MYC positivity correlated with HER2 expression levels, being significantly higher in HER2hi versus HER2med populations, and significantly higher between HER2med and HER2lo populations (Figure 2, E and F). Similarly, Ki-67 expression, marking proliferating cells, was positively correlated with HER2 and p-S62-MYC expression, with Ki-67–positive cells being significantly higher in cells positive for p-S62-MYC and for HER2hi and HER2med (Figure 2, G and H).
Figure 2. MYC phosphorylation is elevated in HER2+ patient tumors and correlated with HER2 expression.
(A) Immunofluorescence images of 2 human HER2+ breast tumors from a TMA of 75 HER2+ patients with local disease showing CK19 (green) and p-S62-MYC (red) expression, with DAPI staining nuclei (blue); insets show higher magnification. Scale bars: 100 μm. (B) TMA tumor images were segmented for single cells and cells were classified as part of the tumor (CK19+) or nontumor stromal (CK19–) compartment. The frequency of p-S62-MYC positivity is compared between the compartments, with tumors arranged by the Z-score of frequency difference (n = 71 assessable cores). SDs calculated from comparing frequencies between patient-matched cores (patients with one sample are grouped to right, arranged by p-S62-MYC frequency in tumor cells). (C) A patient-paired vertical scatterplot showing p-S62-MYC+ cell frequency between the nontumor stroma and tumor compartments of patients (n = 71). (D) Immunofluorescence images showing expression of CK19 (green), HER2 (red), and DAPI staining (blue) in patient tumors from A. Scale bars: 100 μm. (E) The frequency of p-S62-MYC+ tumor cells is compared between the HER2hi, HER2med, and HER2lo fractions of each tumor containing at least 2% HER2hi/med tumor cells (n = 67). Tumors are arranged by the cumulative Z-score of p-S62-MYC frequency between HER2hi, HER2med, and HER2lo fractions. SDs shown between patient-matched cores (patients with one sample are grouped to right, arranged by the frequency of p-S62-MYC+ cells in the HER2hi fraction). (F) A patient-paired vertical scatterplot showing p-S62-MYC+ cell frequency between the HER2hi, HER2med, and HER2lo tumor cell fractions (n = 67). (G) The frequency of Ki-67+ cells is compared between HER2hi, HER2med, and HER2lo fractions as in F. (H) The frequency of Ki-67+ cells is shown between the p-S62-MYC–positive and –negative tumor fractions (n = 71). ****P < 0.001 by Wilcoxon’s matched-pairs signed-rank test, indicating significant differences in frequency between compartments (C and F–H).
Taken together, these results indicate that HER2 pathway activity can posttranslationally increase Ser62 phosphorylation and MYC protein stability in HER2+ breast cancer cells, and that this direct relationship is prominent in patient tumors, where p-S62-MYC levels are upregulated in tumor cells and positively correlated to the level of HER2 expression and to cell proliferation.
Coexpression of deregulated MYC and activated Neu in the mammary epithelium accelerates tumorigenesis.
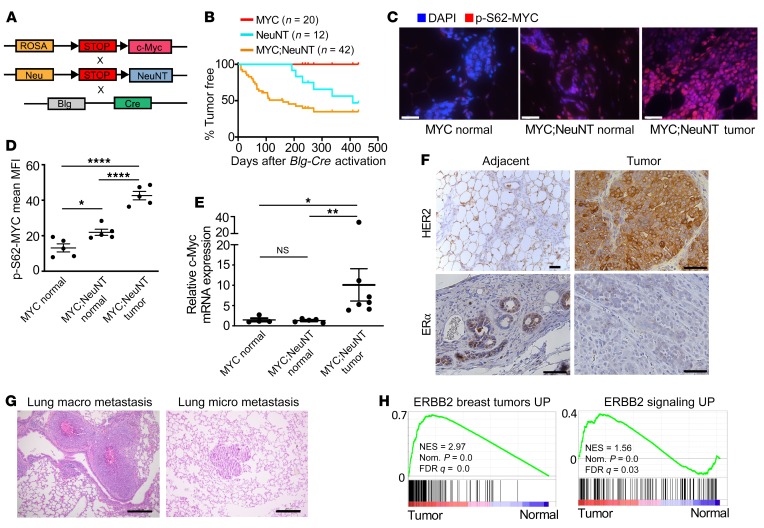
Since HER2 signaling can posttranslationally stabilize MYC, we investigated the in vivo cooperativity of MYC and HER2 under physiological levels of expression of each oncogene. We generated Rosa-LSL-Myc;LSL-NeuNT;Blg-Cre (MYC;NeuNT) mice by crossing Rosa-LSL-Myc mice that express Cre-inducible MYC from the ROSA26 locus, which results in constitutive expression but at physiological levels relevant to human disease (33), with LSL-NeuNT (NeuNT) mice (34), which carry 1 Cre-inducible allele of activated Neu, and with β-lactoglobulin–Cre (Blg-Cre) transgenic mice for mammary-specific Cre expression in late pregnancy and during lactation (45) (Figure 3A). Compared with hormone receptor–positive breast cancer, HER2+ breast cancer has been shown to be enriched in parous women at younger ages (46), as well as in women with a recent pregnancy (47), particularly for HER2+ER– cases, suggesting that the postpartum skewing of Blg-Cre has some relevance to human HER2+ disease. NeuNT is a mutant form of rat HER2, which harbors a point mutation in the transmembrane region leading to autodimerization of the receptor, and functions similarly to Neu8142. We confirmed mammary-specific expression of Cre in these MYC;NeuNT mice by PCR with recombination primers (Supplemental Figure 3A) and also by crossing Rosa-LSL-Myc;Blg-Cre (MYC) mice with the Rosa-LSL-LacZ reporter mice. β-Gal staining demonstrated that the Cre expression was restricted to luminal epithelial and myoepithelial cells in the mammary gland during pregnancy and maintained after pregnancy in the parous gland (Supplemental Figure 3B).
Figure 3. Deregulated MYC accelerates HER2 tumorigenesis in vivo.
(A) Schematic showing the mouse strains crossed to generate the MYC;NeuNT (Rosa-LSL-Myv;LSL-NeuNT;Blg-Cre) mice. (B) Mammary gland tumor incidence from MYC (Rosa-LSL-Myc;Blg-Cre), NeuNT (LSL-NeuNT;Blg-Cre), and MYC;NeuNT (Rosa-LSL-Myc;LSL-NeuNT;Blg-Cre) mice. (C) Immunofluorescence images of p-S62-MYC in normal mammary gland from the MYC and MYC;NeuNT mice; and mammary tumors from MYC;NeuNT mice. Scale bars: 50 μm. (D) Mean fluorescence intensity (MFI) of p-Ser62-MYC was measured in p-Ser62-MYC–positive cells and compared between each mouse strain shown in C (n = 5 normal mammary gland/tumors per mouse strain). Asterisks denote significant differences in MFI: *P < 0.05, ****P < 0.0001, 1-way ANOVA corrected for multiple comparisons. (E) qRT-PCR of Myc mRNA levels in MYC (n = 4) and MYC;NeuNT (n = 6) normal mammary glands, as well as MYC;NeuNT mammary tumors (n = 6). Asterisks denote significant differences in expression: *P < 0.05 and **P < 0.01, Kruskal-Wallis test corrected for multiple comparisons. NS, not significant. (F) Images of representative (n = 45) chromogenic IHC for HER2 and ERα in MYC;NeuNT mammary tumors and adjacent normal mammary gland. Scale bars: 50 μm. (G) Representative H&E staining of macro and micro lung metastasis in MYC;NeuNT mice (n = 40). Scale bars: 200 μm. (H) GSEA results examining gene sets related to human ERBB2 breast tumors (left) and ERBB signaling (right), comparing MYC;NeuNT tumors with normal mammary gland. See Supplemental data set 2 for full GSEA results. NES, normalized enrichment score.
To investigate a role for deregulated MYC and activated Neu in mammary tumor development, we monitored female mice that had passed through 2 cycles of pregnancy/lactation in order to activate Blg-Cre expression around 10–12 weeks of age. We compared tumor-free survival of the MYC;NeuNT mice relative to MYC and NeuNT mice, all in a BL6/129S1/FVB mixed genetic background. Mice bearing only the deregulated MYC did not develop mammary tumors by 64 weeks after Blg-Cre activation, consistent with our previous work using Rosa-LSL-Myc;WAP-Cre mice (33) where we found low-level expression of wild-type MYC from the ROSA locus to be insufficient to drive tumorigenesis (Figure 3B). NeuNT mice developed tumors between 28 and 44 weeks after Blg-Cre activation, with 50% penetrance. Coexpression of deregulated, physiological levels of MYC with activated Neu accelerated tumorigenesis, and these MYC;NeuNT mice were found to rapidly develop mammary tumors between 4 and 12 weeks after Blg-Cre activation, at 65% penetrance. These tumorigenic effects of deregulated MYC and Neu were also observed in FVB background mice, where MYC;NeuNT tumor penetrance was even higher, at 94% (Supplemental Figure 3C).
To investigate whether NeuNT posttranslationally regulates MYC in vivo, we analyzed p-S62-MYC levels in the mammary glands of non–tumor-bearing MYC and MYC;NeuNT mice, as well as in tumors from the latter group. We found that p-S62-MYC levels are increased in the mammary gland of MYC;NeuNT mice compared with MYC mice before tumorigenesis occurs (Figure 3, C and D), whereas MYC mRNA levels were unchanged (Figure 3E). In MYC;NeuNT tumors, both MYC mRNA and p-S62-MYC protein were increased, consistent with increased proliferation and epithelial content, and aligning with our observations of high p-S62-MYC levels in HER2+ patient tumors (Figure 3, C–E). These results indicate that deregulated HER2 signaling in vivo can posttranslationally stabilize MYC, generating a more stable transcriptionally active form of MYC (48, 49), associated with accelerated tumorigenesis.
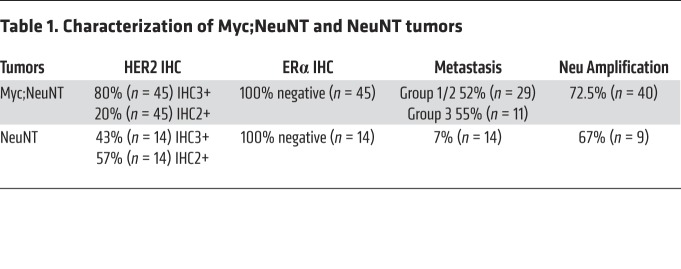
Prior studies on NeuNT mice indicated that the NeuNT gene is frequently amplified in developing mammary tumors (37). We assessed NeuNT amplification in the MYC;NeuNT and NeuNT mammary tumors to determine whether deregulated MYC expression affects NeuNT gene amplification. In tumors with coexpression of deregulated MYC and activated NeuNT, we found that NeuNT gene amplification occurred in approximately 70% of tumors, at a similar frequency to that in NeuNT tumors, although the copy number ranged from 4 to 12 copies in MYC;NeuNT tumors compared with the tumors driven by NeuNT without ectopic MYC, in which NeuNT gene copy number ranged from 20 to 120 copies (Supplemental Figure 3D and Table 1). MYC;NeuNT mammary tumors showed high membrane staining for HER2/Neu by immunohistochemistry (IHC) (Figure 3F and Table 1). Similar to the NeuNT model, all MYC;NeuNT tumors were negative for ERα, whereas non-neoplastic mammary epithelial cells adjacent to the tumors showed ERα expression (Figure 3F and Supplemental Figure 4C). Functionally, beyond showing reduced tumor-free survival (see Figure 3B), MYC;NeuNT tumors were more metastatic at the endpoint, with a 55% rate of metastasis to the lung and/or liver compared with a 7% metastatic rate for NeuNT endpoint tumors (Figure 3G and Table 1). Together, these data indicate that the MYC;NeuNT mice are an in vivo model of aggressive ER–HER2+ breast cancer.
Table 1. Characterization of Myc;NeuNT and NeuNT tumors.
Multiple molecular and histologic subtypes are present in MYC-NeuNT tumors.
We next performed gene expression profiling on 14 MYC;NeuNT tumors, 4 NeuNT tumors, and 4 control (no Cre) normal mammary glands by RNA sequencing (RNA-Seq) to characterize the molecular characteristics of this murine model of amplified-HER2 breast cancer. Using gene set enrichment analysis (GSEA) (50) we queried breast cancer–related gene sets and all gene sets in the oncogenic signatures gene set collection (C6) and curated gene set collection (C2) of the molecular signature database (MsigDB) (51) (Supplemental data set 2) and found that the most-enriched gene set in the C2 database was one encompassing genes upregulated in ERBB2-driven murine tumors, and similarly, a gene set upregulated by activated ERBB2 in human breast cancer cells was one of the top-enriched gene sets in the C6 database (Figure 3H and Supplemental data set 2).
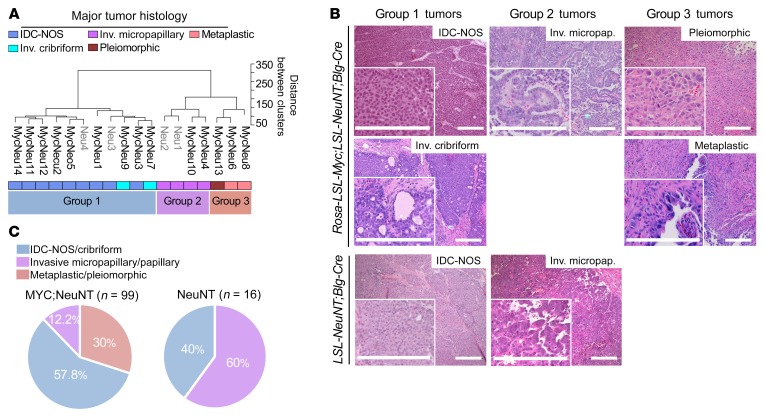
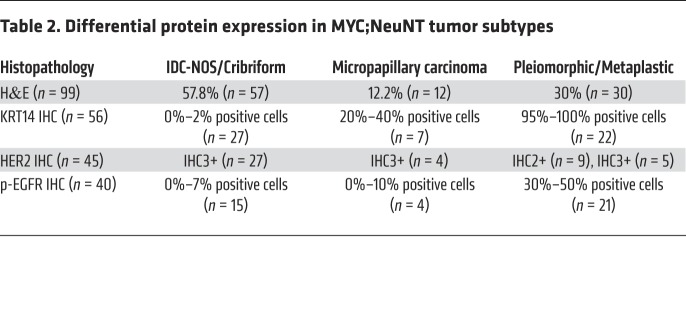
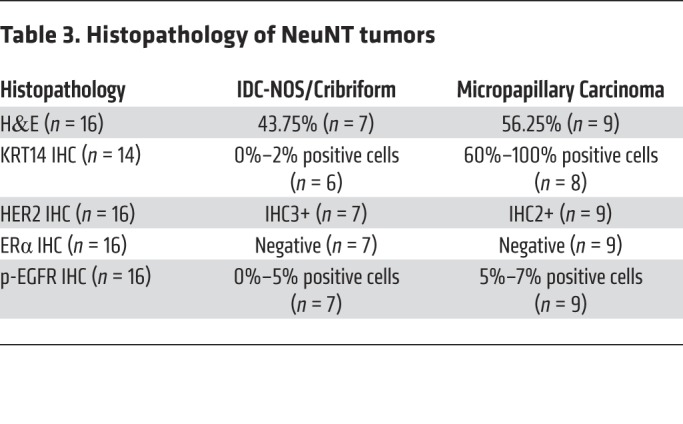
It is well understood that breast cancer is a heterogeneous disease, with intertumoral heterogeneity being observed even within breast cancer subtypes (e.g., HER2+) (52–54). We therefore performed unsupervised hierarchical clustering on normalized gene expression data with the 14 MYC;NeuNT tumors and 4 NeuNT tumors to examine the heterogeneity within our MYC;NeuNT model. This analysis revealed 3 distinct tumor clusters, which we refer to as group 1 (G1), group 2 (G2), and group 3 (G3) tumors (Figure 4A). Histopathologic analysis by 2 different pathologists, blinded to genotype, revealed distinct associations between molecular groups (Figure 4A) and tumor histology (Figure 4B); the majority of G1 tumors showed an invasive ductal carcinoma of not otherwise specified (IDC-NOS) histology, the most common form of invasive breast cancer that accounts for 55% of breast cancer incidence upon diagnosis, while the rest of the G1 tumors showed an invasive cribriform histology. G2 tumors were marked by an invasive micropapillary carcinoma histology, which is a very aggressive form of breast cancer and usually mixed in with IDC-NOS, with a very high rate of lymph node metastasis. G3 tumors showed pleiomorphic and metaplastic histology, which is a malignancy characterized by the histologic presence of 2 or more cellular types, commonly a mixture of epithelial and mesenchymal components, which was evident in our model with areas of spindle-like, squamous, and IDC-NOS histology (Figure 4B). Patients with metaplastic breast cancer have worse outcomes and 5-year survival rates. Interestingly, this third molecular group of metaplastic carcinomas was only observed in the MYC;NeuNT model. An extended histological analysis by the pathologists of 99 MYC;NeuNT tumors supported our initial observed histologic distribution, showing that G3 tumors identified by morphology occurred at a rate of 30% in MYC;NeuNT mice, but were not observed in the NeuNT model (n = 16) (Figure 4C and Tables 2 and 3). NeuNT tumors were either of IDC-NOS or micropapillary histology, consistent with their molecular clustering into G1 and G2 by gene expression data (see Figure 4A).
Figure 4. Deregulated MYC expands intertumoral heterogeneity.
(A) Unsupervised hierarchical clustering of 14 MYC;NeuNT mammary tumors (“MycNeu”) and 4 NeuNT mammary tumors (“Neu”), as indicated, by gene RNA-Seq expression. Three main clusters emerged, marked as group 1 (G1), group 2 (G2), and group 3 (G3) tumors. Histology of the tumors is denoted by color. (B) Representative H&E images of mammary gland tumors from MYC;NeuNT and NeuNT mice used for RNA-Seq in A showing the range of observed histologies. Scale bars: 200 μm. (C) Observed frequencies of different tumor histologies in MYC;NeuNT (n = 99) and NeuNT (n = 16) mice.
Table 2. Differential protein expression in MYC;NeuNT tumor subtypes.
Table 3. Histopathology of NeuNT tumors.
Tumors unique to MYC;NeuNT have an increased epithelial-mesenchymal transition phenotype and aggressive behavior.
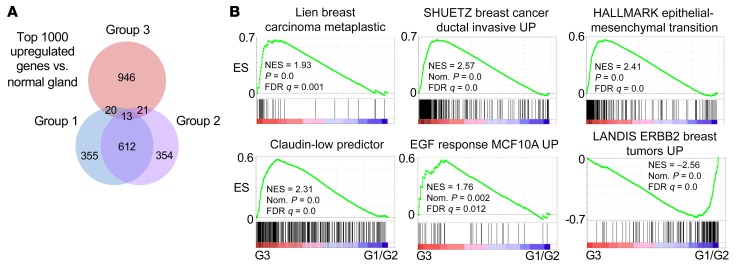
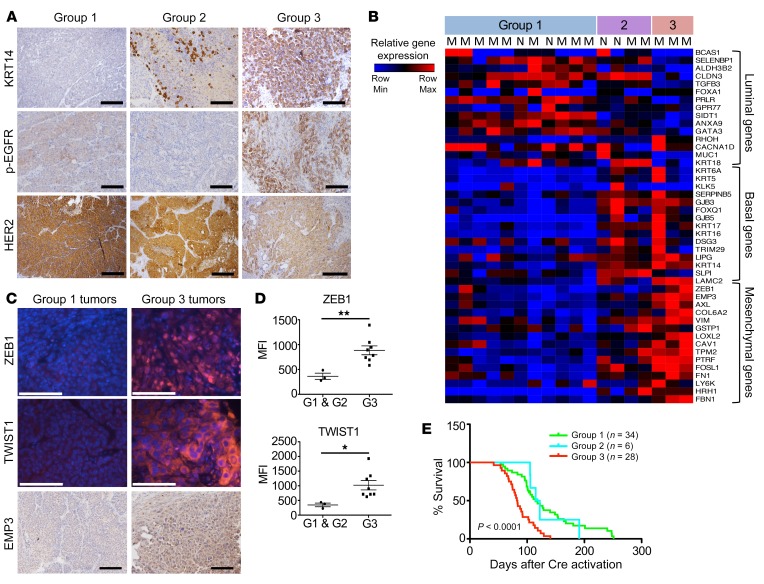
An examination of the top 1000 upregulated genes in the MYC;NeuNT tumors versus normal mammary gland revealed that G3 tumors share only 5.4% of their top upregulated genes with either G1 or G2 tumors, whereas G1 and G2 tumors share a majority of their upregulated genes (62.5% shared, Figure 5A), further supporting G3 tumors as a unique MYC-driven subgroup. We used GSEA to identify molecular pathway differences between G3 tumors and G1 and G2 tumors. Consistent with their histology, G3 tumors showed enrichment of gene sets related to human metaplastic breast carcinoma, as well as genes related to increased breast cancer invasion, epithelial-mesenchymal transition (EMT), and EGF signaling, whereas HER2 (ErbB2) signaling was found to be reduced compared with G1 and G2 tumors (Figure 5B and Supplemental Figure 4A). Consistent with enrichment of EMT-related genes, gene sets related to ZEB1, Snail, and TGF-β signaling were also enriched (Supplemental Figure 4B). IHC also revealed that G3 tumors had increased basal marker staining including cytokeratin 14 (KRT14), as well as showing higher levels of phosphorylated EGF receptor (p-EGFR) staining (Figure 6A and Table 2). While still positive for HER2, G3 tumors generally showed less robust HER2 staining than G1/G2 tumors, consistent with GSEA results showing enrichment of HER2 signaling genes in G1/G2 tumors compared with G3 tumors (Figure 5B, Figure 6A, and Table 2). NeuNT tumor IHC was consistent with their G1 or G2 molecular and histologic features, including low p-EGFR (Supplemental Figure 4C and Table 3).
Figure 5. Group 3 MYC;NeuNT tumors show distinct gene expression.
(A) Venn diagram showing the overlap of the top 1000 upregulated genes in each tumor group versus normal mammary gland. (B) GSEA results comparing gene sets related to breast tumor behavior and signaling between G3 and G1/G2 MYC;NeuNT tumors. See Supplemental data set 2 for full GSEA results. ES, enrichment score; NES, normalized ES.
Figure 6. Group 3 MYC;NeuNT tumors are phenotypically and functionally distinct.
(A) Representative IHC images of cytokeratin 14 (KRT14), p-EGFR, and HER2 in the 3 different MYC;NeuNT tumor groups. Scale bars: 100 μm. See Table 2 for full data set summary. (B) A heatmap comparing expression of 45 lineage-correlated genes in tumors from the 3 groups, including 15 luminal genes, 15 basal/myoepithelial genes, and 15 mesenchymal genes. MYC;NeuNT tumors are marked with an “M”; NeuNT tumors with an “N.” (C) Representative immunofluorescence and IHC images showing ZEB1, TWIST1, and EMP3 in G1 (n = 3) and G3 (n = 8) tumors. Scale bars: 100 μm. (D) The average mean fluorescence intensity (MFI) for ZEB1 and TWIST1 expression in MYC;NeuNT G1 (n = 3) and G3 (n = 8) tumors. Asterisks denote significant differences in MFI: *P < 0.05, **P < 0.01, 2-tailed Student’s t test. (E) Kaplan-Meier plot comparing overall survival between the 3 groups of MYC;NeuNT tumors, and an estimator of significance comparing G3 with G1/G2 tumors, P < 0.0001.
To better understand the difference in tumor cell states among these molecular groups, and the contribution of deregulated MYC to unique tumor cell identity, we examined the expression of 45 genes related to different differentiation states that have been shown to be enriched in luminal, basal, or mesenchymal differentiated breast cancer cell lines (55–59), using a publicly available gene expression data set (60). A heatmap comparing expression of these 45 genes across all transcriptionally profiled MYC;NeuNT tumors revealed that G1 tumors are marked by high levels of luminal gene expression, with low basal and mesenchymal gene expression (Figure 6B). G2 tumors showed mixed expression of all 3 lineages, whereas G3 tumors were marked by low luminal gene expression and high levels of mesenchymal gene expression, including both strong ZEB1 expression and high expression of some basal genes, including KRT14 (Figure 6B). We examined the expression of some of these EMT markers by immunofluorescence and found that consistent with the gene expression data, G3 tumors expressed higher protein levels of ZEB1 and TWIST1, and stronger IHC staining for the epithelial cell–specific EMT marker EMP3 (Figure 6, C and D). Furthermore, G3 tumors were functionally distinct from the other groups with regard to tumor-associated mortality and showed a significantly reduced survival to study endpoint compared with mice bearing the G1 or G2 tumors (Figure 6E). Together, these data suggest that the deregulated MYC expressed in this model can promote the development of a distinct subtype of NeuNT tumors that possess unique pleiomorphic and metaplastic histology, increased basal and mesenchymal differentiation, high EGFR signaling, and reduced overall survival (Figure 6E).
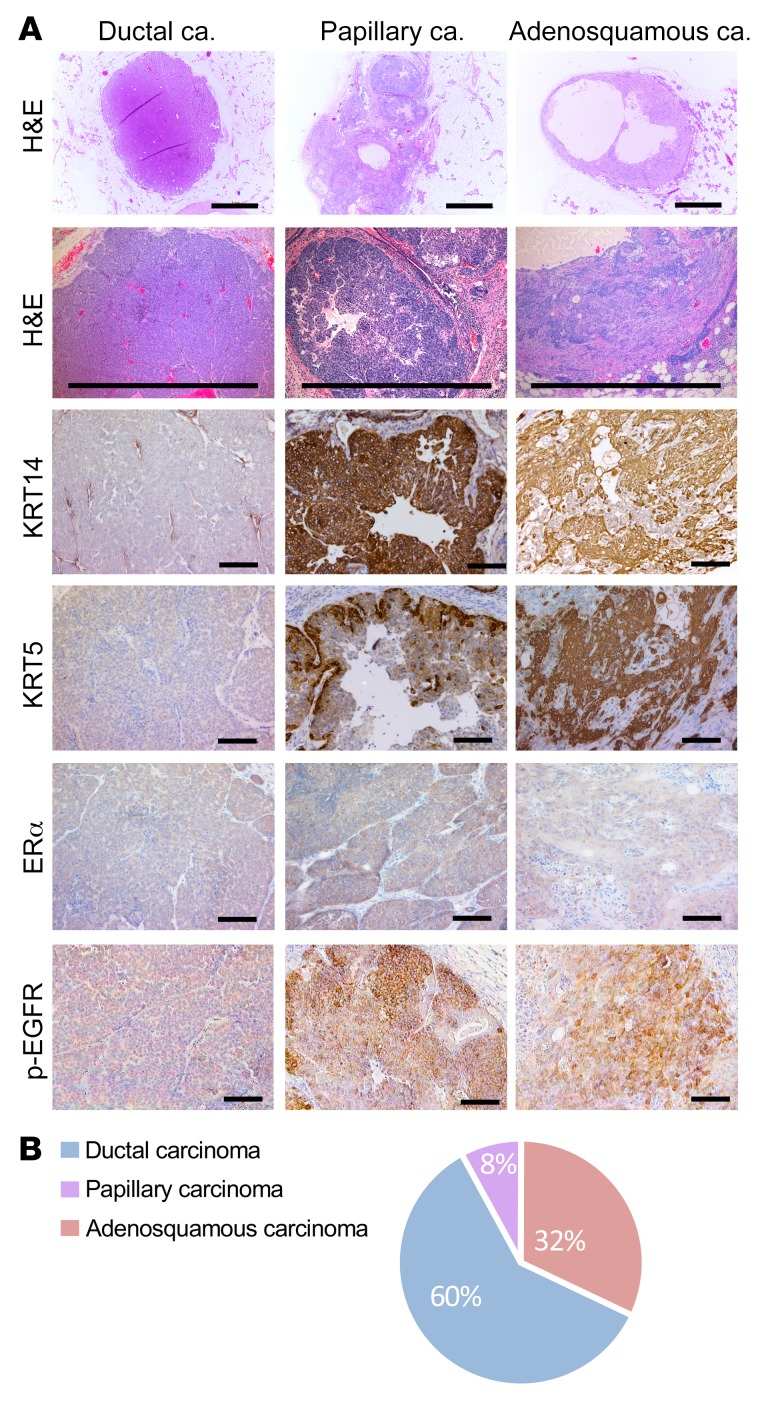
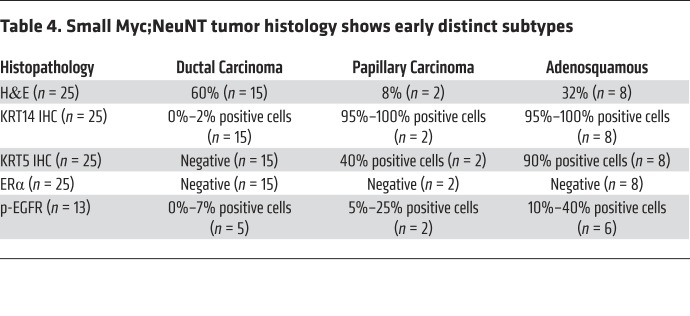
We next sought to determine whether the mesenchymal subtype (G3) arose via progression from a more epithelial subtype or if it initiated as a distinct tumor phenotype. To test this, we examined the phenotypes of 25 small (2–3 mm diameter) tumors, examining tumor histology and KRT14, cytokeratin 5 (KRT5), and p-EGFR expression. This analysis revealed that even at an early stage, a subset of MYC;NeuNT tumors had a distinct metaplastic histology, with squamous and mesenchymal areas and high expression of the basal KRT14, KRT5, and p-EGFR markers (Figure 7A and Table 4). Further, the distribution of early-lesion histologies matched that of later-progressed tumors (Figure 7B and Table 4). These data suggest that the addition of low constitutive MYC expression to the NeuNT model promotes the initiation of a third histologic subtype, where subtype features are present within preinvasive lesions, similar to the human disease (61, 62). This model may therefore provide a unique resource to examine early events that generate distinct HER2+ERα– breast cancer subtypes.
Figure 7. Small tumors recapitulate phenotypes observed in late tumors.
(A) Representative H&E images and IHC for KRT14, KRT5, ERα, and p-EGFR in small tumors (diameter < 4 mm) from MYC;NeuNT mice, n = 25. Three recurrent histologies were observed and 3 distinct patterns of KRT14, KRT5, ERα, and p-EGFR expression. Scale bars: 1 mm (H&E) and 100 μm (IHC). (B) Pie chart showing the frequency of different histologies in 25 small tumors from MYC;NeuNT mice. See Table 4 for data set summary.
Table 4. Small Myc;NeuNT tumor histology shows early distinct subtypes.
MYC;NeuNT molecular groups are observed in human HER2+ER– tumors.
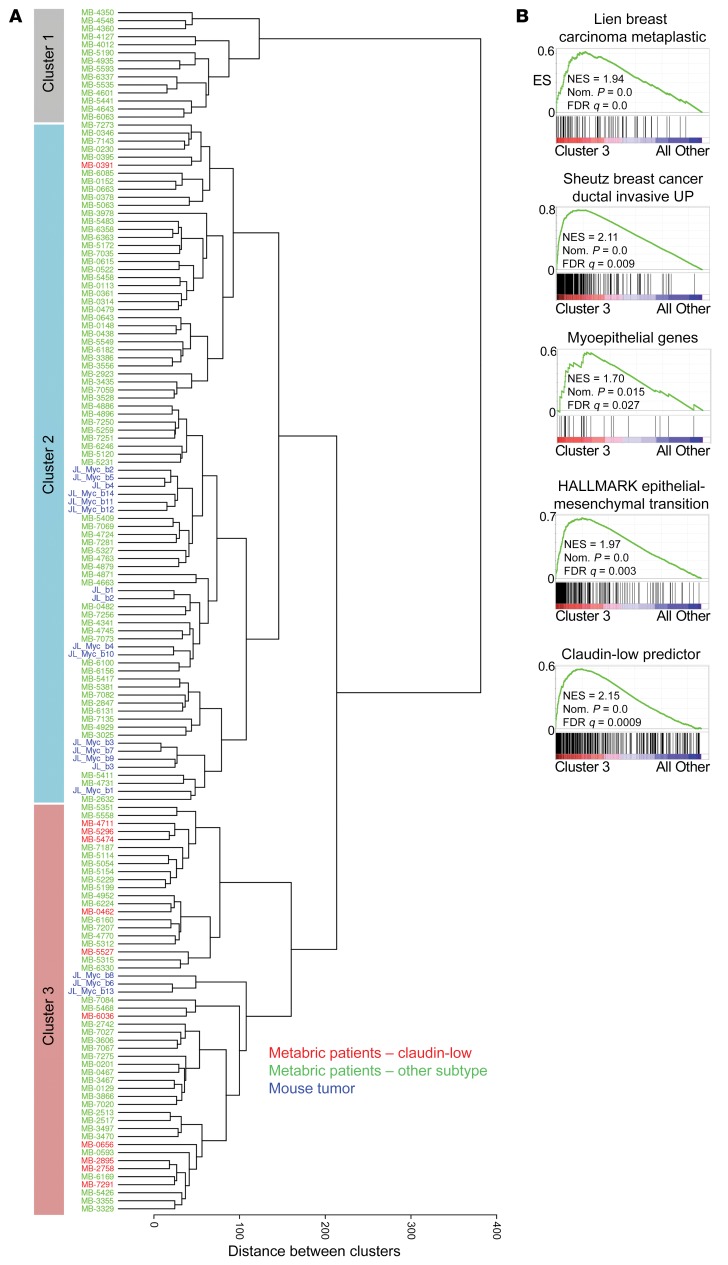
We next examined whether the intertumoral heterogeneity observed in our mouse model is representative of subgroups of human HER2+ breast cancer observed in the patient population. We focused on HER2+ER– patient tumors because of the lack of ER expression in our mouse model (see Figure 3F). We obtained gene expression data for 133 HER2+ER– primary patient tumors from the METABRIC breast cancer study (52) and normalized this gene expression to our mouse model expression data using ComBat (63). Unsupervised clustering of these normalized data resulted in the mouse tumors distributing with the human samples in 2 of the 3 main human tumor clusters that emerged (Figure 8A). Interestingly, this clustering separated G3 MYC;NeuNT tumors from G1/G2 tumors, with the G3 tumors clustering with a distinct set of human tumors that contained the majority of the claudin-low-subtype tumors. This subtype is marked by pronounced mesenchymal gene expression including vimentin and EMT-promoting genes. Demonstrating that these markers and the claudin-low subtype are enriched in both the G3 murine tumors and the cluster 3 human tumors supports the unique phenotypic identity of these tumor subsets. Further, claudin-low tumors are enriched for metaplastic histology, a younger age of onset, higher tumor grade, large tumor size, more extensive lymphocytic infiltrate, and importantly, worse overall survival (64), further correlating with our G3 MYC;NeuNT tumors.
Figure 8. Myc;NeuNT molecular groups are observed in human HER2+ER– tumors.
(A) Unsupervised clustering of 133 HER2+ER– primary patient tumors from the METABRIC study (green, red) and 18 MYC;NeuNT and NeuNT tumors (blue) using ComBat-normalized gene expression data and subsequent WARD clustering. Three major clusters are labeled as cluster 1, cluster 2, and cluster 3, with red text marking patients with a claudin-low subtype designation. (B) GSEA results examining gene sets related to breast tumor behavior and subtype, comparing cluster 3 and cluster 1/2 tumors. See Supplemental data set 2 for complete GSEA results. ES, enrichment score; NES, normalized ES.
Additional analysis of the third human HER2+ER– molecular cluster with GSEA, using a set of 57 breast phenotype–related gene sets and gene sets in the MsigDB C2 (51) (Supplemental data set 2) revealed similar enrichments to those observed in the G3 MYC;NeuNT mouse tumors (see Figure 5B and Supplemental Figure 4A), including pathway enrichment relating to invasive breast carcinoma, metaplastic breast carcinoma, EMT, and basal (myoepithelial) gene expression (Figure 8B and Supplemental Figure 5A). Similar to G3 mouse tumors, human tumors in cluster 3 showed enrichment of gene sets related to the claudin-low subtype. These characteristics align with the aggressive G3 MYC;NeuNT tumor behavior, supporting the accurate modeling of cluster 3 human HER2+ER– tumors, which are enriched for claudin-low subtype designations. We compared overall survival between patients from the 3 major clusters of HER2+ER– tumors, but observed no significant differences in outcome (Supplemental Figure 5B), which may be confounded by different patient treatment histories.
MYC;NeuNT intertumor heterogeneity allows evaluation of subgroup-specific therapeutic responses.
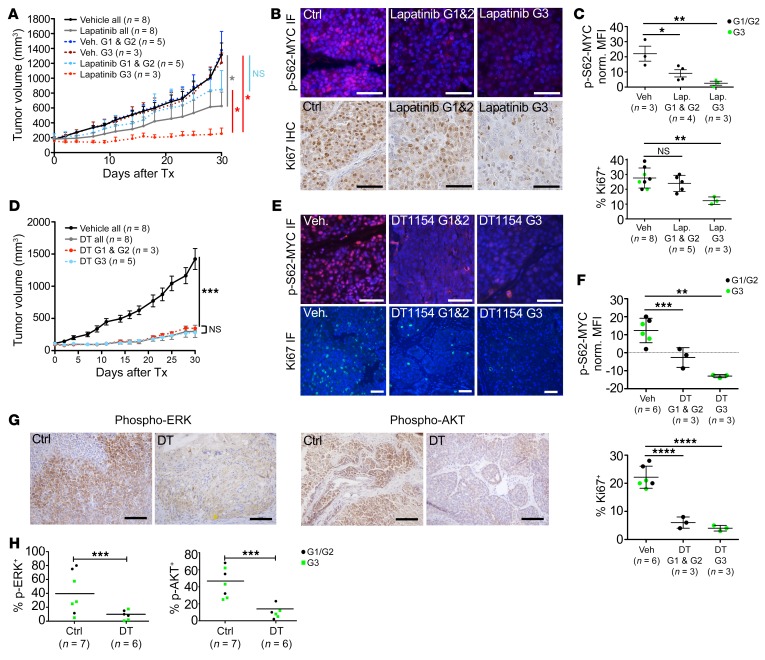
We were interested to see if subgroup-specific responses to targeted therapy existed in the MYC;NeuNT model. We evaluated MYC;NeuNT tumor response to the HER2/EGFR–targeted kinase inhibitor lapatinib. We followed a modified protocol from Spector et al. in which they demonstrated that continuous b.i.d. dosing of 100 mg/kg lapatinib could achieve an 18 μM peak plasma concentration (65). In a phase I study of lapatinib, 13 μM plasma concentration was achieved in patients by 500 mg b.i.d. dosing (study EGF10027, https://clinicaltrials.gov/ct2/show/NCT00359190). We reduced the dosing schedule from b.i.d. to daily administration in order to reduce toxicity and to reduce peak plasma concentrations toward those observed in patients. Tumor-bearing mice were enrolled when tumors reached 100 mm3 and treated daily with 100 mg/kg lapatinib or vehicle for 30 days, at which point histological analysis was used to designate each tumor’s histologic subgroup. We found that G3 tumors, marked by metaplastic and/or pleiomorphic histology and higher EGFR signaling, had significantly better responses to lapatinib compared with G1 and G2 tumors, whereas no significant differences in growth rate were observed between these groups under vehicle treatment (Figure 9A). Response to lapatinib was associated with reduced MYC phosphorylation at Ser62, which was observed in all tumors but most pronounced in G3 tumors (Figure 9, B and C). Consistent with the enhanced efficacy of lapatinib in G3 tumors, a significant reduction in Ki-67 staining was observed in G3 tumor cells compared with vehicle control–treated mice, and compared with G1/G2 tumors, which showed no significant differences in Ki-67 positivity versus vehicle control (Figure 9, B and C).
Figure 9. Subtype-specific responses to therapy are overcome by MYC-targeted agents.
(A) Graph showing the change in tumor volume in MYC;NeuNT tumors over 30 days of treatment (Tx) with lapatinib or vehicle, using endpoint histological analysis to determine tumor molecular group (G1, G2, and G3; see Figure 2A). Asterisks denote significant differences in tumor volume (n shown on graph): *P < 0.05, 2-tailed Student’s t test. NS, not significant. (B) Representative immunofluorescence (IF) images of p-S62-MYC expression in MYC;NeuNT tumors after lapatinib or vehicle treatment (top) and IHC staining for Ki-67 in MYC;NeuNT tumors (bottom); n and quantification indicated in C. Scale bars: 50 μm. (C) Plots showing MFI for p-S62-MYC (top) and percentage Ki-67+ cells (bottom) in lapatinib-treated versus vehicle-treated MYC;NeuNT tumors, separating G3 tumors (green) from G1/G2 tumors (black) based on endpoint histology. Asterisks denote significant differences in cell MFI/Ki-67+ (n shown on plot): **P < 0.01, *P < 0.05, 1-way ANOVA corrected for multiple comparisons. (D) Graph showing MYC;NeuNT tumor volume over time following treatment with DT1154 (DT, 100 mg/kg b.i.d.) or vehicle for 30 days. Asterisks denote significant differences in tumor volume comparing DT1154-treated tumors to vehicle: ***P < 0.001, 2-tailed Student’s t test. (E) Representative immunofluorescence images of p-S62-MYC and Ki-67 in MYC;NeuNT tumors after DT1154 or vehicle treatment. Scale bars: 50 μm. (F) Plots showing MFI for p-S62-MYC (top) and percentage Ki-67+ cells (bottom) comparing DT1154- versus vehicle-treated MYC;NeuNT tumors, comparing groups as in C. Asterisks denote significant change in MFI/Ki-67+ (n shown on plot): **P < 0.01, ***P < 0.001, ****P < 0.0001, 1-way ANOVA corrected for multiple comparisons. (G) Representative IHC for p-ERK and p-AKT in MYC;NeuNT tumors after DT1154 or vehicle treatment, n = 6–7. Scale bars: 100 μm. (H) Plot showing the percentage of p-ERK– and p-AKT–positive cells in tumors following DT1154 and vehicle treatment. Tumor groups are marked by color as in C. Asterisks denote significant differences in positive cell frequency (n shown on plot): ***P < 0.001, 2-tailed Student’s t test.
Pharmacological activation of PP2A overcomes subgroup-specific therapeutic responses.
The differential responses to lapatinib observed among MYC;NeuNT tumor groups speak to the unique pathway activity and regulatory network structure between these distinct molecular groups of HER2+ER– mammary tumors and highlight the challenge that intertumoral heterogeneity presents to the successful use of targeted therapeutics. We reasoned that such subgroup-specific sensitivities may be circumvented by the simultaneous downregulation of multiple oncogenic signaling pathways. While combinations of kinase inhibitors can theoretically achieve this endpoint, such strategies often elicit high toxicity, limiting their use. Our group has pursued an alternative approach to this problem though the pharmacological reactivation of protein phosphatase 2A (PP2A). PP2A inactivation is found in many cancers, including breast cancer, where its role of dephosphorylating and downregulating the activity of kinases and oncogenes involved in cell survival and proliferation is lost, supporting the malignant state. In particular, dephosphorylation of AKT, ERK, and MYC is carried out by PP2A, which promotes the degradation of MYC via the proteasome (66, 67). We hypothesized that using a new small-molecule activator of PP2A (SMAP) (68, 69), DT1154, may decrease S62-MYC phosphorylation while simultaneously downregulating other oncogenic pathways, providing therapeutic benefit in the MYC;NeuNT model. We treated tumor-bearing MYC;NeuNT mice with the SMAP, DT1154 (100 mg/kg b.i.d. by oral gavage for 30 days), and found that all MYC;NeuNT tumor subtypes robustly responded to DT1154 (Figure 9D) at doses far below the published maximum tolerated dose in mice (>800 mg/kg) (68, 70). In all tumors, DT1154 significantly downregulated p-S62-MYC levels and significantly reduced Ki-67 positivity, with no significant differences in these biomarkers between G1/G2 and G3 tumors (Figure 9, E and F). Further, DT1154 substantially attenuated the expression of p-AKT and p-ERK by IHC in DT1154-treated tumors compared with vehicle-treated controls (Figure 9, G and H). Together, these data suggest that PP2A activation and the simultaneous inhibition of MYC and other oncogenic signaling pathways may represent an effective strategy to inhibit HER2+ tumor growth independently of HER2+ tumor phenotype.
Discussion
Breast cancer is a heterogeneous disease with profound differences between patient tumors. Even within tumor subtypes defined by receptor expression, such as amplified-HER breast cancer, we still observe intertumoral heterogeneity in tumor phenotype. These differences can underlie patient variability in therapeutic response, making the modeling of these differences critical to the advancement of our therapeutic management of breast cancer. Resistance to HER2-targeted therapy is still prevalent in the patient population (71), and while some mechanisms leading to intrinsic resistance of amplified-HER breast cancers to HER2-targeted agents have been uncovered (72–74), much remains to be understood about the path to both intrinsic and acquired therapeutic resistance. A limitation of this field has been a lack of in vivo models that recapitulate the full molecular and biological characteristics of amplified-HER breast cancer. Most murine models have relied on overexpression of Neu, the murine homolog of HER2, or the expression of a constitutively active mutant of Neu, NeuNT. These models have provided critical discoveries in this field; however, many of these models do not represent the molecular complexity of the human disease. For example, genomic amplification of MYC often occurs concomitantly with HER2 amplification in tumors and at a higher rate than in non–amplified-HER tumors (5, 25, 29). Our generation of the Rosa-LSL-Myc;LSL-NeuNT;Blg-Cre mouse described in this work reveals insights into how deregulation of MYC, with constitutive transcription such as likely occurs with inflammatory signaling from the microenvironment or amplification, and HER2 can cooperate in vivo to generate HER2+ tumors with unique tumor phenotype and behavior. Compared with their NeuNT counterparts, tumors with deregulated MYC in conjunction with NeuNT showed unique histology, signaling and differentiation pathway enrichment, and unique tumor behavior, including differential responses to targeted therapeutics.
Signaling through HER2 is propagated by the MAPK and PI3K pathways, which maintain an active Ser62-phosphorylated form of MYC. ERK directly phosphorylates this site, and PI3K-driven inhibition of GSK3 further stabilizes p-S62-MYC through suppression of threonine 58 phosphorylation and subsequent Ser62 dephosphorylation (75). Consistent with these observations, we demonstrate in cell culture that upregulation of Neu is sufficient to increase MYC Ser62 phosphorylation, total MYC levels, and MYC half-life in breast epithelial cells, similar to Jin et al., who demonstrated that HER2 upregulation in cell lines enhances the phosphorylation of this MYC residue (43). This signaling relationship is also evident in patient tumors, where we show that enhanced p-S62-MYC staining is observed in HER2+ tumors compared with adjacent normal gland controls. Furthermore, in a large HER2+ tumor TMA, we demonstrate on a single-cell level that higher expression of HER2 in tumor cells significantly correlates with higher frequencies of p-S62-MYC positivity. Functionally, we also observed higher Ki-67 positivity in these higher-HER2-expressing and p-S62-MYC–positive tumor cells, suggesting this HER2/MYC signaling axis supports a more proliferative phenotype.
We investigated the cooperation between these oncogenes in vivo by crossing the NeuNT model with our mice harboring inducible physiologic-level, deregulated MYC expression (Rosa-LSL-Myc). These MYC;NeuNT mice showed higher levels of MYC Ser62 phosphorylation in the pretumor mammary glands compared with nontumorigenic Rosa-LSL-Myc;Blg-Cre mice in the normal mammary gland, and substantially enhanced the aggressiveness of resulting mammary tumors relative to the NeuNT;Blg-Cre model. MYC;NeuNT mice rapidly developed detectable tumors, some within a week of Cre activation. These observations align with a recent study examining the cooperation of MYC and Neu overexpression in tumor allografts (27), which similarly showed accelerated tumorigenesis and enhanced penetrance in mice bearing transgenic cells overexpressing both MYC and Neu compared with mice bearing cells with either oncogene alone.
Beyond the effects on tumor initiation and aggressiveness, we observed that deregulated MYC could affect tumor phenotype. MYC;NeuNT tumors had increased intertumoral heterogeneity, generating a unique recurring tumor identity that was not observed in NeuNT mice. This distinct subgroup was marked by metaplastic histology, mesenchymal differentiation, and increased levels of basal cytokeratin expression and EGFR signaling. Gene expression analysis revealed increased expression of genes related to EMT, breast cancer invasiveness, and relatedness to adult mammary stem cells. These findings are similar to increases in cancer stem cell–related genes and mesenchymal genes observed by Nair et al. (27) in tumors generated from mammary epithelial cells transformed with MYC- and Neu-encoding retroviruses. Unlike their transplant model, our spontaneous genetically engineered mouse model allows for intertumoral heterogeneity and offered the unique ability to observe tumor phenotypes at early stages. Analysis of early-stage tumors by histology and basal cytokeratin staining demonstrated that even from early time points, intertumoral heterogeneity was observed and a unique subset of MYC;NeuNT tumors developed with metaplastic histology and high basal marker expression. These results indicate that a distinct evolutionary path of tumor development can be initiated at early time points due to the combination of deregulated MYC with HER2. We observed worse overall survival in MYC;NeuNT mice compared with NeuNT alone, particularly with the aggressive G3 tumors. Importantly, these G3 tumors showed strong relatedness to a subset of HER2+ER– patient tumors, which were similarly defined by gene set enrichment relating to invasive breast cancer, EMT, the claudin-low molecular subtype, and metaplastic morphology.
We have used this model to begin to understand the therapeutic implications of intertumoral heterogeneity in amplified-HER breast cancer, enabling us to better identify therapeutics that can manage all HER2+ subtypes. In support of this, we show that the different MYC;NeuNT tumor subgroups have differential sensitivity to the EGFR/HER2–targeting agent lapatinib, whereas an orthogonal therapeutic approach by targeting multiple oncogenic pathways using a SMAP allows for ubiquitous inhibition of all subgroups. Reduced PP2A activity is a frequent observation in the majority of cancers (24, 48, 76), and activated PP2A has the potential to reverse the oncogenic kinase–driven signals that promote cancer development and maintenance (77, 78). We demonstrate here that MYC;NeuNT tumors are sensitive to the SMAP DT1154 (68, 69), which not only decreased MYC Ser62 phosphorylation, but also downregulated the expression of p-ERK and p-AKT, resulting in the attenuation of tumor growth in all cases. DT1154 has been shown to be well tolerated in animals (maximum tolerated dose > 800 mg/kg/d) with no observable toxicities in numerous studies with effective antitumor doses (68, 70). The presented efficacy of this drug in our aggressive MYC/HER2 tumor model, and its previously demonstrated safety, make this first-in-class small-molecular activator of the tumor suppressor PP2A phosphatase an exciting therapeutic for clinical development for the treatment of breast cancer.
Together our findings reveal the critical effector role that MYC plays in HER2+ breast cancer. This genetically engineered mouse model of HER2+ER– breast cancer allows for improved modeling of the intertumoral heterogeneity in the patient population, modeling how different tumor subtypes respond to therapy and how tumor phenotype evolves from early stages. Further, the advantages of this model allowed us to identify a strategy for pharmacological activation of PP2A that may be a powerful tool to combat aggressive tumors with deregulated MYC and HER2.
Methods
Cell lines and patient samples.
MCF10A-Ctrl, MCF10A-Neu8142, MCF10A-TR-MYC (23), and MCF10A-TR-MYC-Neu8142 stable cell lines were generated and cultured as described in the supplemental material. Deidentified patient-matched normal and breast cancer samples were obtained from the OHSU Cancer Pathology Shared Resource (IRB approval 6478) with the help of Megan Troxell (Department of Pathology).
Antibodies.
Antibodies used in this study included those against HER2 (Cell Signaling Technology, 2242, 1:50); cytokeratin 14 (Covance, PRB-155P, 1:1000); cytokeratin 5 (Abcam, ab52635, 1:100); ERK1/2 (Cell Signaling Technology, 4695, 1:250); p-ERK1/2 (Cell Signaling Technology, 4370, 1:400); ERα (Millipore, 04-227, 1:50); Ki-67 (NCL-Ki67P, 1:1000); p-EGFR (Cell Signaling Technology, 3777, 1:200); p-AKT (Cell Signaling Technology, 4060, 1:50); MYC N262 (Santa Cruz Biotechnology, sc-764, 1:1000); MYC Y69 (Abcam, ab32072, 1:1000); V5 (Invitrogen, R-960-25); monoclonal p-S62-MYC (for Western analysis; BioAcademia, E71-161, 1:1000), ZEB1 (Santa Cruz Biotechnology, sc-515797, 1:50); Twist1 (Santa Cruz Biotechnology, sc-15393, 1:50); and EMP3 (antibodies-online.com, ABIN758600, 1:100). Generation of the polyclonal p-S62-MYC used in immunofluorescence has been described previously (66) and was used at 1:50 dilution. Antibodies for cyclic immunofluorescence were cytokeratin 19 (Biolegend, 628502, clone A53-B/A2), HER2 (Santa Cruz Biotechnology, sc-33684, clone Neu 3B5), and Ki-67 (Cell Signaling Technology, 9027, clone D2H10).
Western blots and MYC half-life.
Western blots were performed as previously described (12, 23, 66). Immunoblots were visualized via Odyssey Infrared Imager (LI-COR) that can simultaneously detect Fluor 680 and IRDye 800 secondary antibodies (LI-COR). Quantification of Western blots was done using LI-COR Odyssey Infrared software version 1.2, which is linear over 4 orders of magnitude. Western blots shown are representative of 2–3 independent experiments. For MYC half-life studies, MCF10A-Ctrl and MCF10A-Neu8142 cells were infected with Ad-Myc for 18 hours and then treated with 10 mg/mL cycloheximide in unison, and cell lysates were collected at 15, 30, 45, and 70 minutes. Ad-MYC protein level at each time point was then analyzed by Western blot. Best-fit lines for MYC abundance over time were calculated in Microsoft Excel using an exponential equation, allowing for MYC half-life determination.
Quantitative PCR.
For qRT-PCR, total RNA was isolated using TRIzol reagent (Invitrogen) and DNase I treated and purified using an RNeasy Mini Kit (Qiagen). cDNAs were made using a High-Capacity cDNA Reverse Transcription Kit (Applied Biosystems) with random primers. For qPCR of genomic DNA, total DNA from mouse tumors was isolated and purified using a DNeasy Mini Kit (Qiagen). Primers for qPCR are described in the supplemental material.
H&E staining, immunofluorescence, and IHC.
H&E staining, immunofluorescence, and IHC were performed as described previously (33). For image quantitation, areas of high tumor cellularity were imaged and the fluorescence density of 250 random tumor cells spanning the image area was measured using Open-Lab 5.5 software, with mean fluorescence intensity (MFI) displayed, or the percentage of positive cells for a given marker were counted and frequency of positivity displayed. For the analysis of p-S62-MYC in individual patient samples, positive signal was considered as levels greater than 2 times the mean nuclear intensity observed in secondary antibody–only controls. We analyzed p-S62-MYC levels in 4 HER2+ patient FFPE samples, 2 of which had adjacent normal glands that were independently selected by a pathologist from the OHSU biobank, with researchers blinded to the selection process.
TMA cyclic immunofluorescence and analysis.
The HER2+ breast cancer patient TMA (BR1506) was obtained from Biomax US and deparaffinized and rehydrated by standard procedures (33). Heat-mediated antigen retrieval was performed through incubation with pH 6 citrate buffer and then pH 9 Tris/EDTA buffer in a preprogrammed pressure cooker (Biocare Medical). The tissue was then blocked with 10% normal goat serum (Vector Laboratories) and 1% BSA in PBS for 30 minutes at room temperature and incubated with anti–p-S62-MYC for 2 hours at room temperature. The slide was then washed and incubated with goat anti-rabbit Alexa Fluor 594 for 1 hour, protected from light. After washing, the slide was mounted in Slowfade Gold DAPI (Thermo Fisher Scientific) and scanned on a Zeiss Axioscan Z1, imaging each TMA core at ×20 original magnification. The coverslip was removed in PBS, and fluorescent signal was then quenched in 3% hydrogen peroxide solution (79). The tissue was washed and incubated with a directly labeled antibody mix against CK19 (Biolegend), HER2 (Santa Cruz Biotechnology), and Ki-67 (Cell Signaling Technology). Resulting images were then registered using Zeiss ZEN Blue software, exporting TIFFs of individual channels for each scene of TMA core. Each TIFF image was then uploaded into CellProfiler for single-cell analysis as previously described (59). Briefly, DAPI signal was smoothed and used for primary object detection using the adaptive thresholding Otsu method. Nuclei were then expanded using a fixed pixel distance to generate a total cell area mask for single-cell measurement of marker expression. Fcs files of single-cell expression of each marker and cell shape and area were exported for each TMA core. Image cytometry was performed in Cytobank software, first identifying intact cells of a minimal area and DAPI intensity, and then gating for positivity of each marker and low, medium, and high expression of HER2 as shown in Supplemental Figure 2. Patient cases missing from the TMA were dropped from the analysis, along with tumors with profound tissue folding or autofluorescence issues. For the comparison of p-S62-MYC expression in tumors we restricted our analysis to tumors that passed the above criteria and had at least 200 CK19+ tumor cells and p-S62-MYC positivity in either the tumor or stromal fractions (71 of 75 HER2+ cases). For the analysis of p-S62-MYC between HER2hi, HER2med, and HER2lo populations, we restricted our analysis to tumors to those that met the above criteria and also had at least 2% HER2hi plus HER2med tumor cells (67 of 75 HER2+ cases). All case information including patient clinical data is presented in Supplemental data set 1.
RNA-Seq and gene expression analyses.
RNA-Seq libraries were constructed using an NEBNext Ultra Directional RNA Library Prep Kit for Illumina (New England BioLabs) and then sequenced on an Illumina HiSeq at the OHSU Massively Parallel Sequencing shared resource. Gene expression reads per kilobase of transcript, per million mapped reads (RPKM), were calculated for all genes. For hierarchical clustering, we performed Voom (80) normalization on tumor samples using all genes, then reduced them to unique gene symbols and used Ward’s clustering to identify tumor subgroups. The genes identified as enriched in luminal, basal, or mesenchymal cell lines were identified by analyzing publically available gene expression data from a study examining 84 breast cancer cell lines, including 21 amplified-HER2 lines (60). This data set has cell lines covering all molecular subtypes and cellular differentiation, providing a powerful tool to identify genes preferentially expressed in specific differentiation states. Select luminal, basal, and mesenchymal gene sets were also presented, encompassing the most subtype-specific genes expressed in luminal, basal, and mesenchymally differentiated human cell lines, respectively (55–58). Patient gene expression data were acquired from the METABRIC (81) study, using the accompanying clinical data to identify HER2 and ER status, patient subtype, and survival information. Human gene expression data were normalized with the MYC;NeuNT mouse model gene expression data using ComBat normalization (63). Ward’s clustering was used to identify tumor subgroups. All raw RNA-Seq files can be found in the National Center for Biotechnology Information’s Gene Expression Omnibus repository under the accession GSE132528 (https://www.ncbi.nlm.nih.gov/geo/query/acc.cgi?acc=GSE132528).
GSEA.
GSEA for the murine models was performed using GSEA V2.2.0 (82) (Broad Institute) with a preranked gene list of tumor RPKM RNA-Seq data, comparing average gene expression between MYC;NeuNT tumors and adjacent normal, or between molecular subgroups of tumors. Patient gene expression data were acquired from TCGA (83) and tumors from HER2+ or amplified-HER tumors with ER negativity were compared using standard GSEA on default setting. Analyzed gene sets were from the MsigDB oncogenic signatures gene set collection (C6), curated gene set collection (C2), or hallmark (H) collection, found at www.broadinstitute.org/gsea/msigdb/collections.jsp As well, previously compiled databases of breast phenotype–related gene sets and lineage-determinant transcription factor gene sets were used (59). These gene sets and all GSEA results are detailed in Supplemental data set 2.
Animal studies.
Rosa-LSL-Myc mice (33) were crossed with LSL-NeuNT (34) and Blg-Cre mice (gift from Owen Sansom, Beatson Institute for Cancer Research, Glasgow, United Kingdom) to obtain mice that express both MYC and NeuNT in response to Cre-mediated recombination in the mammary gland. The NeuNT and MYC;NeuNT mice analyzed in this study are all in the BL6/129S1/FVB mixed genetic background with the exception of the survival curve shown in Supplemental Figure 3C, which is pure FVB, and the tumors were all from independent animals. Tumor-bearing mice were treated with lapatinib at 100 mg/kg daily or DT1154 at 100 mg/kg b.i.d. by oral gavage for 4 weeks; tumor growth was recorded on every other day by measuring the diameter in 2 dimensions. Tumor volume was calculated using the following formula: large diameter × (small diameter)2/2. If a tumor impaired the mobility of an animal, became ulcerated, or appeared infected, or a mouse displayed hunched posture, the mouse was euthanized. Tumors were harvested and frozen for RNA and DNA analysis or embedded in paraffin for immunofluorescence or IHC.
Statistics.
Western blots were quantified using the LI-COR Odyssey Infrared software. Quantification of fluorescence density was carried out using Open-Lab 5.5 software. Statistical analysis was performed using GraphPad Prism software. Measurements are presented with sample n and mean ± SD or mean ± SEM as indicated in figure legends. An unpaired 2-tailed Student’s t test was used throughout to compare 2 groups. For the comparison of p-MYC expression between tumor and nontumor fractions of patient tumors (Figure 1), Wilcoxon’s matched-pairs signed-rank test was used. A base P value less than 0.05 was considered statistically significant in all tests. To correct for multiple comparisons when 3 groups were present, 1-way ANOVA was used to determine significance, or the Kruskal-Wallis test was used if SDs significantly differed between groups by the Brown-Forsythe test or Bartlett’s test.
Study approval.
All protocols for mouse experiments described in this study were approved by the OHSU Animal Care and Use Committee protocol IP00001014, Portland, Oregon. Patient-matched normal and breast cancer samples were obtained from the OHSU Cancer Pathology Shared Resource with informed consent (IRB approval 6478).
Author contributions
TR, XW, JL, and RCS designed the study. JL, XZ, XXS, YS, and CJD performed the in vitro MYC experiments. LGC, JE, KC, and XW performed the tissue microarray staining and imaging; TR performed the tissue microarray analysis. XW performed all animal studies and in vivo drug response studies, and CVL assisted with pathological analysis. CP performed the RNA-Seq analysis and clustering, and TR generated the data presentation and performed all GSEA analyses. GN and CF supervised the PP2A pharmacological studies. EML and MSD helped guide the study design and writing. TR, XW, and RCS wrote the manuscript.
Supplementary Material
Acknowledgments
We thank Megan Troxell for providing patient FFPE samples and pathological analysis and all members of the Sears laboratory for editing the manuscript and other helpful suggestions. RNA-Seq was performed in the OHSU Integrated Genomics Laboratory and Gene Profiling Shared Resource, supported by OHSU Knight Cancer Institute NIH grant P30 CA69533. This study was supported by NIH grants R01 CA100855, R01 CA129040, U54 CA209988, R41 CA165318 (to RCS), R01 CA186241 (to RCS and MSD), Department of Defense grant BC103625 (to RCS), and generous gifts from the Colson Family Foundation and the Atwater Foundation (to RCS).
Version 1. 11/25/2019
Electronic publication
Version 2. 01/02/2020
Print issue publication
Footnotes
Conflict of interest: GN is chief scientific officer at RAPPTA Therapeutics, has an ownership interest (including stock, patents, etc.) in RAPPTA Therapeutics, and is a consultant/advisory board member for HERA. The Icahn School of Medicine at Mount Sinai has filed patents covering composition of matter on the small molecules disclosed herein for the treatment of human cancer and other diseases (International Application Numbers: PCT/US15/19770, PCT/US15/19764; and US Patent: US 9,540,358 B2). Mount Sinai is actively seeking commercial partners for the further development of the technology. GN has a financial interest in the commercialization of the technology. RS has an equity interest in RAPPTA therapeutics.
Copyright: © 2020, American Society for Clinical Investigation.
Reference information: J Clin Invest. 2020;130(1):231–246.https://doi.org/10.1172/JCI126390.
Contributor Information
Tyler Risom, Email: risom@ohsu.edu.
Xiaoyan Wang, Email: wangxia@ohsu.edu.
Juan Liang, Email: liangj@ohsu.edu.
Xiaoli Zhang, Email: oregon7286@gmail.com.
Carl Pelz, Email: pelzc@ohsu.edu.
Koei Chin, Email: chinkoei@ohsu.edu.
Goutham Narla, Email: gnarla@med.umich.edu.
Ellen M. Langer, Email: langere@ohsu.edu.
Xiao-Xin Sun, Email: sunx@ohsu.edu.
Yulong Su, Email: suy@mit.edu.
Mu-Shui Dai, Email: daim@ohsu.edu.
Christiane V. Löhr, Email: Christiane.Loehr@oregonstate.edu.
Rosalie C. Sears, Email: searsr@ohsu.edu.
References
- 1.Arteaga CL, Sliwkowski MX, Osborne CK, Perez EA, Puglisi F, Gianni L. Treatment of HER2-positive breast cancer: current status and future perspectives. Nat Rev Clin Oncol. 2011;9(1):16–32. doi: 10.1038/nrclinonc.2011.177. [DOI] [PubMed] [Google Scholar]
- 2.Dawood S, Broglio K, Buzdar AU, Hortobagyi GN, Giordano SH. Prognosis of women with metastatic breast cancer by HER2 status and trastuzumab treatment: an institutional-based review. J Clin Oncol. 2010;28(1):92–98. doi: 10.1200/JCO.2008.19.9844. [DOI] [PMC free article] [PubMed] [Google Scholar]
- 3.Slamon DJ, et al. Use of chemotherapy plus a monoclonal antibody against HER2 for metastatic breast cancer that overexpresses HER2. N Engl J Med. 2001;344(11):783–792. doi: 10.1056/NEJM200103153441101. [DOI] [PubMed] [Google Scholar]
- 4.Jagiello-Gruszfeld A, et al. A single-arm phase II trial of first-line paclitaxel in combination with lapatinib in HER2-overexpressing metastatic breast cancer. Oncology. 2010;79(1–2):129–135. doi: 10.1159/000318043. [DOI] [PubMed] [Google Scholar]
- 5.Perez EA, et al. Trastuzumab plus adjuvant chemotherapy for human epidermal growth factor receptor 2-positive breast cancer: planned joint analysis of overall survival from NSABP B-31 and NCCTG N9831. J Clin Oncol. 2014;32(33):3744–3752. doi: 10.1200/JCO.2014.55.5730. [DOI] [PMC free article] [PubMed] [Google Scholar]
- 6.Wang YC, et al. Different mechanisms for resistance to trastuzumab versus lapatinib in HER2-positive breast cancers--role of estrogen receptor and HER2 reactivation. Breast Cancer Res. 2011;13(6):R121. doi: 10.1186/bcr3067. [DOI] [PMC free article] [PubMed] [Google Scholar]
- 7.Bedard PL, de Azambuja E, Cardoso F. Beyond trastuzumab: overcoming resistance to targeted HER-2 therapy in breast cancer. Curr Cancer Drug Targets. 2009;9(2):148–162. doi: 10.2174/156800909787581024. [DOI] [PubMed] [Google Scholar]
- 8.Subbiah IM, Gonzalez-Angulo AM. Advances and future directions in the targeting of HER2-positive breast cancer: implications for the future. Curr Treat Options Oncol. 2014;15(1):41–54. doi: 10.1007/s11864-013-0262-4. [DOI] [PMC free article] [PubMed] [Google Scholar]
- 9.Sears R, Leone G, DeGregori J, Nevins JR. Ras enhances Myc protein stability. Mol Cell. 1999;3(2):169–179. doi: 10.1016/S1097-2765(00)80308-1. [DOI] [PubMed] [Google Scholar]
- 10.Pulverer BJ, Fisher C, Vousden K, Littlewood T, Evan G, Woodgett JR. Site-specific modulation of c-Myc cotransformation by residues phosphorylated in vivo. Oncogene. 1994;9(1):59–70. [PubMed] [Google Scholar]
- 11.Hann SR. Role of post-translational modifications in regulating c-Myc proteolysis, transcriptional activity and biological function. Semin Cancer Biol. 2006;16(4):288–302. doi: 10.1016/j.semcancer.2006.08.004. [DOI] [PubMed] [Google Scholar]
- 12.Farrell AS, et al. Pin1 regulates the dynamics of c-Myc DNA binding to facilitate target gene regulation and oncogenesis. Mol Cell Biol. 2013;33(15):2930–2949. doi: 10.1128/MCB.01455-12. [DOI] [PMC free article] [PubMed] [Google Scholar]
- 13.Meyer N, Penn LZ. Reflecting on 25 years with MYC. Nat Rev Cancer. 2008;8(12):976–990. doi: 10.1038/nrc2231. [DOI] [PubMed] [Google Scholar]
- 14.Malempati S, et al. Aberrant stabilization of c-Myc protein in some lymphoblastic leukemias. Leukemia. 2006;20(9):1572–1581. doi: 10.1038/sj.leu.2404317. [DOI] [PMC free article] [PubMed] [Google Scholar]
- 15.D’Cruz CM, et al. c-MYC induces mammary tumorigenesis by means of a preferred pathway involving spontaneous Kras2 mutations. Nat Med. 2001;7(2):235–239. doi: 10.1038/84691. [DOI] [PubMed] [Google Scholar]
- 16.Felsher DW, Bishop JM. Reversible tumorigenesis by MYC in hematopoietic lineages. Mol Cell. 1999;4(2):199–207. doi: 10.1016/S1097-2765(00)80367-6. [DOI] [PubMed] [Google Scholar]
- 17.Nesbit CE, Tersak JM, Prochownik EV. MYC oncogenes and human neoplastic disease. Oncogene. 1999;18(19):3004–3016. doi: 10.1038/sj.onc.1202746. [DOI] [PubMed] [Google Scholar]
- 18.Pelengaris S, Littlewood T, Khan M, Elia G, Evan G. Reversible activation of c-Myc in skin: induction of a complex neoplastic phenotype by a single oncogenic lesion. Mol Cell. 1999;3(5):565–577. doi: 10.1016/S1097-2765(00)80350-0. [DOI] [PubMed] [Google Scholar]
- 19.Liao DJ, Dickson RB. c-Myc in breast cancer. Endocr Relat Cancer. 2000;7(3):143–164. doi: 10.1677/erc.0.0070143. [DOI] [PubMed] [Google Scholar]
- 20.Pietiläinen T, Lipponen P, Aaltomaa S, Eskelinen M, Kosma VM, Syrjänen K. Expression of c-myc proteins in breast cancer as related to established prognostic factors and survival. Anticancer Res. 1995;15(3):959–964. [PubMed] [Google Scholar]
- 21.Pavelic ZP, et al. c-myc, c-erbB-2, and Ki-67 expression in normal breast tissue and in invasive and noninvasive breast carcinoma. Cancer Res. 1992;52(9):2597–2602. [PubMed] [Google Scholar]
- 22.Spaventi R, et al. Immunohistochemical detection of TGF-alpha, EGF-R, c-erbB-2, c-H-ras, c-myc, estrogen and progesterone in benign and malignant human breast lesions: a concomitant expression. In Vivo. 1994;8(2):183–189. [PubMed] [Google Scholar]
- 23.et al. Mechanistic insight into Myc stabilization in breast cancer involving aberrant Axin1 expression. Proc Natl Acad Sci U S A. 2012;109(8):2790–2795. doi: 10.1073/pnas.1100764108. [DOI] [PMC free article] [PubMed] [Google Scholar]
- 24.Janghorban M, et al. Targeting c-MYC by antagonizing PP2A inhibitors in breast cancer. Proc Natl Acad Sci U S A. 2014;111(25):9157–9162. doi: 10.1073/pnas.1317630111. [DOI] [PMC free article] [PubMed] [Google Scholar]
- 25.Park K, Kwak K, Kim J, Lim S, Han S. c-myc amplification is associated with HER2 amplification and closely linked with cell proliferation in tissue microarray of nonselected breast cancers. Hum Pathol. 2005;36(6):634–639. doi: 10.1016/j.humpath.2005.04.016. [DOI] [PubMed] [Google Scholar]
- 26.Perez EA, et al. C-MYC alterations and association with patient outcome in early-stage HER2-positive breast cancer from the north central cancer treatment group N9831 adjuvant trastuzumab trial. J Clin Oncol. 2011;29(6):651–659. doi: 10.1200/JCO.2010.30.2125. [DOI] [PMC free article] [PubMed] [Google Scholar]
- 27.Nair R, et al. c-Myc and Her2 cooperate to drive a stem-like phenotype with poor prognosis in breast cancer. Oncogene. 2014;33(30):3992–4002. doi: 10.1038/onc.2013.368. [DOI] [PubMed] [Google Scholar]
- 28.Al-Kuraya K, et al. Prognostic relevance of gene amplifications and coamplifications in breast cancer. Cancer Res. 2004;64(23):8534–8540. doi: 10.1158/0008-5472.CAN-04-1945. [DOI] [PubMed] [Google Scholar]
- 29.Dueck AC, et al. Impact of c-MYC protein expression on outcome of patients with early-stage HER2+ breast cancer treated with adjuvant trastuzumab NCCTG (alliance) N9831. Clin Cancer Res. 2013;19(20):5798–5807. doi: 10.1158/1078-0432.CCR-13-0558. [DOI] [PMC free article] [PubMed] [Google Scholar]
- 30.Galmozzi E, Casalini P, Iorio MV, Casati B, Olgiati C, Ménard S. HER2 signaling enhances 5′UTR-mediated translation of c-Myc mRNA. J Cell Physiol. 2004;200(1):82–88. doi: 10.1002/jcp.20012. [DOI] [PubMed] [Google Scholar]
- 31.Arnal-Estapé A, et al. HER2 silences tumor suppression in breast cancer cells by switching expression of C/EBPβ isoforms. Cancer Res. 2010;70(23):9927–9936. doi: 10.1158/0008-5472.CAN-10-0869. [DOI] [PubMed] [Google Scholar]
- 32.Neve RM, et al. Effects of oncogenic ErbB2 on G1 cell cycle regulators in breast tumour cells. Oncogene. 2000;19(13):1647–1656. doi: 10.1038/sj.onc.1203470. [DOI] [PubMed] [Google Scholar]
- 33.Wang X, et al. Phosphorylation regulates c-Myc’s oncogenic activity in the mammary gland. Cancer Res. 2011;71(3):925–936. doi: 10.1158/0008-5472.CAN-10-1032. [DOI] [PMC free article] [PubMed] [Google Scholar]
- 34.Andrechek ER, Hardy WR, Siegel PM, Rudnicki MA, Cardiff RD, Muller WJ. Amplification of the neu/erbB-2 oncogene in a mouse model of mammary tumorigenesis. Proc Natl Acad Sci U S A. 2000;97(7):3444–3449. doi: 10.1073/pnas.97.7.3444. [DOI] [PMC free article] [PubMed] [Google Scholar]
- 35.Sears R, Nuckolls F, Haura E, Taya Y, Tamai K, Nevins JR. Multiple Ras-dependent phosphorylation pathways regulate Myc protein stability. Genes Dev. 2000;14(19):2501–2514. doi: 10.1101/gad.836800. [DOI] [PMC free article] [PubMed] [Google Scholar]
- 36.Gregory MA, Qi Y, Hann SR. Phosphorylation by glycogen synthase kinase-3 controls c-myc proteolysis and subnuclear localization. J Biol Chem. 2003;278(51):51606–51612. doi: 10.1074/jbc.M310722200. [DOI] [PubMed] [Google Scholar]
- 37.Moasser MM. The oncogene HER2: its signaling and transforming functions and its role in human cancer pathogenesis. Oncogene. 2007;26(45):6469–6487. doi: 10.1038/sj.onc.1210477. [DOI] [PMC free article] [PubMed] [Google Scholar]
- 38.Galmozzi E, Casalini P, Iorio MV, Casati B, Olgiati C, Ménard S. HER2 signaling enhances 5′UTR-mediated translation of c-Myc mRNA. J Cell Physiol. 2004;200(1):82–88. doi: 10.1002/jcp.20012. [DOI] [PubMed] [Google Scholar]
- 39.Liu L, et al. Polyamines regulate c-Myc translation through Chk2-dependent HuR phosphorylation. Mol Biol Cell. 2009;20(23):4885–4898. doi: 10.1091/mbc.e09-07-0550. [DOI] [PMC free article] [PubMed] [Google Scholar]
- 40.Kim HH, Kuwano Y, Srikantan S, Lee EK, Martindale JL, Gorospe M. HuR recruits let-7/RISC to repress c-Myc expression. Genes Dev. 2009;23(15):1743–1748. doi: 10.1101/gad.1812509. [DOI] [PMC free article] [PubMed] [Google Scholar]
- 41.Gregory MA, Hann SR. c-Myc proteolysis by the ubiquitin-proteasome pathway: stabilization of c-Myc in Burkitt’s lymphoma cells. Mol Cell Biol. 2000;20(7):2423–2435. doi: 10.1128/MCB.20.7.2423-2435.2000. [DOI] [PMC free article] [PubMed] [Google Scholar]
- 42.O’Neil J, et al. FBW7 mutations in leukemic cells mediate NOTCH pathway activation and resistance to gamma-secretase inhibitors. J Exp Med. 2007;204(8):1813–1824. doi: 10.1084/jem.20070876. [DOI] [PMC free article] [PubMed] [Google Scholar]
- 43.Jin K, et al. HOXB7 is an ERα cofactor in the activation of HER2 and multiple ER target genes leading to endocrine resistance. Cancer Discov. 2015;5(9):944–959. doi: 10.1158/2159-8290.CD-15-0090. [DOI] [PMC free article] [PubMed] [Google Scholar]
- 44.Huang HL, et al. Triggering Fbw7-mediated proteasomal degradation of c-Myc by oridonin induces cell growth inhibition and apoptosis. Mol Cancer Ther. 2012;11(5):1155–1165. doi: 10.1158/1535-7163.MCT-12-0066. [DOI] [PubMed] [Google Scholar]
- 45.Selbert S, et al. Efficient BLG-Cre mediated gene deletion in the mammary gland. Transgenic Res. 1998;7(5):387–396. doi: 10.1023/A:1008848304391. [DOI] [PubMed] [Google Scholar]
- 46.Collins LC, et al. Molecular phenotype of breast cancer according to time since last pregnancy in a large cohort of young women. Oncologist. 2015;20(7):713–718. doi: 10.1634/theoncologist.2014-0412. [DOI] [PMC free article] [PubMed] [Google Scholar]
- 47.Cruz GI, et al. Hypothesized role of pregnancy hormones on HER2+ breast tumor development. Breast Cancer Res Treat. 2013;137(1):237–246. doi: 10.1007/s10549-012-2313-0. [DOI] [PMC free article] [PubMed] [Google Scholar]
- 48.Farrell AS, et al. Targeting inhibitors of the tumor suppressor PP2A for the treatment of pancreatic cancer. Mol Cancer Res. 2014;12(6):924–939. doi: 10.1158/1541-7786.MCR-13-0542. [DOI] [PMC free article] [PubMed] [Google Scholar]
- 49.Benassi B, et al. c-Myc phosphorylation is required for cellular response to oxidative stress. Mol Cell. 2006;21(4):509–519. doi: 10.1016/j.molcel.2006.01.009. [DOI] [PubMed] [Google Scholar]
- 50.Subramanian A, et al. Gene set enrichment analysis: a knowledge-based approach for interpreting genome-wide expression profiles. Proc Natl Acad Sci U S A. 2005;102(43):15545–15550. doi: 10.1073/pnas.0506580102. [DOI] [PMC free article] [PubMed] [Google Scholar]
- 51.Liberzon A, Subramanian A, Pinchback R, Thorvaldsdóttir H, Tamayo P, Mesirov JP. Molecular signatures database (MSigDB) 3.0. Bioinformatics. 2011;27(12):1739–1740. doi: 10.1093/bioinformatics/btr260. [DOI] [PMC free article] [PubMed] [Google Scholar]
- 52.Cancer Genome Atlas Network Comprehensive molecular portraits of human breast tumours. Nature. 2012;490(7418):61–70. doi: 10.1038/nature11412. [DOI] [PMC free article] [PubMed] [Google Scholar]
- 53.Prat A, Pascual T, Adamo B. Intrinsic molecular subtypes of HER2+ breast cancer. Oncotarget. 2017;8(43):73362–73363. doi: 10.18632/oncotarget.20629. [DOI] [PMC free article] [PubMed] [Google Scholar]
- 54.Lehmann BD, et al. Identification of human triple-negative breast cancer subtypes and preclinical models for selection of targeted therapies. J Clin Invest. 2011;121(7):2750–2767. doi: 10.1172/JCI45014. [DOI] [PMC free article] [PubMed] [Google Scholar]
- 55.Prat A, et al. Characterization of cell lines derived from breast cancers and normal mammary tissues for the study of the intrinsic molecular subtypes. Breast Cancer Res Treat. 2013;142(2):237–255. doi: 10.1007/s10549-013-2743-3. [DOI] [PMC free article] [PubMed] [Google Scholar]
- 56.Keller PJ, et al. Mapping the cellular and molecular heterogeneity of normal and malignant breast tissues and cultured cell lines. Breast Cancer Res. 2010;12(5):R87. doi: 10.1186/bcr2755. [DOI] [PMC free article] [PubMed] [Google Scholar]
- 57.Jones C, et al. Expression profiling of purified normal human luminal and myoepithelial breast cells: identification of novel prognostic markers for breast cancer. Cancer Res. 2004;64(9):3037–3045. doi: 10.1158/0008-5472.CAN-03-2028. [DOI] [PubMed] [Google Scholar]
- 58.Zeisberg M, Neilson EG. Biomarkers for epithelial-mesenchymal transitions. J Clin Invest. 2009;119(6):1429–1437. doi: 10.1172/JCI36183. [DOI] [PMC free article] [PubMed] [Google Scholar]
- 59.Risom T, et al. Differentiation-state plasticity is a targetable resistance mechanism in basal-like breast cancer. Nat Commun. 2018;9(1):3815. doi: 10.1038/s41467-018-05729-w. [DOI] [PMC free article] [PubMed] [Google Scholar]
- 60.Daemen A, et al. Modeling precision treatment of breast cancer. Genome Biol. 2013;14(10):R110. doi: 10.1186/gb-2013-14-10-r110. [DOI] [PMC free article] [PubMed] [Google Scholar]
- 61.Schuetz CS, et al. Progression-specific genes identified by expression profiling of matched ductal carcinomas in situ and invasive breast tumors, combining laser capture microdissection and oligonucleotide microarray analysis. Cancer Res. 2006;66(10):5278–5286. doi: 10.1158/0008-5472.CAN-05-4610. [DOI] [PubMed] [Google Scholar]
- 62.Lesurf R, et al. Molecular Features of subtype-specific progression from ductal carcinoma in situ to invasive breast cancer. Cell Rep. 2016;16(4):1166–1179. doi: 10.1016/j.celrep.2016.06.051. [DOI] [PubMed] [Google Scholar]
- 63.Johnson WE, Li C, Rabinovic A. Adjusting batch effects in microarray expression data using empirical Bayes methods. Biostatistics. 2007;8(1):118–127. doi: 10.1093/biostatistics/kxj037. [DOI] [PubMed] [Google Scholar]
- 64.Dias K, et al. Claudin-low breast cancer; clinical & pathological characteristics. PLoS One. 2017;12(1):e0168669. doi: 10.1371/journal.pone.0168669. [DOI] [PMC free article] [PubMed] [Google Scholar]
- 65.Spector NL, et al. Lapatinib plasma and tumor concentrations and effects on HER receptor phosphorylation in tumor. PLoS One. 2015;10(11):e0142845. doi: 10.1371/journal.pone.0142845. [DOI] [PMC free article] [PubMed] [Google Scholar]
- 66.Arnold HK, et al. The Axin1 scaffold protein promotes formation of a degradation complex for c-Myc. EMBO J. 2009;28(5):500–512. doi: 10.1038/emboj.2008.279. [DOI] [PMC free article] [PubMed] [Google Scholar]
- 67.Khanna A, Pimanda JE, Westermarck J. Cancerous inhibitor of protein phosphatase 2A, an emerging human oncoprotein and a potential cancer therapy target. Cancer Res. 2013;73(22):6548–6553. doi: 10.1158/0008-5472.CAN-13-1994. [DOI] [PubMed] [Google Scholar]
- 68.Sangodkar J, et al. Activation of tumor suppressor protein PP2A inhibits KRAS-driven tumor growth. J Clin Invest. 2017;127(6):2081–2090. doi: 10.1172/JCI89548. [DOI] [PMC free article] [PubMed] [Google Scholar]
- 69.Allen-Petersen BL, et al. Activation of PP2A and inhibition of mTOR synergistically reduce MYC signaling and decrease tumor growth in pancreatic ductal adenocarcinoma. Cancer Res. 2019;79(1):209–219. doi: 10.1158/0008-5472.CAN-18-0717. [DOI] [PMC free article] [PubMed] [Google Scholar]
- 70.McClinch K, et al. Small-molecule activators of protein phosphatase 2A for the treatment of castration-resistant prostate cancer. Cancer Res. 2018;78(8):2065–2080. doi: 10.1158/0008-5472.CAN-17-0123. [DOI] [PMC free article] [PubMed] [Google Scholar]
- 71.Subbiah IM, Gonzalez-Angulo AM. Advances and future directions in the targeting of HER2-positive breast cancer: implications for the future. Curr Treat Options Oncol. 2014;15(1):41–54. doi: 10.1007/s11864-013-0262-4. [DOI] [PMC free article] [PubMed] [Google Scholar]
- 72.Reim F, et al. Immunoselection of breast and ovarian cancer cells with trastuzumab and natural killer cells: selective escape of CD44high/CD24low/HER2low breast cancer stem cells. Cancer Res. 2009;69(20):8058–8066. doi: 10.1158/0008-5472.CAN-09-0834. [DOI] [PubMed] [Google Scholar]
- 73.Kataoka Y, Mukohara T, Shimada H, Saijo N, Hirai M, Minami H. Association between gain-of-function mutations in PIK3CA and resistance to HER2-targeted agents in HER2-amplified breast cancer cell lines. Ann Oncol. 2010;21(2):255–262. doi: 10.1093/annonc/mdp304. [DOI] [PubMed] [Google Scholar]
- 74.Martin-Castillo B, et al. Basal/HER2 breast carcinomas: integrating molecular taxonomy with cancer stem cell dynamics to predict primary resistance to trastuzumab (Herceptin) Cell Cycle. 2013;12(2):225–245. doi: 10.4161/cc.23274. [DOI] [PMC free article] [PubMed] [Google Scholar]
- 75.Yeh E, et al. A signalling pathway controlling c-Myc degradation that impacts oncogenic transformation of human cells. Nat Cell Biol. 2004;6(4):308–318. doi: 10.1038/ncb1110. [DOI] [PubMed] [Google Scholar]
- 76.Ruvolo PP, et al. Low expression of PP2A regulatory subunit B55α is associated with T308 phosphorylation of AKT and shorter complete remission duration in acute myeloid leukemia patients. Leukemia. 2011;25(11):1711–1717. doi: 10.1038/leu.2011.146. [DOI] [PMC free article] [PubMed] [Google Scholar]
- 77.Oaks JJ, et al. Antagonistic activities of the immunomodulator and PP2A-activating drug FTY720 (Fingolimod, Gilenya) in Jak2-driven hematologic malignancies. Blood. 2013;122(11):1923–1934. doi: 10.1182/blood-2013-03-492181. [DOI] [PMC free article] [PubMed] [Google Scholar]
- 78.Arnold HK, Sears RC. A tumor suppressor role for PP2A-B56alpha through negative regulation of c-Myc and other key oncoproteins. Cancer Metastasis Rev. 2008;27(2):147–158. doi: 10.1007/s10555-008-9128-9. [DOI] [PMC free article] [PubMed] [Google Scholar]
- 79.Lin JR, Fallahi-Sichani M, Sorger PK. Highly multiplexed imaging of single cells using a high-throughput cyclic immunofluorescence method. Nat Commun. 2015;6:8390. doi: 10.1038/ncomms9390. [DOI] [PMC free article] [PubMed] [Google Scholar]
- 80.Law CW, Chen Y, Shi W, Smyth GK. voom: Precision weights unlock linear model analysis tools for RNA-seq read counts. Genome Biol. 2014;15(2):R29. doi: 10.1186/gb-2014-15-2-r29. [DOI] [PMC free article] [PubMed] [Google Scholar]
- 81.Curtis C, et al. The genomic and transcriptomic architecture of 2,000 breast tumours reveals novel subgroups. Nature. 2012;486(7403):346–352. doi: 10.1038/nature10983. [DOI] [PMC free article] [PubMed] [Google Scholar]
- 82.Subramanian A, et al. Gene set enrichment analysis: a knowledge-based approach for interpreting genome-wide expression profiles. Proc Natl Acad Sci U S A. 2005;102(43):15545–15550. doi: 10.1073/pnas.0506580102. [DOI] [PMC free article] [PubMed] [Google Scholar]
- 83.Sparano JA, Golden AA, Montagna C. Translating the TCGA breast cancer results into clinical practice: searching for therapeutic clues. Oncology (Williston Park, NY) 2013;27(12):1284, 1286. [PubMed] [Google Scholar]
Associated Data
This section collects any data citations, data availability statements, or supplementary materials included in this article.


