Abstract
Pan evaporation (Epan) was regarded as a critical indicator of climate change, especially in the Qinghai-Tibet Plateau (QTP). By using the measured daily Epan data of 274 stations in the QTP from 1970 to 2017, the study detected abrupt changes in annual Epan series in different spatial scales, through integrating the Mann-Kendall abrupt change test, moving t-test and piecewise linear fitting model. Results showed that abrupt changes existed generally in the QTP where mean and trend abrupt changes were detected in 76.6% and 97.8% of 274 stations during the last half-century. Major abrupt change time of mean values and trends was respectively in around 1996, 1989 and 2007. In comparison, early abrupt changes were observed in the south (south of 30°N) and north (north of 35°N) but late ones in the midland (30–35°N). Corresponding to the low frequent behaviors, pan evaporation paradox only existed in the QTP as a whole in 1970–1990 and was not apparent at site scale, with less than 9.5% of 274 stations detected in different periods. The results confirmed prevailing abrupt change of pan evaporation and its distinct spatial pattern in the QTP.
Subject terms: Climate sciences, Hydrology
Introduction
The Qinghai-Tibet Plateau (QTP), famous as “roof of the world” and “water tower of Asia”, was the highest plateau around the world. It averaged over 4000 meters above sea level, with an area about 200000 square kilometers. Many large rivers originated in the plateau, such as Yangtze, Yellow, Lancang and Nujiang Rivers, supporting more than 1 billion people1,2. The QTP had vast territory but sparse population, wherein the influence of human activities was negligible3. Because of its vulnerable and sensitive natural environment, the QTP has been considered as the amplifier of global climate change4–8 and received increasing attention of worldwide researchers9.
Evapotranspiration (ET) was both an important component of terrestrial water balance and surface energy balance10,11 and an essential force in weather processes and climate patterns12. It contributed around 60% to 65% of global precipitation into the atmosphere11. Therefore, the study of evapotranspiration change is of great significance to understand climate change and its potential impacts on regional water cycle. Although numerous studies have focused on evapotranspiration-related topics, difficulties remained in accurately measuring and simulating actual evapotranspiration (ETa), especially at large spatial scale13. Overall, data sources commonly used in ET scientific community were in situ observation (e.g. monitoring of land surface energy flux and pan evaporation), remote sensing observation, model simulation as well as reanalysis datasets14–18. Among them, observation data from eddy covariance flux towers were the closest to ETa, but short of the network limited its popularity19,20. As an alternative observation data source, pan evaporation (Epan) represented potential evaporation from an open water surface under a certain meteorological condition and was often available in long-term time series with good comparability among various regional measurements21. It has therefore been widely used in various disciplines such as meteorology, hydrology and ecology22,23.
The variation of pan evaporation in the QTP has been studied by some researchers. For example, Liu et al.24 suggested that annual Epan had decreased by 3.06 mm a−2 based on 75 stations during 1970–2005, due to combined effects of decreasing wind speed, solar radiation and increasing vapor pressure. Xie et al.25 reported an overall decreasing rate of 11.91 mm a−2 based on 26 stations from 1970 to 2012. Zhang et al.26 analyzed the spatiotemporal characteristics of annual Epan as well as their underlying causes with observations and simulations by PenPan-20 at 77 stations from 1970 to 2011, they found that annual Epan existed a striking breakpoint at around 2001 with a significant decreasing trend before 2001 and a remarkable increase afterwards. These studies provided a scientific basis for in-depth understanding of evaporation variations in the QTP. However, the station networks used in above studies were limited, which increased the uncertainty in the identified spatial and temporal patterns. Meanwhile, most studies mainly focused on describing the long-term linear tendency of Epan in the entire QTP and its subregions24,25,27. Abrupt change was universal and important in the climate system, characterized by the process that climate pattern changed sharply from one stable situation to another28,29. For the QTP, unfortunately, it is yet unknown whether Epan changes have shifting trend at site scale and differ spatially.
In responses to the above concerns, this study aims to investigate the potential abrupt change characteristics of pan evaporation at site and regional scales by means of several testing methods. Specifically, monthly Epan observation data from 274 stations in the QTP during 1970–2017 are firstly obtained and analyzed. Abrupt changes in annual Epan series are then detected and tested. The outcomes of this research will advance the understanding of spatiotemporal dynamics of pan evaporation in the QTP, as well as give new insights into the responses of evaporation conditions to climate change.
Results
Data preparation
Considering the continuity in topography change, a 200 km buffer zone away from the QTP boundary demarcated by Zhang et al.30 was generated, which was the targeted area of this study (Fig. 1). It was further considered as three subregions, i.e. north QTP dominated by the westerlies (north of 35°N), south QTP dominated by the Indian monsoon (south of 30°N) and central QTP influenced by shifting between two circulation systems (30–35°N). The specific climate spatial boundaries and corresponding climatic characteristics can be referred to Yao et al.7. The observational data used in the study included daily standard Chinese 20 cm diameter pan evaporation (Epan, mm), daily maximum temperature (Tmax, K) and minimum temperature (Tmin, K), relative humidity (RH, %), sunshine duration (SD, h), wind speed and local pressure (P, kPa), all of which were taken from a high-quality daily meteorological dataset in the Data Center for Resources and Environmental Sciences, Chinese Academy of Sciences. The dataset and detailed description regarding data quality control were available through http://www.resdc.cn/. Due to its high quality and reliability, the subdataset published in the China Meteorological Data Sharing Service System (http://cdc.cma.gov.cn/) has been widely used in scientific research31–37. Though 315 standard synoptic stations were available, only 274 of them were selected during 1970–2017 considering the data quality, with 92, 78 and 104 stations located in the north, south and central QTP, respectively. The station elevations varied within 383.3 m (No. 57401) to 4800 m (No. 55294) (Fig. 1 and Supplementary Table S1).
Figure 1.
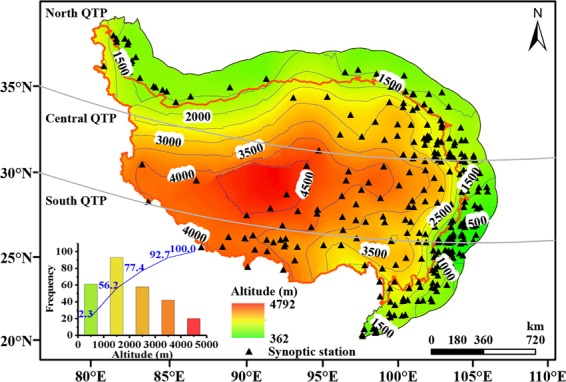
Topography of study area and synoptic stations. Orange line depicted the QTP boundary demarcated by Zhang et al.30 and the inset showed the frequency of stations in different altitudes. The map was created in ArcMap 10.2, URL: http://www.esrichina-bj.cn/softwareproduct/ArcGIS/, the inset was obtained by origin 9.0, URL: https://www.originlab.com/, and the final figure was generated using Photoshop CC2018, URL: https://onesoftwares.net/.
When ≥25 daily observations were available, a monthly Epan was calculated, otherwise it was defined as missing data. According to this criterion, there were 28195 missing data in the selected stations, accounting for 17.9% of the total. PenPan model was then employed to fill the vacancy. Details related to data supplementation were provided in the Supplementary Information file.
Spatial pattern of annual Epan
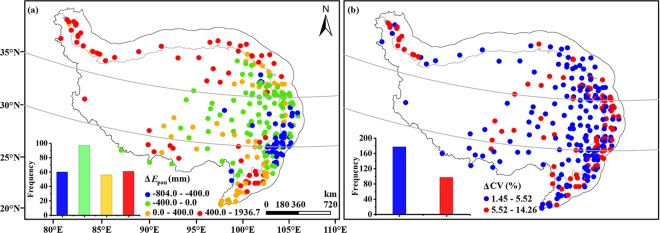
The mean annual Epan demonstrated a clear spatial pattern. It was (1639.9 ± 512.8) mm over the study period with a minimum value of 836.7 mm at No. 56278 in the central QTP and a maximum value of 3576.6 mm at No. 52576 in the northern region. To intensively clarify the spatial anomalies of mean annual Epan as well as the relationships between the site and area-averaged Epan, deviations of mean annual Epan at each station from area-averaged one were illustrated in Fig. 2(a). It can be found that most stations presented negative deviations, especially in the central and southeastern QTP, suggesting that mean annual Epan values in these areas were smaller than that of the entire area; whereas stations located in the north and south QTP owned a positive value, indicating that mean annual Epan values at these regions were larger than that of the entire area.
Figure 2.
Spatial patterns of the deviations of mean annual values from area-averaged annual Epan (a). (b) same as (a) but for coefficients of Epan variation. The insets showed the frequency of corresponding deviation values. The maps were created in ArcMap 10.2, URL: http://www.esrichina-bj.cn/softwareproduct/ArcGIS/, the insets were obtained by origin 9.0, URL: https://www.originlab.com/, and the final figure was generated using Photoshop CC2018, URL: https://onesoftwares.net/.
The coefficients of variation (CV) were employed to characterize the inter-annual changes of Epan for both the entire QTP and individual stations. In comparison, Fig. 2(b) presented the deviations of CV at each station from that of the entire QTP. It can be found that all deviations of 274 stations were positive and 65% of them varied between 1.45% and 5.52%, indicating that the magnitudes of annual Epan changes for individual stations were larger than that of the entire area. Spatially, stations with considerable deviation values were mainly distributed in the edge of the QTP, especially in the northwest and east edges with low elevation.
Characteristics of abrupt change in annual Epan
Abrupt change of mean value
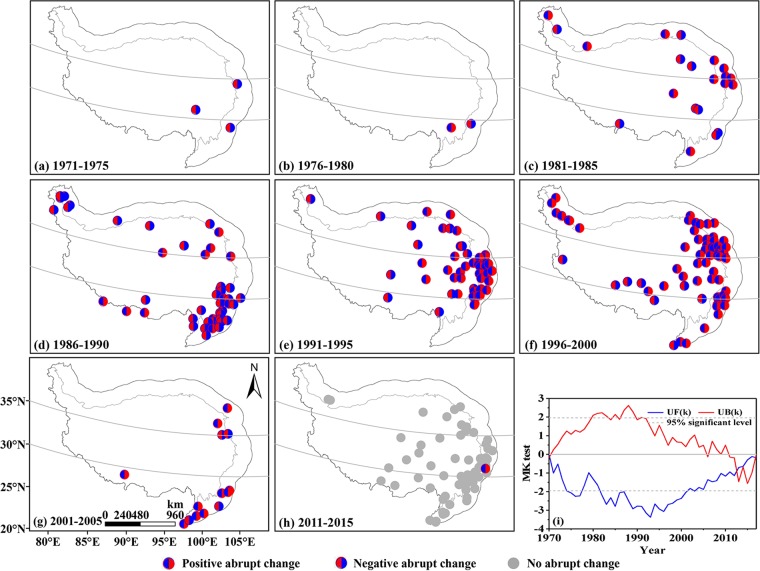
After detecting the potential mean abrupt changes of annual Epan series for 274 stations with Mann-Kendall abrupt change (MK test) and moving t-test methods (p < 0.05), the turning points were then illustrated by a 5-year interval in Fig. 3(a–h). Additionally, in order to better grasp the mean abrupt change features, possible mean abrupt changes of area-averaged Epan series were also investigated by above methods (Fig. 3(i)).
Figure 3.
Spatial distributions of mean abrupt changes of annual Epan series. (a–h) abrupt change at site scale, (i) abrupt change in the QTP as a whole. No significant abrupt changes were detected at the period 2006–2010. The maps were created in ArcMap 10.2, URL: http://www.esrichina-bj.cn/softwareproduct/ArcGIS/, the last figure was obtained by origin 9.0, URL: https://www.originlab.com/, and the final figure was generated using Photoshop CC2018, URL: https://onesoftwares.net/.
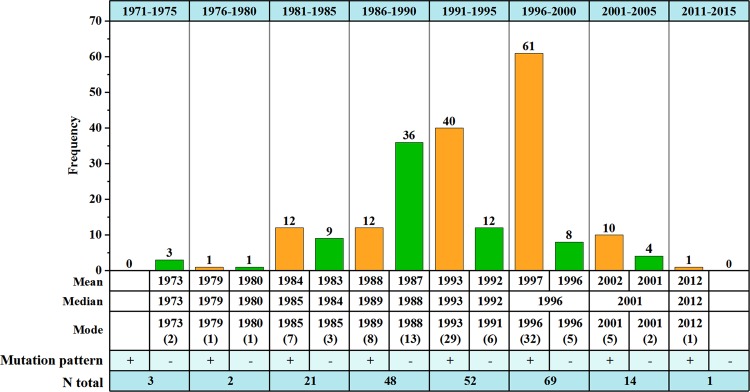
Abrupt change start time in a certain area was defined as the first year of a consecutive abrupt change process at a 5-year time scale. According to Fig. 4, the annual Epan series exhibited mean abrupt change in 76.6% of 274 stations over the study period. In the space domains, earlier mean abrupt change start time was captured in the south QTP, followed by the northern part, with respective start time in 1973 and 1983; whereas the start time in the central QTP was relatively late, especially in the region of 32° to 35°N where it was as late as 1993 (Fig. 3(a–h)). Overall, the mean abrupt changes of annual Epan series for each station were primarily detected in 1986–2000, especially around 1996.
Figure 4.
Statistics of mean abrupt changes of annual Epan series at site scale. ‘+’ and ‘−’ indicated positive and negative mean abrupt changes, respectively (Same below). The figure was generated by origin 9.0, URL: https://www.originlab.com/.
The mean abrupt changes were further divided into two types, i.e. positive mean abrupt change where the mean value of subseries after the turning point was greater than that before and negative mean abrupt change which showed a reverse trend to positive mean abrupt change. Combining Figs. 3(a–h) and 4, one can conclude that prior to 1990, the abrupt changes of annual Epan series were dominated by negative mean abrupt change with a positive-negative ratio of 25: 49 but turned to 112: 24 after that, suggesting the positive mean abrupt change apparently increased. In general, both the distributions of station numbers displaying positive and negative mean abrupt changes followed the unimodal distribution, with a peak value in 1996 and 1988, respectively. However, both MK and moving t-test indicated no significant abrupt change existed in the area-averaged Epan series from a whole perspective (Fig. 3(i)).
Abrupt change of trend
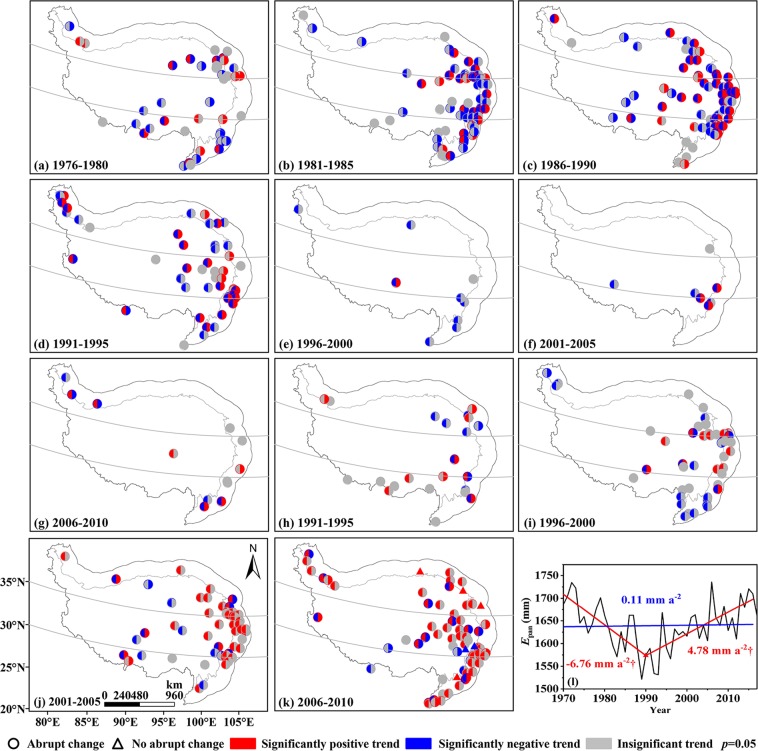
Pan evaporation variation was usually nonlinear. By detecting the potential trend abrupt changes of annual Epan series for 274 stations using the piecewise linear fitting model (PLFIM), the change points were identified and presented by a 5-year interval in Fig. 5(a–k). Simultaneously, to better understand trend abrupt change features in the QTP, the possible trend abrupt changes of area-averaged Epan series were also investigated (Fig. 5(l)).
Figure 5.
Spatial distributions of trend abrupt changes of annual Epan series. (a–g) the first abrupt change at site scale, (h–k) the second abrupt change at site scale, (l) abrupt change in the QTP as a whole. ‘†’ indicated trend passed the Mann-Kendall’s test at p = 0.05 (Same below). The maps were created in ArcMap 10.2, URL: http://www.esrichina-bj.cn/softwareproduct/ArcGIS/, the last figure was obtained by origin 9.0, URL: https://www.originlab.com/, and the final figure was generated using Photoshop CC2018, URL: https://onesoftwares.net/.
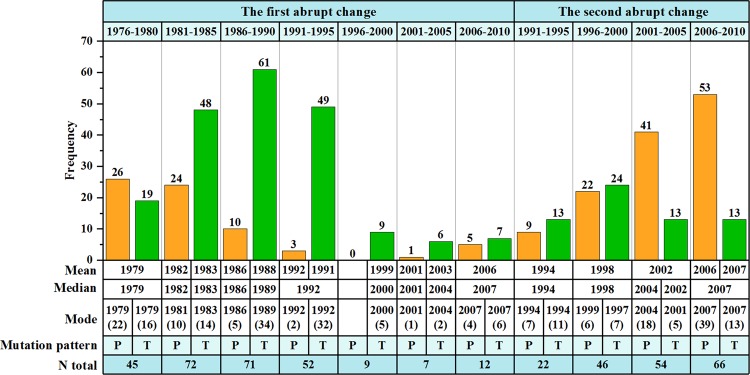
The signals of trend abrupt change were significant widely in station annual Epan series. As shown in Fig. 6, 268 out of 274 stations displayed an obviously partial linear trend over the study period, of which 29.9% stations showed only one turning point and 70.1% two turning points. Spatially, for the first turning (Fig. 5(a–g)), the trend abrupt change start time in three subregions was almost synchronous, i.e. about 1979, but that in the region over 32° to 35°N was late until 1983. Similar features can be found for the second turning (Fig. 5(h–k)). Generally, the trend abrupt change of annual Epan series occurred primarily in 1981–1995 and 2001–2010, especially in 1989 and 2007.
Figure 6.
Statistics of trend abrupt changes of annual Epan series at site scale. P and T indicated peak and trough abrupt changes, respectively. The figure was generated by origin 9.0, URL: https://www.originlab.com/.
The trend abrupt changes were also categorized into two types, i.e. peak trend abrupt change where the trend of annual Epan series changed from increasing to decreasing through the turning point and trough trend abrupt change where the trend reversed. As shown in Fig. 6, one can easily found out that the trend abrupt change types were remarkably dependent on time. It was specifically dominated by trough trend change prior to 1995 with a peak-trough ratio of 63: 199 and then turned to 116: 50. Interestingly, in spite of different magnitudes for two trend abrupt change types over the study period, both the distributions of station numbers along with abrupt change time displayed clearly temporal patterns. As for peak trend abrupt change, the number of stations decreased gradually in 1970–1995 but increased significantly in 1996–2010, with a maximum value appearing in 1979 and 2007, respectively. A clear unimodal distribution pattern was observed for trough trend change before and after 1995, with the corresponding peak value occurring in 1989 and 1997, respectively. Although trend abrupt changes showed regional diversity, an obvious trough trend abrupt change was depicted in the QTP as a whole, with a join point in 1990 (Fig. 5(l)).
Discussion
Spatial pattern of annual Epan and its stability
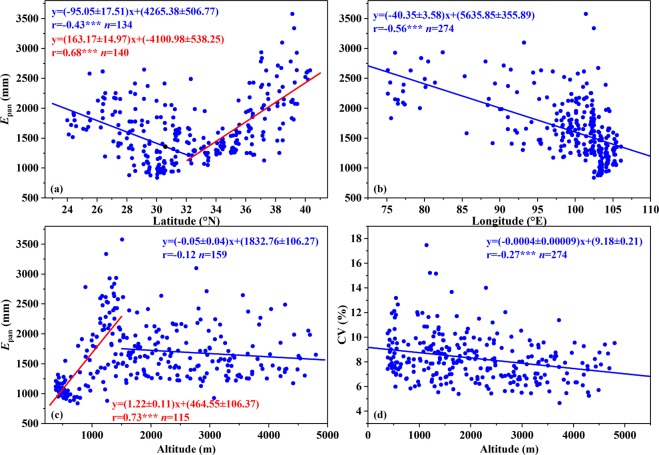
A distinct spatial structure of mean annual Epan was uncovered, with large values occurring in the south and north QTP but small ones appearing in the central and southeastern regions. From Fig. 7(a–c), good linear relationships existed between mean annual Epan and the corresponding latitude, longitude and altitude. Specifically, mean annual Epan decreased by (95.05 ± 17.51) mm with one degree increment of latitude to the south of 32°N but increased by (163.17 ± 14.97) mm to the north of 32°N (Fig. 7(a)); from the west to east, mean annual Epan presented a significantly downward trend, with an average lapse rate of (40.35 ± 3.58) mm per one degree increase (Fig. 7(b)). In comparison, significant correlation of mean annual Epan with altitude was only detected in a narrow range of 383.3–1500 m, where mean annual Epan increased by (122 ± 11) mm for each 100 m increment of altitude (Fig. 7(c)). Considerable low values occurring in the central and southeastern QTP could be attributable to the relatively humid regional atmospheric condition and heavy cloud coverage. The regions were mainly characterized by humid and semi-humid climate, with densely covered river and heavy cloud coverage, particularly in the southeast38. Previous studies showed that atmospheric humid, as a crucial aerodynamic factor, exerted directly negative forcing on local atmospheric evaporation demand, while cloud coverage may affect pan evaporation through its influence on global radiation at the earth’s surface. On average, the heavier cloud coverage was, the smaller Epan was. Consequently, atmospheric evaporative demands in two regions tended to be at a low level.
Figure 7.
Scatter plots of mean annual values (a–c) and coefficients of Epan variation (d) versus latitude, longitude and altitude at 274 stations, respectively. *, ** and *** indicated correlation passed t-test at p < 0.05, p < 0.01 and p < 0.001, respectively. The figures were generated by origin 9.0, URL: https://www.originlab.com/.
Altitudinal dependence of CV was found with a Pearson correlation coefficient of −0.27 (p < 0.001, Fig. 7(d)), although the elevation had a poor ability in explaining the observed CV variation. However, the relationships between CV and the corresponding latitude and longitude were insignificant (p > 0.1). Generally, the spatial pattern of mean annual Epan was similar to Zhang et al.26 in 1970–2011, although the data series used here was almost 6-year longer. According to the movement trajectory of regional gravity center of annual Epan obtained by the Gravity center model, longitude, latitude and altitude coordinates ranged from 97.48° to 98.01°E, 32.72° to 33.03°N and 2019.91 to 2106.43 m, respectively (Supplementary Fig. S2). In addition, trends in three coordinates did not pass the Mann-Kendall’s test at p = 0.05. These all indicated the stability of spatial pattern in annual Epan.
Prevailing abrupt change of annual Epan
At site scale, an overall impression of temporal patterns in annual Epan series was that the shifting mean values and changing trends could be evidently observed, although the time and station numbers were regionally different. Approaximately 76.6% stations displayed significant mean abrupt changes and nearly all stations (97.8%) showed obviously partial linear trends. Both mean and trend abrupt changes had spatial patterns appearing firstly in the south and north QTP and then to the central region. The latest abrupt change was mainly observed in the north part of the central QTP (32–35°N). Previous studies showed that the north QTP was mainly controlled by the westerlies and the south one dominated by the Indian monsoon. Affected by the transition between the westerlies and monsoon systems, δ18O in precipitation presented no clear extrema for either winter or summer in the central QTP (32–35°N), with the precipitation and temperature showing small maxima in summer compared to the north and south7. This complex atmospheric circulation pattern may be responsible for small regional annual Epan and relatively late abrupt change start time in the central region. It should be noted that the above spatial patterns and possible impact factors in different regions, to some extent, could represent the general mechanisms of abrupt changes in annual Epan series. However, it might not be applicative for every individual synoptic station in the region. For instance, as shown in Figs. 3 (a–h) and 5(a–k), some nearby stations showed different abrupt changes in the central QTP. It was probably related to the local underlying surface characteristics.
In terms of the area-averaged time series, no significant mean abrupt changes were detected over the study period, but a clear trough trend abrupt change pattern was depicted with a turning point in 1990 when the decreasing trend of annual Epan reversed to increasing one. This trend changing pattern was in agreement with the regional study by Zhang et al.26 and national investigation in China by Liu et al.39, but its turning point was 11 years and 1 year earlier than that of Zhang et al.26 and of Liu et al.39, respectively. In comparison, there were differences in station number and data series length between this study and Zhang et al.26. The latter presented annual Epan data collected from 77 stations in the QTP from 1970 to 2011, and thereby diversifying the abrupt change detected. This also implied the necessity of considerable data with satisfactorily spatial and temporal resolution for the QTP with high spatial heterogeneity in hydrometeorology. Furthermore, it was generally consistent between the trend abrupt change characteristic of annual Epan series and that of NDVI during 1982–200640, which supported the results of pan evaporation abrupt change owing to good relationship between ETa and NDVI.
Limited pan evaporation paradox in the QTP
Evaporation was often expected to have an increasing trend in globally warming climate. Lots of observations, however, showed that pan evaporation has been steadily decreasing in many regions over the past several decades, labeled as “pan evaporation paradox”16,41–45. In this study, 271 out of 274 stations showed an overall warming trend during the last half-century, and 64.6% of them passed the Mann-Kendall’s test at p = 0.05. During the same period, annual Epan presented a decreasing trend at 154 out of 274 stations, and 24.0% of them satisfied the Mann-Kendall’s test at the same p-value. However, consequential significant pan evaporation paradox, a statistically significant decreasing trend in annual Epan corresponding to warming trend (p < 0.05), was only observed in 26 stations (Supplementary Fig. S3). By calculating the trends of annual Epan of 274 stations during the segmented periods determined by the turning points and the corresponding annual temperature subseries, it was found that pan evaporation paradox only existed in limited stations in three potential periods (Supplementary Fig. S3). Specifically, in the first subperiod (about 1970–1995), 82 out of 126 stations with a warming trend appeared a decreasing trend in annual Epan, but only 15 stations showed significant pan evaporation paradox; in the second subperiod (about 1996–2007) and third subperiod (after 2008), similarly, 63 and 89 out of 274 stations showed increasing in annual temperature but decreasing in annual Epan, while only 12 and 2 of them supported the significant pan evaporation paradox, respectively. Therefore, significant pan evaporation paradox scattered in the study periods.
From a regional perspective, the paradox in the QTP as a whole was only observed before 1990, which was consistent with Xing et al.32 but much different from Liu et al.24 who used the records of 75 synoptic stations between 1970 and 2005 (Table 1). These findings indicated the necessity of considerable data with satisfactorily spatial and temporal resolution in the QTP. Besides, early studies showed that the paradox just existed in a certain stage or region throughout the world32,46–48, indicating that the spatial heterogeneity and time-dependent behavior was a global common phenomenon.
Table 1.
Comparison of evaporation paradox studies in the QTP.
| Region and station number | Study period | Evaporation paradox | Reference |
|---|---|---|---|
| QTP, 274 | 1970–2017 | exist at regional scale in 1970–1990 but not prevail at site scale | This study |
| QTP, 75 | 1970–2005 | exist at regional scale in 1970–2005 | Liu et al.24 |
|
China, 602 QTP, 82 |
1961–2011 | exist at regional scale in 1973–1992 | Xing et al.32 |
| China, 317 | 1956–2005 | exist at national scale but not in northeast and southeast China | Cong et al.46 |
| China, 599 | 1960–2013 | seasonal, decadal patterns but spatial difference | Huang et al.48 |
| Global, grid | 1980–2011 | ENSO dominates the paradox | Miralles et al.47 |
In the QTP, therefore, pan evaporation paradox did exist as a whole in 1970–1990 but not prevail at site scale (less than 9.5% of observation stations) in different periods. There was no necessary connection between the paradox and local climate. The limited significant paradox appeared in a few stations was probably caused by random fluctuation of annual Epan series and needed further study.
Abrupt change of Epan in different climate zones
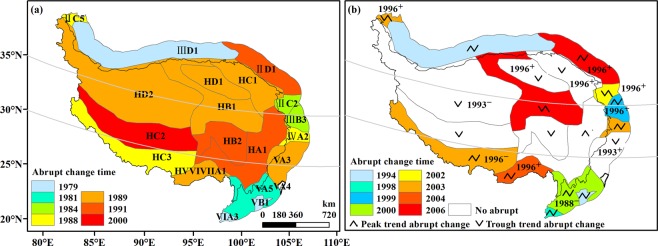
To clarify the influences of different climate zoning schemes on the abrupt change detection of annual Epan series, we further compared the results based on Yao’s zoning7 with a more traditional scheme49 (Supplementary Table S3) which divided the QTP into 19 climate zones according to spatial-temporal characteristics of temperature and aridity. Figure 8 showed the detection results of abrupt change of zone-averaged annual Epan series. From Fig. 8(b), there was prevailing mean abrupt change in Epan series (p < 0.05), with an exception for climate zones in the central QTP. The mean abrupt changes were dominated by positive abrupt change and mainly occurred in around 1996, but as early as 1988 in VA5 Zone. These were in good agreement with those at site scale.
Figure 8.
Abrupt changes of zone-averaged annual Epan series in different climate zones. (a) the first trend abrupt change, (b) mean abrupt change and the second trend abrupt change. The shaded patterns and numbers indicated trend and mean abrupt change time, respectively. The maps were generated in ArcMap 10.2, URL: http://www.esrichina-bj.cn/softwareproduct/ArcGIS/.
From Fig. 8(a,b), the trend abrupt change of Epan was observed in all climate zones. Specifically, the peak-trough trend abrupt change was dominant in climate zones along the edge of the QTP, while the trough abrupt change dominated in the hinterland. After the last trend abrupt change, Epan exhibited an upward trend in most climate zones (Fig. 8(b)). By comparison, the trend abrupt change time in the south and north QTP was generally earlier than that in the central, which were broadly similar to the results obtained from the climate zoning scheme with three subregions.
Abrupt change of annual actual evapotranspiration
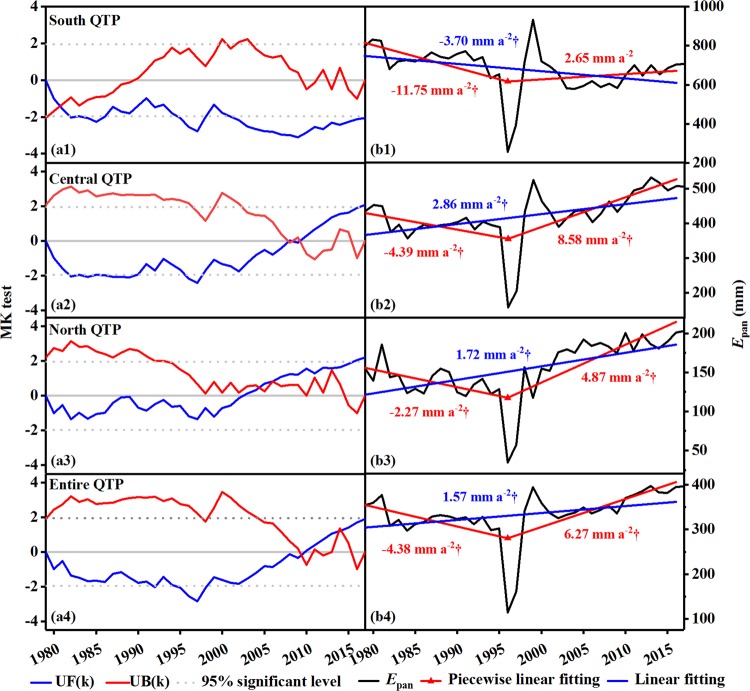
Monthly actual evapotranspiration from the Global Land Data Assimilation System (GLDAS, https://disc.gsfc.nasa.gov/) was used to make comparison with observation dataset. Figure 9 showed the results of abrupt changes in annual ETa series for the entire QTP and three subregions. A distinct spatial pattern of mean abrupt change was found, where the mean abrupt change time of annual ETa was the earliest in the south QTP (around 1981), followed by the north QTP (around 2004) and central QTP (around 2009, Fig. 9(a1–a3)). Although the two curves in Fig. 9(a4) intersected twice within the significance lines of p = 0.05, the abrupt change was insignificant according to moving t-test at p = 0.05, indicating that no mean abrupt change appeared with regard to the QTP as a whole.
Figure 9.
Abrupt changes of annual actual evapotranspiration series in the QTP and three subregions. (a1–a4) mean abrupt change, (b1–b4) trend abrupt change. The figures were generated by origin 9.0, URL: https://www.originlab.com/.
In term of changing trend, all three subregions presented substantially trough trend abrupt changes with a common join point around 1997 (Fig. 9(b1–b3)). Further, area-averaged annual ETa tended to decrease before 1997, and then increase significantly afterwards, suggesting that substantial trend abrupt change existed (Fig. 9(b4)). In comparison, the trend abrupt change of area-averaged annual ETa appeared around 7 years later than that of annual pan evaporation, because of the delayed response of annual ETa to the change in atmospheric evaporation conditions. These results further supported the findings from observation dataset.
Conclusions
In this study, we modified PenPan model to estimate the missing monthly Epan data at 274 stations in the QTP during 1970–2017, and potential evaporation abrupt changes were then detected. Mean annual Epan displayed spatial heterogeneity with high values in the south and north QTP while low in the central and southeastern regions, and the spatial distribution of mean annual Epan showed stability during the last half-century. In addition, mean and trend abrupt changes generally existed in 76.6% and 97.8% of total stations. The major abrupt change time of mean values and trends was respectively at 1996, 1989 and 2007 in the order of south-north-central. It was relatively late in the midland, especially in the region of 32° to 35°N. Pan evaporation paradox did not prevail (less than 9.5%) in the QTP at site scale and only existed in 1970–1990 at regional scale. The findings presented valuable monthly Epan dataset for the relevant researches, and further advanced our understanding of evaporation response to climate and hydrological cycle changes. Future studies may focus on the abrupt change mechanism through modeling techniques based on high-resolution and long-term datasets.
Methods
PenPan model
PenPan model was a physically-based model for estimating monthly pan evaporation50, which coupled the Linacre’s Penpan model51, Pereira’s Penman-Monteith-style model52 and Thom’s Penman-style model53. In comparison with the mathematical-statistical models, e.g. multiple linear regression model, it showed better performance due to integrating the influences of local environmental factors and the structure of pan itself50. In this model, monthly Epan (mm) was subdivided into radiative (Erad, mm s−1) and aerodynamic components (Eaero, mm s−1)31:
| 1 |
where Δ, with a unit of Pa·K−1, denoted the slope of saturation vapor pressure (es) curve at a given air temperature at 2 m above the ground level (Ta, K), Ta for monthly periods was defined as the mean of corresponding Tmax and Tmin, Rn was net radiation of the pan (W·m−2), α refered to the ratio of the effective surface area for the transmission of heat and water vapor (=5)54, 𝛾 was the psychrometric constant (≈ 67 Pa·K−1), 𝜆 indicated the latent heat of vaporization of water (=2.45 × 10⁶ J·kg−1), U2 showed the mean wind speed at 2 m above the ground level (m·s−1), VPD was the vapor pressure deficit at 2 m above the ground level, and f(U2) was the wind function for transfer of water vapor at 2 m above the ground level (kg·m−2·s−1·Pa−1). The specific calculation formulas for each parameter in the model were shown as follows:
| 2 |
where Mw was the molecular mass of water (=0.018 kg mol−1), R was the ideal gas constant (=8.314 J mol−1 K−1). The Rn was estimated using an empirical equation recommended by FAO55:
| 3 |
where Rsp was incoming shortwave irradiance of the pan, including direct shortwave irradiance and the additional interception by pan walls50, Ap denoted the albedo for pan (=0.14), Rnl showed net long-wave irradiance. Rsp was estimated using the method described by Yang et al.54:
| 4 |
| 5 |
where fdir was the fraction of direct radiation in global solar radiation, Prad indicated the pan radiation factor, φ was the absolute value of latitude (degrees). The land surface albedo was a (=0.23), which was defined as a value appropriate for short and green grass. Wang et al.38 established the regression equations as follows, which successfully estimated the monthly diffuse radiation in China at site scale:
| 6 |
| 7 |
Generally, the values of monthly Rd at stations in the QTP can be estimated well by both regression methods. Given that most synoptic stations distributed in the southern region, Eq. (6) was employed to calculate fdir. Ra refered to extraterrestrial solar radiation (MJ m−2 day−1), Rs was global solar radiation (MJ m−2 day−1) and can be calculated by:
| 8 |
The monthly mean Angstrom coefficients, i.e. as and bs, calculated by Yin et al.56 were employed in this study. The Rnl was calculated as follows55:
| 9 |
where σ was the Stefan-Boltzmann constant (4.903*10−3 J K−4 m−2 day−1), Tmax and Tmin denoted the maximum and minimum temperature (K) during the 24 h-period, respectively. Zhang et al.26 reported that the following regression approaches can well characterize the transfer process of water vapor over the QTP:
| 10 |
| 11 |
where U10 showed the mean wind speed at 10 m above the ground level (m·s−1).
VPD can be calculated as follows:
| 12 |
Trend free pre-whitening
The autoregressive process had an obvious influence on the results obtained by nonparametric test methods (e.g. Mann-Kendall rank statistical test), especially the lag-1 autoregressive process57,58. Therefore, in this study, the lag-1 autocorrelation coefficient of annual Epan data was firstly calculated and tested prior to applying Mann-Kendall rank statistical test to assess the significance of trends and to detect the abrupt changes in annual Epan series. Results showed that 235 out of 274 stations exhibited a significant autocorrelation with Student’s t-test (t-test) at p = 0.05, varying from 0.29 to 0.83. A trend free pre-whitening technique was then applied to eliminate the serial correlation57. The new lag-1 autocorrelation values fell in (−0.23, 0.22) and none of them passed the t-test at p = 0.10, indicating that new time series was not influenced by the serial correlation.
Abrupt change analysis
Mann-Kendall abrupt change test was a commonly used nonparametric test method for abrupt changes of mean values in hydrometeorological time series, but it showed uncertainty for time series with two or more abrupt change points. Hence, moving t-test, a parametric test method, was also applied to verify the abrupt change. The procedures of MK and moving t-test can be found in Zhao et al.59 and not provided here. Meanwhile, the piecewise linear fitting model proposed by Tomé et al.60 was selected to detect the turning point of annual Epan trend. PLFIM utilized a least-square approach to compute the best combination of continued straight lines fitting a given time series, subject to a set of constraints on the minimum distance between neighboring breakpoints and on the minimum trend change before and after the breakpoint. According to early studies60–62 and considering the length of annual Epan series, we set the constraints as follows: a minimum 15-year interval between neighboring breakpoints, a minimum 10-year length for the first and last segments and an opposite sign between two consecutive change trends. Further, once turning points were detected, the Mann-Kendall trend analysis method was adopted to assess the significance of change during the segmented period58.
Gravity center model
The movement trajectory of regional gravity center of annual Epan was examined in this study by using the following equations63:
| 13 |
| 14 |
| 15 |
where t, t and t respectively denoted the latitude, longitude and altitude coordinates of regional gravity center of annual Epan at year t, Epan,ti was annual Epan at year t for station i, (xi, yi, zi) represented the corresponding coordinates of station i.
Supplementary information
Acknowledgements
We would like to thank Professor António Rodrigues Tomé for providing the codes used for piecewise linear fitting. This research was supported by the Strategic Priority Research Program of the Chinese Academy of Sciences [XDA20040301], the Second Tibetan Plateau Scientific Expedition and Research Program (STEP) [2019QZKK1003] and the National Natural Science Foundation of China [41890824].
Author contributions
H.L. and T.Y. designed the study; W.F. collected and processed the data; Q.Y. analyzed the results; T.Y. and H.L. contributed to the interpretation and manuscript writing. All authors reviewed the manuscript.
Data availability
Daily meteorological dataset used in this study is available in the Data Center for Resources and Environmental Sciences, Chinese Academy of Sciences (http://www.resdc.cn). Monthly actual evapotranspiration and temperature datasets from the Global Land Data Assimilation System (GLDAS) are available from GES DISC Web site (https://disc.gsfc.nasa.gov/). The monthly and annual pan evaporation data are obtained from the corresponding author on reasonable request.
Competing interests
The authors declare no competing interests.
Footnotes
Publisher’s note Springer Nature remains neutral with regard to jurisdictional claims in published maps and institutional affiliations.
Supplementary information
is available for this paper at 10.1038/s41598-019-56464-1.
References
- 1.Immerzeel WW, van Beek LPH, Bierkens MFP. Climate change will affect the Asian water towers. Science. 2010;328:1382–1385. doi: 10.1126/science.1183188. [DOI] [PubMed] [Google Scholar]
- 2.Zhang T, et al. Climate-related trends of actual evapotranspiration over the Tibetan Plateau (1961–2010) Int. J. Climatol. 2018;381:e48–e56. doi: 10.1002/joc.5350. [DOI] [Google Scholar]
- 3.Song C, Huang B, Richards K, Ke L, Hien Phan V. Accelerated lake expansion on the Tibetan Plateau in the 2000s: induced by glacial melting or other processes? Water Resour. Res. 2014;50:3170–3186. doi: 10.1002/2013WR014724. [DOI] [Google Scholar]
- 4.Klein JA, Harte J, Zhao X. Experimental warming causes large and rapid species loss, dampened by simulated grazing, on the Tibetan Plateau. Ecol. Lett. 2004;7:1170–1179. doi: 10.1111/j.1461-0248.2004.00677.x. [DOI] [Google Scholar]
- 5.Bolch T, et al. The state and fate of Himalayan glaciers. Science. 2012;336:310–314. doi: 10.1126/science.1215828. [DOI] [PubMed] [Google Scholar]
- 6.Sha Y, Shi Z, Liu X, An Z. Distinct impacts of the Mongolian and Tibetan Plateaus on the evolution of the East Asian Monsoon. J. Geophys. Res.-Atmos. 2015;120:4764–4782. doi: 10.1002/2014JD022880. [DOI] [Google Scholar]
- 7.Yao T, et al. A review of climatic controls on δ18O in precipitation over the Tibetan Plateau: observations and simulations. Rev. Geophys. 2013;51:525–548. doi: 10.1002/rog.20023. [DOI] [Google Scholar]
- 8.Zhang G, et al. Extensive and drastically different alpine lake changes on Asia’s high plateaus during the past four decades. Geophys. Res. Lett. 2017;44:252–260. doi: 10.1002/2016GL072033. [DOI] [Google Scholar]
- 9.Yang K, et al. Recent climate changes over the Tibetan Plateau and their impacts on energy and water cycle: a review. Glob. Planet. Change. 2014;112:79–91. doi: 10.1016/j.gloplacha.2013.12.001. [DOI] [Google Scholar]
- 10.He Y, Lin K, Chen X, Ye C, Cheng L. Classification-based spatiotemporal variations of pan evaporation across the Guangdong province, south China. Water Resour. Manag. 2015;29:901–912. doi: 10.1007/s11269-014-0850-5. [DOI] [Google Scholar]
- 11.Oki T, Kanae S. Global hydrological cycles and world water resources. Science. 2006;313(1068–1072):1068–1072. doi: 10.1126/science.1128845. [DOI] [PubMed] [Google Scholar]
- 12.Darshana PA, Pandey RP. Analysing trends in reference evapotranspiration and weather variables in the Tons river basin in central India. Stoch. Environ. Res. Risk Assess. 2013;27:1407–1421. doi: 10.1007/s00477-012-0677-7. [DOI] [Google Scholar]
- 13.Mao Y, Wang K. Comparison of evapotranspiration estimates based on the surface water balance, modified Penman-Monteith model, and reanalysis data sets for continental China. J. Geophys. Res.-Atmos. 2017;122:3228–3244. doi: 10.1002/2016JD026065. [DOI] [Google Scholar]
- 14.Liu, J., Jia, B., Xie, Z. & Shi, C. Ensemble simulation of land evapotranspiration in China based on a multi-forcing and multi-model approach. Adv. Atmos. Sci. 33, 673–684, 10.1007/s00376-016-5213-0673-684 (2016).
- 15.Liu W, Sun F. Assessing estimates of evaporative demand in climate models using observed pan evaporation over China. J. Geophys. Res.-Atmos. 2016;121:8329–8349. doi: 10.1002/2016JD025166. [DOI] [Google Scholar]
- 16.Roderick, M. L., Rotstayn, L. D., Farquhar, G. D. & Hobbins, M. T. On the attribution of changing pan evaporation. Geophys. Res. Lett. 34, 10.1029/2007GL031166 (2007).
- 17.Wang W, et al. Satellite retrieval of actual evapotranspiration in the Tibetan Plateau: components partitioning, multidecadal trends and dominated factors identifying. J. Hydrol. 2018;559:471–485. doi: 10.1016/j.jhydrol.2018.02.065. [DOI] [Google Scholar]
- 18.Xu JQ, Haginoya S, Saito K, Motoya K. Surface heat balance and pan evaporation trends in Eastern Asia in the period 1971–2000. Hydrol. Process. 2005;19:2161–2186. doi: 10.1002/hyp.5668. [DOI] [Google Scholar]
- 19.French AN, et al. Surface energy fluxes with the advanced spaceborne thermal emission and reflection radiometer (ASTER) at the Iowa 2002 SMACEX site (USA) Remote Sens. Environ. 2005;99:55–65. doi: 10.1016/j.rse.2005.05.015. [DOI] [Google Scholar]
- 20.Ma N, Zhang Y, Xu C, Szilagyi J. Modeling actual evapotranspiration with routine meteorological variables in the data-scarce region of the Tibetan Plateau: comparisons and implications. J. Geophys. Res.-Biogeosci. 2015;120:1638–1657. doi: 10.1002/2015JG003006. [DOI] [Google Scholar]
- 21.Liu C, Zeng Y. Changes of pan evaporation in the recent 40 years in the Yellow river basin. Water Int. 2004;29:510–516. doi: 10.1080/02508060408691814. [DOI] [Google Scholar]
- 22.Wang Tingting, Zhang Jie, Sun Fubao, Liu Wenbin. Pan evaporation paradox and evaporative demand from the past to the future over China: a review. Wiley Interdisciplinary Reviews: Water. 2017;4(3):e1207. doi: 10.1002/wat2.1207. [DOI] [Google Scholar]
- 23.Chahine MT. The hydrological cycle and its influence on climate. Nature. 1992;359:373–380. doi: 10.1038/359373a0. [DOI] [Google Scholar]
- 24.Liu X, Zheng H, Zhang M, Liu C. Identification of dominant climate factor for pan evaporation trend in the Tibetan Plateau. J. Geogr. Sci. 2011;21:594–608. doi: 10.1007/s11442-011-0866-1. [DOI] [Google Scholar]
- 25.Xie H, Zhu X, Yuan D. Pan evaporation modelling and changing attribution analysis on the Tibetan Plateau (1970–2012) Hydrol. Process. 2015;29:2164–2177. doi: 10.1002/hyp.10356. [DOI] [Google Scholar]
- 26.Zhang C, Liu F, Shen Y. Attribution analysis of changing pan evaporation in the Qinghai-Tibetan Plateau, China. Int. J. Climatol. 2018;38:e1032–e1043. doi: 10.1002/joc.5431. [DOI] [Google Scholar]
- 27.Shi H, Li T, Wang G. Temporal and spatial variations of potential evaporation and the driving mechanism over Tibet during 1961–2001. Hydrolog. sci. J. 2017;62:1469–1482. doi: 10.1080/02626667.2017.1332416. [DOI] [Google Scholar]
- 28.Alley RB, et al. Abrupt climate change. Science. 2003;299:2005–2010. doi: 10.1126/science.1081056. [DOI] [PubMed] [Google Scholar]
- 29.Overpeck JT, Cole JE. Abrupt change in earth’s climate system. Annu. Rev. Environ. Resour. 2006;31:1–31. doi: 10.1146/annurev.energy.30.050504.144308. [DOI] [Google Scholar]
- 30.Zhang, Y. L., Li, B. Y. & Zheng, D. A discussion on the boundary and area of the Tibetan Plateau in China. Geographical Research. 21(1), 1–8, 10.3321/j.issn:1000-0585.2002.01.001 (2002).
- 31.Du H, Wu Z, Zong S, Meng X, Wang L. Assessing the characteristics of extreme precipitation over northeast China using the multifractal detrended fluctuation analysis. J. Geophys. Res.-Atmos. 2013;118:6165–6174. doi: 10.1002/jgrd.50487. [DOI] [Google Scholar]
- 32.Xing, W. et al. Periodic fluctuation of reference evapotranspiration during the past five decades: does evaporation paradox really exist in China? Sci. Rep. 6, 10.1038/srep39503 (2016). [DOI] [PMC free article] [PubMed]
- 33.Feng X, et al. Revegetation in China’s Loess Plateau is approaching sustainable water resource limits. Nat. Clim. Change. 2016;6:1019–1022. doi: 10.1038/NCLIMATE3092. [DOI] [Google Scholar]
- 34.Xu, Z. et al. Climate variability and trends at a national scale. Sci. Rep. 7, 10.1038/s41598-017-03297-5 (2017). [DOI] [PMC free article] [PubMed]
- 35.Luo, J. et al. Spatiotemporal pattern of PM2.5 concentrations in mainland China and analysis of its influencing factors using Geographically Weighted Regression. Sci. Rep. 7, 10.1038/srep40607 (2017). [DOI] [PMC free article] [PubMed]
- 36.Yuan, X. et al. Anthropogenic shift towards higher risk of flash drought over china. Nat. Commun. 10, 10.1038/s41467-019-12692-7 (2019). [DOI] [PMC free article] [PubMed]
- 37.Ding, J., Cuo, L., Zhang, Y. & Zhu, F. Monthly and annual temperature extremes and their changes on the Tibetan Plateau and its surroundings during 1963–2015. Sci. Rep.8, https://doi.org/10.1038/s41598-018-30320-0 (2018). [DOI] [PMC free article] [PubMed]
- 38.Wang H, Sun F, Wang T, Liu W. Estimation of daily and monthly diffuse radiation from measurements of global solar radiation a case study across China. Renew. Energy. 2018;126:226–241. doi: 10.1016/j.renene.2018.03.029. [DOI] [Google Scholar]
- 39.Liu X, Luo Y, Zhang D, Zhang M, Liu C. Recent changes in pan-evaporation dynamics in China. Geophys. Res. Lett. 2011;38:L13404. doi: 10.1029/2011GL047929. [DOI] [Google Scholar]
- 40.Li B, Zhang L, Yan Q, Xue Y. Application of piecewise linear regression in the detection of vegetation greenness trends on the Tibetan Plateau. Int. J. Remote Sens. 2014;35:1526–1539. doi: 10.1080/01431161.2013.878066. [DOI] [Google Scholar]
- 41.Brutsaert W, Parlange MB. Hydrologic cycle explains the evaporation paradox. Nature. 1998;396:30. doi: 10.1038/23845. [DOI] [Google Scholar]
- 42.Breña-Naranjo JA, Laverde-Barajas MÁ, Pedrozo-Acuña A. Changes in pan evaporation in Mexico from 1961 to 2010. Int. J. Climatol. 2017;37:204–213. doi: 10.1002/joc.4698. [DOI] [Google Scholar]
- 43.Limjirakan S, Limsakul A. Trends in Thailand pan evaporation from 1970 to 2007. Atmos. Res. 2012;108:122–127. doi: 10.1016/j.atmosres.2012.01.010. [DOI] [Google Scholar]
- 44.Padmakumari B, Jaswal AK, Goswami BN. Decrease in evaporation over the Indian monsoon region: implication on regional hydrological cycle. Clim. Change. 2013;121:787–799. doi: 10.1007/s10584-013-0957-3. [DOI] [Google Scholar]
- 45.Peterson TC, Golubev VS, Groisman PY. Evaporation losing its strength. Nature. 1995;377:687–688. doi: 10.1038/377687b0. [DOI] [Google Scholar]
- 46.Cong ZT, Yang DW, Ni GH. Does evaporation paradox exist in China? Hydrol. Earth Syst. Sci. 2009;13:357–366. doi: 10.5194/hess-13-357-2009. [DOI] [Google Scholar]
- 47.Miralles DG, et al. El Niño-La Niña cycle and recent trends in continental evaporation. Nat. Clim. Change. 2014;4:122–126. doi: 10.1038/NCLIMATE2068. [DOI] [Google Scholar]
- 48.Huang H, et al. Spatiotemporal characteristics of evapotranspiration paradox and impact factors in China in the period of 1960–2013. Adv. Meteorol. 2015;2015:1–10. doi: 10.1155/2015/519207. [DOI] [Google Scholar]
- 49.Zhu, B. Chinese Climate, Science Press (Beijing, 1962).
- 50.Rotstayn, L. D., Roderick, M. L. & Farquhar, G. D. A simple pan-evaporation model for analysis of climate simulations: evaluation over Australia. Geophys. Res. Lett. 33, 10.1029/2006GL027114 (2006).
- 51.Linacre ET. Estimating U.S. Class A pan evaporation from few climate data. Water Int. 1994;19:5–14. doi: 10.1080/02508069408686189. [DOI] [Google Scholar]
- 52.Pereira AR, Nova NAV, Pereira AS, Barbieri V. A model for the Class A pan coefficient. Agric. For. Meteorol. 1995;76:75–82. doi: 10.1016/0168-1923(94)02224-8. [DOI] [Google Scholar]
- 53.Thom AS, Thony JL, Vauclin M. On proper employment of evaporation pans and atmometers in estimating potential transpiration. Q. J. R. Meteorol. Soc. 2010;107:711–736. doi: 10.1002/qj.49710745316. [DOI] [Google Scholar]
- 54.Yang H, Yang D. Climatic factors influencing changing pan evaporation across China from 1961 to 2001. J. Hydrol. 2012;414–415:184–193. doi: 10.1016/j.jhydrol.2011.10.043. [DOI] [Google Scholar]
- 55.Allen, R. G., Pereira, L. S., Raes, D. & Smith, M. Crop evapotranspiration-guidelines for computing crop water requirements. FAO Irrigation and Drainage Paper 56, Food and Agriculture Organization of the United Nations, Rome, Italy (1998).
- 56.Yin Y, Wu S, Zheng D, Yang Q. Radiation calibration of FAO56 Penman-Monteith model to estimate reference crop evapotranspiration in China. Agric. Water Manage. 2008;95:77–84. doi: 10.1016/j.agwat.2007.09.002. [DOI] [Google Scholar]
- 57.Yue Sheng, Wang Chun Yuan. Applicability of prewhitening to eliminate the influence of serial correlation on the Mann-Kendall test. Water Resources Research. 2002;38(6):4-1-4-7. doi: 10.1029/2001WR000861. [DOI] [Google Scholar]
- 58.Zhao, X., Li, Z. & Zhu, Q. Change of precipitation characteristics in the water-wind erosion crisscross region on the Loess Plateau, China, from 1958 to 2015. Sci. Rep. 7, 10.1038/s41598-017-08600-y (2017). [DOI] [PMC free article] [PubMed]
- 59.Zhao FF, Xu ZX, Huang JX, Li JY. Monotonic trend and abrupt changes for major climate variables in the headwater catchment of the Yellow river basin. Hydrol. Process. 2008;22:4587–4599. doi: 10.1002/hyp.7063. [DOI] [Google Scholar]
- 60.Tomé, A. R. & Miranda, P. M. A. Piecewise linear fitting and trend changing points of climate parameters. Geophys. Res. Lett. 31, 10.1029/2003GL019100 (2004).
- 61.Valdes-Abellan J, Pardo MA, Tenza-Abril AJ. Observed precipitation trend changes in the western Mediterranean region. Int. J. Climatol. 2017;37:1285–1296. doi: 10.1002/joc.4984. [DOI] [Google Scholar]
- 62.Zhu X, et al. Multi-decadal evolution characteristics of global surface temperature anomaly data shown by observation and CMIP5 models. Int. J. Climatol. 2018;38:1533–1542. doi: 10.1002/joc.5264. [DOI] [Google Scholar]
- 63.Zhang G, Zhang N, Liao W. How do population and land urbanization affect CO2 emissions under gravity center change? A spatial econometric analysis. J. Clean. Prod. 2018;202:510–523. doi: 10.1016/j.jclepro.2018.08.146. [DOI] [Google Scholar]
Associated Data
This section collects any data citations, data availability statements, or supplementary materials included in this article.
Supplementary Materials
Data Availability Statement
Daily meteorological dataset used in this study is available in the Data Center for Resources and Environmental Sciences, Chinese Academy of Sciences (http://www.resdc.cn). Monthly actual evapotranspiration and temperature datasets from the Global Land Data Assimilation System (GLDAS) are available from GES DISC Web site (https://disc.gsfc.nasa.gov/). The monthly and annual pan evaporation data are obtained from the corresponding author on reasonable request.


