

Abstract
Background and Aims:
Low serum 25-hydroxyvitamin D (25(OH)D) is associated with higher nonalcoholic fatty liver disease (NAFLD) risk in studies of mainly white participants. Significant racial/ethnic differences exist in serum 25(OH)D and NAFLD prevalence questioning extending this association to other racial/ethnic groups. We tested whether the association between serum 25(OH)D and NAFLD vary by race/ethnicity.
Methods and Results:
This was a cross-sectional analysis from the Multi-Ethnic Study of Atherosclerosis (MESA) that included 3,484 participants (44% male; 38.4% Whites, 27.8% African-Americans, 23.5% Hispanics, and 10.3% Chinese-Americans) who had serum 25(OH)D and upper abdominal CT images available at baseline. Serum 25(OH)D was measured by high-performance liquid chromatography–tandem mass spectrometry. NAFLD was identified if liver-to-spleen Hounsfield-Unit ratio was <1. Whites had the highest 25(OH)D level and African-Americans had the lowest level (mean±SD: 29.5±10.4 vs.19.9±9.1, respectively). Six hundred and eleven (17.5%) participants had NAFLD; Hispanics had the highest prevalence (26.2%) followed by Chinese-Americans (19.8%), Whites (15.8%) and African-Americans (11.7%), P<0.0001. In adjusted model, the association of 25(OH)D with NAFLD differed by race/ethnicity (P<0.0001). Negative association was only evident in Causations (OR (95% CI):1.23(1.03, 1.47) per 1 SD lower serum 25(OH)D). For other racial/ethnic groups, BMI, triglycerides, diabetic status and/or smoking, but not serum 25(OH)D, were common independent risk factors for NAFLD.
Conclusions:
The negative association between serum 25(OH)D and NAFLD in Whites may not be broadly generalizable to other racial/ethnic groups. Modifiable risk factors including BMI, triglycerides, diabetic status and/or smoking associate with NAFLD risk in non-white racial/ethnic groups beyond 25(OH)D.
Introduction
Growing evidence supports a functional impact of vitamin D beyond its well-recognized role in bone health. In addition of being expressed in bone, kidney and intestine, vitamin D receptors (VDR) have been identified in other locations including the immune, cardiovascular and endocrine systems, as well as the muscle, brain and liver tissues [1, 2], driving efforts to a wider vitamin D testing and supplementation over the last decade [3].
Risk for nonalcoholic fatty liver disease (NAFLD), the most common chronic liver condition [4, 5], has been linked to lower circulating concentrations of 25-hydroxyvitamin D (25(OH)D) [6], the major circulating metabolite and the most widely used indicator of vitamin D status [7]. Experimental studies have demonstrated a contribution of 1,25 dihydroxyvitamin D (the active vitamin D hormone) in the regulation of oxidative stress, the production of pro-inflammatory cytokines, hepatocyte apoptosis and liver fibrosis [8–11]. Interestingly, in a meta-analysis of 9 cross-sectional and case-control studies of 25(OH)D and NAFLD, NAFLD patients showed lower concentrations of serum 25(OH)D compared to controls [6]. However, all included studies evaluated populations that were mainly of White participants. Extrapolating results from these studies to other racial/ethnic groups may not be appropriate since concentrations and metabolism of vitamin D as well as the prevalence of NAFLD vary considerably by race/ethnicity. Whites are known to have higher serum concentrations of 25(OH)D than Hispanics and African-Americans, with the latter race/ethnic group have the lowest concentrations of serum 25(OH)D [12, 13]. Interestingly, there is also significant differences in NAFLD prevalence by racial/ethnic groups with Hispanics followed by Whites are having higher prevalence rates than African-Americans [14].
Whether the negative association reported between serum 25(OH)D and NAFLD applies similarly to different racial/ethnic groups is not known. Examining this question is critical to better guide the design of future clinical trials aiming to test vitamin D as a primary prevention therapeutic option among groups at risk of NAFLD.
The Multi-Ethnic Study of Atherosclerosis (MESA) provides a great opportunity to investigate effect modification of race/ethnicity on the association between 25(OH)D and NAFLD. We hypothesized that the association between serum 25(OH)D and NAFLD vary by race/ethnicity.
Materials/Subjects and Methods
Study Participants
MESA is a large prospective study examining the prevalence, correlates, and progression of subclinical atherosclerosis in a multiethnic cohort. The study design and methods were previously published [15]. Briefly, MESA included 6,814 participants (53% female) aged 45-84 years who were free of clinical CVD at baseline and self-identified as White, African-American, Hispanic, or Chinese-American across six US communities (Forsyth County, North Carolina; Northern Manhattan and the Bronx, New York; Baltimore City and Baltimore County, Maryland; St. Paul, Minnesota; Chicago, Illinois; and Los Angeles County, California) between 2000 to 2002. All participants provided informed consent, and the study protocol was approved by the institutional review board at each site.
For the current study, 3,964 participants from the baseline examination, with no history of heavy alcohol consumption (>14 drinks/week for men and >7 drinks/week for women), had available data on liver-to-spleen (L/S) Hounsfield Unit (HU) ratio and annualized serum 25(OH)D concentrations. Participants with self-reported liver disease (n=140), those on oral steroids (n=66), those with annualized 25(OH)D >100 ng/ml (n=4), and those with missing data (n=270) on any study covariate including age, sex, race, education, income, cigarette smoking, body mass index (BMI), high-density lipoprotein cholesterol (HDL-C), triglycerides, systolic blood pressure (SBP), diabetes, interleukin-6 (IL6), or C-reactive protein (CRP) were excluded, leaving 3,484 participants for the current analysis. Compared with those included, excluded participants were more likely to be older, African-Americans, current or former smokers and to report lower income. Additionally, they had higher SBP and inflammatory biomarkers, and lower serum triglycerides than those included (Appendix Table 1).
NAFLD Assessment
At the baseline examination, each participant underwent two consecutive non-enhanced cardiac-gated CT scans to measure coronary artery calcification. Scans of 64% of MESA participants included adequate images of the liver and spleen. All images were interpreted at the MESA CT reading center at the Los Angeles Biomedical Research Institute at Harbor-UCLA Medical Center. Two experienced readers assessed the scans independently blinded to the participant’s demographic data. The two scans from each participant were examined and the scan with the larger liver and spleen coverage was used to measure liver fat. Regions of interest (ROI) of more than 100 mm2 were identified in the liver and spleen. Larger ROIs were used whenever possible taking into consideration excluding non-uniform parenchymal attenuation, including blood vessels. Two ROIs were placed along the anterior-posterior dimension in the right liver lobe, one in the left liver lobe, and one in the spleen. Using these ROIs, HU attenuation were calculated for liver and spleen. As in previous work from MESA [16, 17], NAFLD was defined as L/S ratio <1.0. The L/S ratio was calculated by taking mean attenuation values of both right liver lobe ROIs and dividing it by the spleen’s attenuation value [18]. The measurements of liver and spleen HU attenuations were highly reproducible (0.96, 0.99 and 0.99, 0.99 for intra- and inter-reader variability, respectively) in a sample of 100 scans [18].
Serum 25-hydroxyvitamin D (25(OH)D) Concentration
Morning blood samples were obtained as part of the baseline MESA examination after an overnight fast. The samples were stored at −80°C before shipping to the University of Washington for analysis in 2011. 25(OH)D is stable during long-term storage at −80°C (19). Total 25(OH)D (sum of 25(OH)D2 and 25(OH)D3) was measured using high-performance liquid chromatography–tandem mass spectrometry on a Waters Quattro Micro mass spectrometer (Waters, Milford, MA) [13]. The standard reference material 972 of the National Institute of Standards and Technology was used to verify the calibration [20]. The inter-assay coefficient of variation was 4.35% at 9.7 ng/mL for 25(OH)D2 and 4.4% at 10.4 ng/mL for 25(OH)D3. Subject-specific mean annual 25(OH)D concentrations were estimated from a single value to account for season variability using a validated cosinor model as previously described [13].
Other Study Variables
All covariates were ascertained at the baseline MESA examination, concurrent with CT imaging and serum 25(OH)D measurement. These included socio-demographic characteristics, medical history, anthropometric measurements, and laboratory data. Participants’ education was categorized as having completed high school education or less, holding a college, technical, or associate degrees, or holding a bachelor’s degree or more. Income per year was coded as low income (≤$49,999), medium income ($50,000-74,999), or high income (≥ $75,000). Smoking status was coded as never, former or current smoker. BMI was calculated as weight (kilograms)/height2 (meters2). Waist circumference was measured in cm at the level of the umbilicus to calculate Waist-to-Hip ratio. SBP was measured three times using an automated sphygmomanometer while seated, and the mean of the last two measurements was used. Serum glucose was measured by rate reflectance spectrophotometry using thin film adaptation of the glucose oxidase method on the Vitros analyzer (Johnson & Johnson Clinical Diagnostics, Inc., Rochester, NY 14650) at Fairview-University Medical Center (Minneapolis, MN).
Hypertension was defined as having SBP ≥140 mmHg, DBP ≥90 mmHg, or taking medications for high blood pressure. Diabetes was defined as the use of insulin or oral hypoglycemic medications or a fasting glucose level of ≥126 mg/dL. Total and HDL-C and triglycerides were measured at a central laboratory (Fairview-University Medical Center, Minneapolis, MN) after a 12-h fast. Low-density lipoprotein cholesterol (LDL-C) was calculated using the Friedewald equation [21]. CRP was measured using the BNII nephelometer (N High Sensitivity CRP; Dade Behring Inc., Deerfield, IL) at the Laboratory for Clinical Biochemistry Research (University of Vermont, Burlington, VT). IL-6 was measured by ultra-sensitive ELISA (Quantikine HS Human IL-6 Immunoassay; R&D Systems, Minneapolis, MN) at the Laboratory for Clinical Biochemistry Research (University of Vermont, Burlington, VT). Serum phosphorus was measured using a timed-rate colorimetry reaction. Serum parathyroid hormone (PTH) was quantified using a 2-site immunoassay on a Beckman Access2 clinical analyzer (Beckman-Coulter, Inc, Brea, CA).
Metabolic syndrome was defined according to revised National Cholesterol Education Program Adult Treatment Panel (NCEP ATP) III criteria [22]. Participants having at least three of the following criteria were considered as having MetSyn: fasting plasma glucose ≥ 100 mg/dL; triglycerides ≥ 150 mg/dL; HDL-C < 40 mg/dL in men and < 50 mg/dL in women; abdominal obesity [waist circumference (WC) ≥ 102 cm in men and ≥ 88 cm in women]; and blood pressure ≥ 130/85 mm Hg.
Statistical Analysis
Characteristics of the study participants overall, by NAFLD status, and by race/ethnicity groups were summarized using percentages/frequencies for categorical variables and mean ± SD or median (Q1, Q3) for continuous variables. Differences by groups were assessed using χ2 test for categorical measures or Student’s t test, ANOVA, or corresponding non-parametric tests for continuous measures, as appropriate. P-values for multiple comparisons were adjusted using Tukey’s method. Multivariable logistic regression was used to assess the relationship between NAFLD presence and annualized serum 25(OH)D with odds ratios (OR) and 95% confidence intervals of NAFLD risk were estimated per one standard deviation decrease in annualized serum 25(OH)D. The model building strategy was based on a priori selection of common risk factors for 25(OH)D and NAFLD and guided by univariate analyses of study covariates with 25(OH)D (Appendix Table 2) and NAFLD. Initial model included age, sex, race/ethnicity, income, education, and study site. Since adiposity is a strong confounder, the next model further adjusted for either BMI or waist-hip ratio; model with BMI was found to explain more of the variance in NAFLD using the C and R2 statistics. Final presented model was additionally adjusted for HDL-C, triglycerides, SBP, smoking status, diabetes, and inflammatory markers (IL-6 and CRP). A comparative model replacing BMI, HDL-C, triglycerides, SBP, and diabetes with the presence of metabolic syndrome was assessed in an effort to present a more parsimonious model. This comparative model did not better fit the data analyzing 25(OH)D as a continuous measure, data not shown.
Effects modification of race/ethnicity on the association between 25(OH)D and NAFLD was tested, and the predicted probabilities with 95% confidence intervals of NAFLD presence at different concentrations of annualized serum 25(OH)D by race/ethnicity were estimated from final model and graphed for a clear visualization of significant interaction. Results were stratified by race/ethnicity adjusting for all covariates in final model.
Since 53% of MESA participants were female, we further assessed effect modification by sex. Additional analyses evaluated the effect of 25(OH)D on NAFLD by using clinically relevant categories of vitamin D deficiency that have been previously published: 30 ng/mL or more (reference group), 20-29 ng/mL (vitamin D insufficiency), and less than 20 ng/mL (vitamin D deficiency) [23]. We used similar model building strategy as described in the main analysis to build these additional models.
All statistical analyses were conducted using SAS version 9.4; SAS Institute, Inc., Cary, North Carolina and STATA (StataCorp: Release 13. College Station, TX: StataCorp LLC) with significance was set at P < 0.05.
Results
Characteristics of the study participants overall and by NAFLD status are presented in Table 1. Appendix Table 3 provides participants’ characteristics by race/ethnicity.
Table 1.
Characteristics of the Study Participants Overall and by NAFLD Status
| Study Variable | Total n=3,484 | NAFLD | P-value | |
|---|---|---|---|---|
| Yes n=611 (17.5%) |
No n=2,873 (82.5%) |
|||
| Age (years), Mean±SD | 62.7±10.4 | 60.9±9.7 | 63.1±10.6 | <0.0001 |
| Male, n(%) | 1519 (43.6) | 1245 (43.3) | 274 (44.8) | 0.49 |
| Race/Ethnicity, n(%) | <0.0001 | |||
| White | 1338(38.4) | 212(34.7) | 1126(39.2) | |
| Chinese-American | 359(10.3) | 71(11.6) | 228(10.0) | |
| African-American | 967(27.8) | 113(18.5) | 854(29.7) | |
| Hispanic | 820(23.5) | 215(35.2) | 605(21.1) | |
| Education, n(%) | 0.001 | |||
| ≤High school education | 1297(37.2) | 266(43.5) | 1031(35.9) | |
| Some college/technical/associate degree | 1012(29.1) | 171(28.0) | 841(29.3) | |
| ≥Bachelor’s degree | 1175(33.7) | 174(28.5) | 1001(34.8) | |
| Income, n(%) | 0.12 | |||
| Low income | 2179(62.5) | 397(65.0) | 1782(62.0) | |
| Medium income | 601(17.3) | 109(17.8) | 492(17.1) | |
| High income | 704(20.2) | 105(17.2) | 599(20.9) | |
| BMI (kg/m2), Mean±SD | 28.5±5.3 | 31.2±5.4 | 28.0±5.1 | <0.0001 |
| Waist circumference (cm), Mean±SD | 98.7±14.0 | 105.8±13.3 | 97.1±13.6 | <0.0001 |
| Waist-hip ratio, Mean±SD | 0.9±0.1 | 1.0±0.1 | 0.9±0.1 | <0.0001 |
| SBP (mmHg), Mean±SD | 126.7±21.4 | 129.2±20.5 | 126.2±21.5 | 0.001 |
| Glucose (mg/dL), Median (Q1, Q3) | 90(83,99) | 96(88,114) | 89(82, 97) | <0.0001 |
| Total cholesterol (mg/dl), Mean±SD | 194.8±35.8 | 195.9±38.8 | 194.6±35.2 | 0.43 |
| Triglycerides (mg/dl), Median (Q1, Q3) | 113(78,162) | 153(107,211) | 106(75,153) | <0.0001 |
| LDL-C (mg/dl), Mean±SD | 118.0±31.4 | 116.9±30.9 | 118.2±31.4 | 0.36 |
| HDL-C (mg/dl), Mean±SD | 50.5±14.5 | 44.8±12.0 | 51.7±14.7 | <0.0001 |
| Smoking Status, n(%) | 0.17 | |||
| Never | 1867(53.6) | 347(56.8) | 1520(52.9) | |
| Former | 1240(35.6) | 198(32.4) | 1042(36.3) | |
| Current | 377(10.8) | 66(10.8) | 311(10.8) | |
| Hypertension, n(%) | 1704(48.9) | 339(55.5) | 1365(47.5) | 0.0003 |
| Diabetes, n(%) | 446(12.8) | 132(21.6) | 314(10.9) | <0.0001 |
| Metabolic Syndrome, n(%) | 1331(38.2) | 396(64.8) | 935(32.5) | <0.0001 |
| IL-6 (pg/mL), Median (Q1, Q3) | 1.25 (0.8, 1.9) | 1.51 (1.0, 2.3) | 1.20 (0.8, 1.8) | <0.0001 |
| CRP (mg/L), Median (Q1, Q3) | 1.94 (0.9, 4.3) | 3.0 (1.4, 6.4) | 1.74 (0.8, 3.9) | <0.0001 |
| Taking calcium supplement, n(%) | 1466(42.1) | 213(34.9) | 1253(43.6) | <0.0001 |
| Phosphorus serum concentration (mg/dl), Mean±SD | 3.7±0.5 | 3.7±0.5 | 3.7±0.5 | 0.22 |
| Parathyroid hormone (pg/ml), Mean±SD | 45.5±22.8 | 46.4±18.8 | 45.3±23.6 | 0.22 |
| Annualized 25(OH)D (ng/mL), Mean±SD | 25.3±10.4 | 24.1±10.0 | 25.5±10.5 | 0.002 |
| Vitamin D deficiency; 25(OH)D <20 (ng/ml), n(%) | 1174(33.7) | 229(37.5) | 945(32.9) | 0.03 |
| Liver/Spleen HU ratio, Median (Q1, Q3) | 1.32 (1.06, 1.32) | 0.86 (0.72, 0.93) | 1.24 (1.14, 1.35) | <0.0001 |
Abbreviations: BMI, body-mass index; CRP, C-reactive protein; HDL-C, high density lipoprotein cholesterol; HU, Hounsfield unit; IL-6, Interleukin 6; LDL-C, low density lipoprotein cholesterol; SD, standard deviation; SBP, systolic blood pressure.
NAFLD was present among 17.5% (n=611) of the participants; with Hispanics showing the highest prevalence rate followed by Chinese-Americans, Whites and African-Americans, (Figure 1). Annualized serum 25(OH)D significantly varied by race/ethnicity (Figure 2); with Whites having the highest concentrations and African-Americans having the lowest concentrations.
Figure 1.

Unadjusted NAFLD Prevalence by Race/Ethnicity in the Analytical Sample
Figure 2. Unadjusted Means of Annualized Serum 25(OH)D by Race/Ethnicity *†.

* Error bars represent standard deviations of the estimated means
† All pairwise comparisons are significant at P=0.05 level adjusting for multiple comparisons using Tukey’s method
25(OH)D and Odds of NAFLD
The association between 25(OH)D and NAFLD differed significantly by race/ethnicity in unadjusted and final models, all P<0.01. The predicted probabilities of NAFLD presence at different concentrations of annualized serum 25(OH)D by race/ethnicity groups are shown in Figure 3. An inverse association between 25(OH)D and probability of NAFLD was observed in Whites, while a positive association was observed in African-Americans. Table 2 shows the racial/ethnic stratification analyses for associations between annualized serum 25(OH)D and NAFLD in final model. Significant inverse association was present only in Causations; such that lower 25(OH)D was significantly associated with higher odds of NAFLD (adjusted OR (95% CI):1.23(1.03, 1.47) per 1 SD decrease in serum 25(OH)D). For other racial/ethnic groups, BMI, triglycerides, diabetic status and/or smoking, but not serum 25(OH)D, were common independent risk factors for NAFLD.
Figure 3. Predicted Probabilities of NAFLD Presence at Different Concentrations of Annualized Serum 25(OH)D by Race/Ethnicity *.
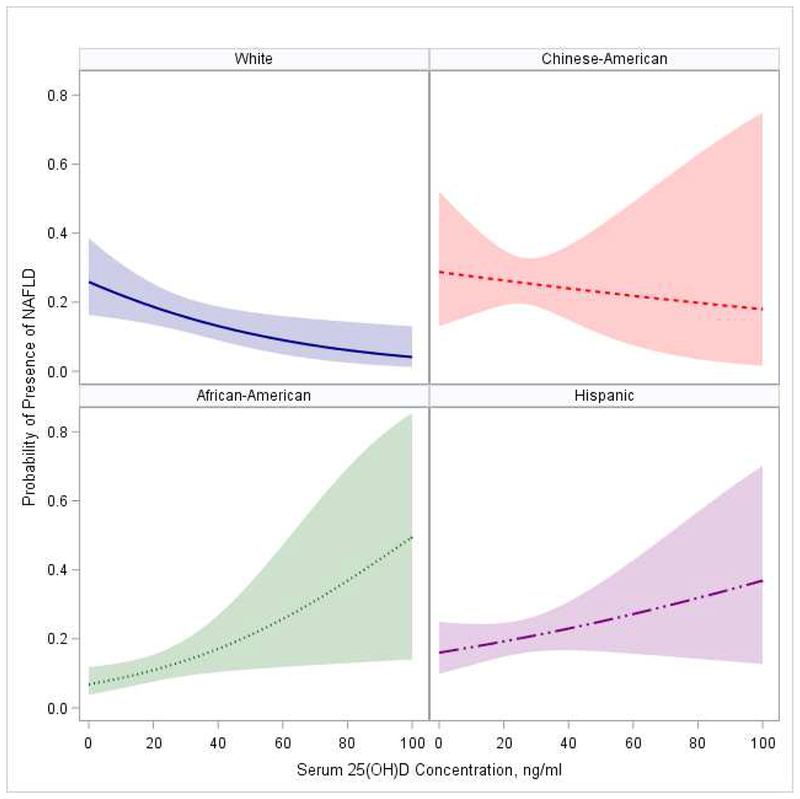
* P value for interaction between 25(OH)D and race=0.004. Model adjusted for age, sex, income, education, study site, BMI, HDL-C, triglycerides, SBP, smoking, diabetes, IL-6 and CRP
Table 2.
Racial/ethnic Stratification Analyses for Associations Between Annualized Serum 25(OH)D and NAFLD
| Adjusted model * | White | Chinese-American | African-American | Hispanic |
|---|---|---|---|---|
| OR (95%CI) | OR (95%CI) | OR (95%CI) | OR (95%CI) | |
| 25(OH)D†, per 1 SD ↓ | 1.23(1.03, 1.47) | 1.06(0.71, 1.58) | 0.84(0.65, 1.08) | 0.86(0.70, 1.06) |
| Age, per 1 year ↑ | 0.97(0.95, 0.99) | 0.99(0.95, 1.02) | 1.00(0.98, 1.02) | 0.96(0.94, 0.98) |
| BMI, per 1 Kg/m2 ↑ | 1.08(1.05, 1.12) | 1.17(1.05, 1.29) | 1.06(1.01, 1.11) | 1.11(1.06, 1.15) |
| HDL-C, per 1 mg/dL ↑ | 0.98(0.96,0.99) | 1.00(0.98, 1.03) | 0.98(0.96,0.99) | 0.98(0.96,0.99) |
| Log Triglyceride, per 1 log unit ↑ | 1.80(1.26, 2.56) | 2.96(1.46, 5.99) | 1.73(1.06,2.81) | 2.07(1.39, 3.10) |
| SBP, per 1 mmHg unit ↑ | 1.01(1.001,1.02) | 1.00(0.99, 1.02) | 1.00(0.99, 1.01) | 1.01(1.00, 1.02) |
| Smoking status (Ref=never) | ||||
| Former | 0.90(0.64, 1.28) | 0.65(0.25, 1.70) | 0.86(0.55, 1.33) | 0.57(0.38, 0.87) |
| Current | 1.02(0.59, 1.78) | 1.83(0.48, 7.02) | 0.36(0.16, 0.80) | 0.56(0.32,1.00) |
| Diabetes, (Ref=no) | 1.67(0.98, 2.85) | 2.33(1.06, 5.12) | 1.83(1.13, 2.95) | 1.11(0.71, 1.73) |
| Log CRP, per 1 log unit ↑ | 1.25(1.03, 1.50) | 1.27(0.90, 1.79) | 1.26(1.00, 1.59) | 1.15(0.93, 1.42) |
In addition to listed variables, adjusted for study site, sex, education, income, and log IL-6. None of these additional covariates were found to be significantly associated with risk of NAFLD
SD of 25(OH)D for White= 10.4, Chinese-American=8.2, African-American=9.1, and Hispanic=9.5.
Abbreviations: BMI, body-mass index; CRP, C-reactive protein; HDL-C, high density lipoprotein cholesterol; 1L-6, Interleukin 6; SD, standard deviation; SBP, systolic blood pressure.
Additional Analyses
Sex did not modify the association between NAFLD and 25(OH)D in unadjusted or adjusted models, data not shown. Results evaluating 25(OH)D as categories of normal, insufficiency, and deficiency were comparable to the main results, although the race/ethnic interaction became marginally significant P=0.05 in final model adjusting for age, sex, race/ethnicity, income, education, study site, BMI, HDL-C, triglycerides, SBP, smoking status, diabetes, and inflammatory markers. Stratification analysis showed a significant linear trend of 25(OH)D categories on NAFLD risk only in Whites in model replacing BMI, HDL-C, triglycerides, SBP, and diabetes with metabolic syndrome. This model was found to better fit the data analyzing 25(OH)D as a categorical variable in White participants (Appendix Table 4).
Discussion
The current study underscores the importance of considering race/ethnicity when assessing whether lower level of serum 25(OH)D is associated with greater risk of NAFLD. Our results demonstrated that such an association is not universal across the different racial/ethnic groups. The probability of NAFLD presence at lower concentrations of serum 25(OH)D was high in White and Chinese-American, but low in African-American and Hispanic participants. The reported association between serum 25(OH)D and NAFLD was independent of cardio-metabolic factors in Whites only. Diabetic, smoking status, and higher BMI and triglycerides, but not concentrations of 25(OH)D, were common independent factors associated with higher NAFLD risk in racial/ethnic groups other than Whites. The findings raise attention for the importance of personalizing preventive efforts among groups with different racial/ethnic origin at high risk for NAFLD.
To the best of our knowledge, this is the first large community-dwelling multi-racial/ethnic assessment of the association between serum 25(OH)D and NAFLD risk. Several other studies assessed similar association, however in populations of mainly White or Asian participants [6, 24–29]. None of these studies had the capacity to compare the risk across multiple racial/ethnic groups as we have done. Results from these studies were consistent with our findings among Whites showing an independent association of lower concentrations of serum 25(OH)D and greater NAFLD risk.
Several lines of evidence support a link between vitamin D concentrations and liver conditions. Serum 25(OH)D concentrations is associated with the histological severity of biopsy-confirmed NAFLD [7, 30]. Vitamin D directly regulates free fatty acid metabolism preventing their surplus flow in bloodstream that could promote fat storage into the liver [29]. Moreover, vitamin D may modulate immune system and induce inflammatory and anti-fibrogenic responses in liver [31–34]. In experimental studies, vitamin D inhibited the hepatic expression of pro-fibrotic mediators [31, 32] and suppressed the expression of collagen, α-smooth muscle actin and tissue inhibitors of metalloproteinase-1[32]. In animal studies, vitamin D deficient diet induced greater expression of hepatic mRNA levels of IL-4, IL-6, or TNF-α (9). Furthermore, vitamin D may modulate the liver glucose uptake [8] and insulin sensitivity [35–37] Significant associations were reported between low circulating 25(OH)D concentrations and obesity, type 2 diabetes and insulin resistance relevant conditions [38–41]. Finally, vitamin D may have a direct role in liver conditions as supported via the presence of VDR in liver. In human, VDR expression was inversely correlated with severity of NAFLD histopathology [42].
Our study suggested a different direction of the association between serum 25(OH)D and NAFLD risk by racial/ethnic groups. Lower concentrations of serum 25(OH)D was associated with higher risk of NAFLD in Whites and Chinese-Americans, but lower risk in African-Americans and Hispanics. The reported association was independent of cardio-metabolic factors in Whites only. Finding different patterns of the association between 25(OH)D and NAFLD across racial/ethnic groups was in line with prior studies assessing associations of 25(OH)D concentrations with other health conditions in multi-racial/ethnic populations. Interestingly, lower concentrations of 25(OH)D was associated with lower bone mineral density and greater fracture, diabetes and stroke risks in White participants; associations that were weak or not observed in African-American who are known to have the lowest concentrations of 25(OH)D [38, 43–47]. Similarly, in a prior work from MESA, lower 25(OH)D concentrations were associated with greater risk of incident CHD among Whites and Chinese-Americans but not African-Americans or Hispanics [48].
The reason for the inconsistent patterns of the association between serum 25(OH)D and risk of NAFLD across different racial/ethnic groups is not clear. Multiple factors might contribute to this discrepancy including racial/ethnic differences in vitamin D metabolism. Compared to Whites, African-American had higher concentrations of the biologically active metabolite1,25-dihydroxyvitamin D, despite their lower concentrations of 25(OH)D [38]. The reported lower risk of NAFLD at lower concentrations of 25(OH)D in African-American in the current study might be explained by the underlying higher concentrations of the biologically active metabolite of vitamin D among this racial group. 1,25-dihydroxyvitamin D metabolite of 25(OH)D can suppress the renin-angiotensin system and modulate the immune system through reducing chronic inflammation and abnormal cell production [49–52]. Identifying the best metric to reflect accurate concentrations of vitamin D in different racial/ethnic groups is an active research area [53].
Alternatively, it might be the VDR affinity, and vitamin D binding proteins to vitamin D metabolites rather than which metabolite to measure that is matter. Common genetic polymorphisms in VDR were found to modulate associations between serum 25(OH)D and risk of a composite clinical outcome among older White adults [54]. Interestingly, VDR polymorphisms distribution differed by race/ethnicity [55–57], and genetic polymorphisms in vitamin D binding proteins accounted for greater proportion of variation in 25(OH)D concentrations than other known modulating factors [58]. Finally, it is possible that there could be alteration in vitamin D hydroxylation in liver in people with higher risk of NAFLD [53].
The direct clinical implication of the current study is that lower concentrations of the current marker for vitamin D status, serum 25(OH)D may not be universally associated with greater risk of NAFLD in populations with different racial/ethnic origins. Our study confirmed this association among White only suggesting increasing concentrations of serum 25(OH)D might be beneficial in Whites. On the other hand, our study did not support same association in African-American or Hispanic participants but rather suggested a harmful association at higher concentrations of serum 25(OH)D. A recent expert panel meeting report concluded that higher concentrations of the current marker for vitamin D status, serum 25(OH)D are almost certain to result in adverse effects in African-American populations [53]. Future clinical trial testing efficacy of enhancing vitamin D concentrations on risk of NAFLD should be tailored toward Whites and probably Chinese-Americans as suggested by our study. Additionally, efficacy for lifestyle modification vs. enhancing vitamin D concentrations should be tested in racial/ethnic groups other than Whites.
Main limitations of the current work included the cross-sectional design of the study preventing us from establishing any temporality. It is also possible that NAFLD contributes to lower concentrations of serum 25(OH)D. Longitudinal studies are needed to help understand the causal pathway. Additionally, we assessed association of total rather than bioavailable 25(OH)D, which may better reflect concentrations of vitamin D in certain racial/ethnic groups and show different association. MESA did not collect data on vitamin D supplementations, however we excluded those with annualized 25(OH)D >100 ng/ml to potentially accounts for very high values that could be potentially a result of vitamin D supplements use. NAFLD was not histologically confirmed. However, the utilized method of liver/spleen ratio is less invasive and more appropriate in epidemiologic studies of general population [59]. This method has been studied in comparison to histological analyses and showed high sensitivity [60]. The prevalence of NAFLD reported in our study is only limited to similar studies using same approach to identify presence of NAFLD in population-based studies. Major strengths included utilizing the baseline exam of a large community-dwelling study across 6 sites in the US with available data on large range of potential confounders. Moreover, we estimated mean annual serum 25(OH)D level from a single measurement to account for seasonal variation.
In conclusion, the negative association between 25(OH)D and NAFLD in Whites may not be broadly generalizable to other racial/ethnic groups. Modifiable risk factors including BMI, triglycerides, diabetic status and/or smoking associate with NAFLD risk in racial/ethnic groups other than Whites beyond concentration of 25(OH)D. Preventive efforts focusing on vitamin D level enhancement should not be assumed to be effective among all populations of different racial/ethnic groups.
Supplementary Material
Association of 25(OH)D with NAFLD differed by race/ethnicity.
Higher serum 25(OH)D associated with lower NAFLD risk only in Whites.
The protective link of higher 25(OH)D with lower NAFLD risk may not be universal.
Other modifiable risk factors may be more vital in reducing NAFLD risk in non-white racial/ethnic groups.
Acknowledgements:
This research was supported by R01 HL071739 and MESA was supported by contracts N01-HC-95159, N01-HC-95160, N01-HC-95161, N01-HC-95162, N01-HC-95163, N01-HC-95164, N01-HC-95165, N01-HC-95166, N01-HC-95167, N01-HC-95168 and N01-HC-95169 from the National Heart, Lung, and Blood Institute, and by grants UL1-TR-000040, UL1 TR 001079, and UL1-RR-025005 from National Center for Research Resources, and by grants UL1-TR-000040, UL1 TR 001079, and UL1-RR-025005 from National Center for Research Resources. The authors thank the other investigators, the staff, and the participants of the MESA study for their valuable contributions. A full list of participating MESA investigators and institutions can be found at http://www.mesa-nhlbi.org.
Competing Interests Statement:
Drs. El Khoudary, Zeb, Foster, de Boer, and Li, and Mr. Samargandy have nothing to disclose. Dr. Budoff receives research grant from NIHJ and General Electric.
Conflict of Interest form
All authors have nothing to disclose except for Dr. Budoff who receives research grant from NIHJ and General Electric.
Footnotes
Publisher's Disclaimer: This is a PDF file of an unedited manuscript that has been accepted for publication. As a service to our customers we are providing this early version of the manuscript. The manuscript will undergo copyediting, typesetting, and review of the resulting proof before it is published in its final citable form. Please note that during the production process errors may be discovered which could affect the content, and all legal disclaimers that apply to the journal pertain.
References
- 1.Lockau L, Atkinson SA. Vitamin D’s role in health and disease: How does the present inform our understanding of the past? International journal of paleopathology. 2018;23:6–14. [DOI] [PubMed] [Google Scholar]
- 2.Verstuyf A, Carmeliet G, Bouillon R, Mathieu C. Vitamin D: a pleiotropic hormone. Kidney Int. 2010;78(2):140–5. [DOI] [PubMed] [Google Scholar]
- 3.Berger C, Greene-Finestone LS, Langsetmo L, Kreiger N, Joseph L, Kovacs CS, et al. Temporal trends and determinants of longitudinal change in 25-hydroxyvitamin D and parathyroid hormone levels. J Bone Miner Res. 2012;27(6):1381–9. [DOI] [PMC free article] [PubMed] [Google Scholar]
- 4.Williams CD, Stengel J, Asike MI, Torres DM, Shaw J, Contreras M, et al. Prevalence of nonalcoholic fatty liver disease and nonalcoholic steatohepatitis among a largely middle-aged population utilizing ultrasound and liver biopsy: a prospective study. Gastroenterology. 2011. ;140(1):124–31. [DOI] [PubMed] [Google Scholar]
- 5.Lazo M, Hernaez R, Eberhardt MS, Bonekamp S, Kamel I, Guallar E, et al. Prevalence of nonalcoholic fatty liver disease in the United States: the Third National Health and Nutrition Examination Survey, 1988-1994. Am J Epidemiol. 2013;178(1):38–45. [DOI] [PMC free article] [PubMed] [Google Scholar]
- 6.Eliades M, Spyrou E, Agrawal N, Lazo M, Brancati F, Potter J, et al. Meta-analysis: vitamin D and non-alcoholic fatty liver disease. Aliment Pharmacol Ther. 2013;38(3):246–54. [DOI] [PubMed] [Google Scholar]
- 7.Eliades M, Spyrou E. Vitamin D: a new player in non-alcoholic fatty liver disease? World J Gastroenterol. 2015;21(6):1718–27. [DOI] [PMC free article] [PubMed] [Google Scholar]
- 8.George N, Kumar TP, Antony S, Jayanarayanan S, Paulose C. Effect of vitamin D 3 in reducing metabolic and oxidative stress in the liver of streptozotocin-induced diabetic rats. Br J Nutr. 2012;108(8):1410–8. [DOI] [PubMed] [Google Scholar]
- 9.Roth CL, Elfers CT, Figlewicz DP, Melhorn SJ, Morton GJ, Hoofnagle A, et al. Vitamin D deficiency in obese rats exacerbates nonalcoholic fatty liver disease and increases hepatic resistin and Toll-like receptor activation. Hepatology. 2012;55(4): 1103–11. [DOI] [PubMed] [Google Scholar]
- 10.Zhang A, Wang Y, Xie H, Zheng S. Calcitriol inhibits hepatocyte apoptosis in rat allograft by regulating apoptosis-associated genes. Int Immunopharmacol. 2007;7(8):1122–8. [DOI] [PubMed] [Google Scholar]
- 11.Potter JJ, Liu X, Koteish A, Mezey E. 1, 25-dihydroxyvitamin D3 and its nuclear receptor repress human α1 (I) collagen expression and type I collagen formation. Liver International. 2013;33(5):677–86. [DOI] [PMC free article] [PubMed] [Google Scholar]
- 12.Zadshir A, Tareen N, Pan D, Norris K, Martins D. The prevalence of hypovitaminosis D among US adults: data from the NHANES III. Ethn Dis. 2005;15(4):S5. [PubMed] [Google Scholar]
- 13.Sachs MC, Shoben A, Levin GP, Robinson-Cohen C, Hoofnagle AN, Swords-Jenny N, et al. Estimating mean annual 25-hydroxyvitamin D concentrations from single measurements: the Multi-Ethnic Study of Atherosclerosis. The American journal of clinical nutrition. 2013;97(6):1243–51. [DOI] [PMC free article] [PubMed] [Google Scholar]
- 14.Lonardo A, Bellentani S, Argo C. Non-alcoholic fatty liver disease (NAFLD) study group, dedicated to the memory of Prof. Paola Loria. Epidemiological modifiers of non-alcoholic fatty liver disease: focus on high-risk groups Dig Liver Dis. 2015;47:997–1006. [DOI] [PubMed] [Google Scholar]
- 15.Bild DE, Bluemke DA, Burke GL, Detrano R, Diez Roux AV, Folsom AR, et al. Multi-Ethnic Study of Atherosclerosis: Objectives and Design. Am J Epidemiol. 2002;156(9):871–81. [DOI] [PubMed] [Google Scholar]
- 16.Al Rifai M, Silverman MG, Nasir K, Budoff MJ, Blankstein R, Szklo M, et al. The association of nonalcoholic fatty liver disease, obesity, and metabolic syndrome, with systemic inflammation and subclinical atherosclerosis: the Multi-Ethnic Study of Atherosclerosis (MESA). Atherosclerosis. 2015;239(2):629–33. [DOI] [PMC free article] [PubMed] [Google Scholar]
- 17.Remigio-Baker RA, Allison MA, Forbang NI, Loomba R, Anderson CA, Budoff M, et al. Race/ethnic and sex disparities in the non-alcoholic fatty liver disease-abdominal aortic calcification association: The Multi-Ethnic Study of Atherosclerosis. Atherosclerosis. 2017;258:89–96. [DOI] [PMC free article] [PubMed] [Google Scholar]
- 18.Zeb I, Li D, Nasir K, Katz R, Larijani VN, Budoff MJ. Computed tomography scans in the evaluation of fatty liver disease in a population based study: the multi-ethnic study of atherosclerosis. Acad Radiol. 2012;19(7):811–8. [DOI] [PMC free article] [PubMed] [Google Scholar]
- 19.Agborsangaya* C, Toriola* AT, Grankvist K, Surcel H-M, Holl K, Parkkila S, et al. The effects of storage time and sampling season on the stability of serum 25-hydroxy vitamin D and androstenedione. Nutr Cancer. 2009;62(1):51–7. [DOI] [PubMed] [Google Scholar]
- 20.Phinney KW. Development of a standard reference material for vitamin D in serum. Am J Clin Nutr. 2008;88(2):511s–2s. [DOI] [PubMed] [Google Scholar]
- 21.Friedewald WT, Levy RI, Fredrickson DS. Estimation of the concentration of low-density lipoprotein cholesterol in plasma, without use of the preparative ultracentrifuge. Clinical chemistry. 1972;18(6):499–502. [PubMed] [Google Scholar]
- 22.Grundy SM, Brewer HB Jr, Cleeman JI, Smith SC Jr, Lenfant C. Definition of metabolic syndrome: report of the National Heart, Lung, and Blood Institute/American Heart Association conference on scientific issues related to definition. Circulation. 2004;109(3):433–8. [DOI] [PubMed] [Google Scholar]
- 23.Holick MF, Binkley NC, Bischoff-Ferrari HA, Gordon CM, Hanley DA, Heaney RP, et al. Evaluation, treatment, and prevention of vitamin D deficiency: an Endocrine Society clinical practice guideline. The Journal of Clinical Endocrinology & Metabolism. 2011;96(7):1911–30. [DOI] [PubMed] [Google Scholar]
- 24.Lu Z, Pan X, Hu Y, Hao Y, Luo Y, Hu X, et al. Serum vitamin D levels are inversely related with non-alcoholic fatty liver disease independent of visceral obesity in Chinese postmenopausal women. Clin Exp Pharmacol Physiol. 2015;42(2):139–45. [DOI] [PubMed] [Google Scholar]
- 25.Seo JA, Eun CR, Cho H, Lee SK, Yoo HJ, Kim SG, et al. Low vitamin D status is associated with nonalcoholic Fatty liver disease independent of visceral obesity in Korean adults. PLoS One. 2013;8(10):e75197. [DOI] [PMC free article] [PubMed] [Google Scholar]
- 26.Rhee E-J, Kim MK, Park SE, Park C-Y, Baek KH, Lee W-Y, et al. High serum vitamin D levels reduce the risk for nonalcoholic fatty liver disease in healthy men independent of metabolic syndrome. Endocr J. 2013;60(6):743–52. [DOI] [PubMed] [Google Scholar]
- 27.Hao YP, Ma XJ, Luo YQ, Ni J, Dou JX, Hu YQ, et al. Serum vitamin D is associated with non-alcoholic fatty liver disease in Chinese males with normal weight and liver enzymes. Acta Pharmacol Sin. 2014;35(9):1150–6. [DOI] [PMC free article] [PubMed] [Google Scholar]
- 28.Jablonski KL, Jovanovich A, Holmen J, Targher G, McFann K, Kendrick J, et al. Low 25-hydroxyvitamin D level is independently associated with non-alcoholic fatty liver disease. Nutr Metab Cardiovasc Dis. 2013;23(8):792–8. [DOI] [PMC free article] [PubMed] [Google Scholar]
- 29.Barchetta I, Angelico F, Del Ben M, Baroni MG, Pozzilli P, Morini S, et al. Strong association between non alcoholic fatty liver disease (NAFLD) and low 25(OH) vitamin D levels in an adult population with normal serum liver enzymes. BMC Med. 2011. ;9:85 Epub 2011/07/14. doi: 10.1186/1741-7015-9-85.. [DOI] [PMC free article] [PubMed] [Google Scholar]
- 30.Targher G, Bertolini L, Scala L, Cigolini M, Zenari L, Falezza G, et al. Associations between serum 25-hydroxyvitamin D3 concentrations and liver histology in patients with non-alcoholic fatty liver disease. Nutr Metab Cardiovasc Dis. 2007;17(7):517–24. [DOI] [PubMed] [Google Scholar]
- 31.Beilfuss A, Sowa J-P, Sydor S, Beste M, Bechmann LP, Schlattjan M, et al. Vitamin D counteracts fibrogenic TGF-β signalling in human hepatic stellate cells both receptor-dependently and independently. Gut. 2015;64(5):791–9. [DOI] [PubMed] [Google Scholar]
- 32.Abramovitch S, Dahan-Bachar L, Sharvit E, Weisman Y, Tov AB, Brazowski E, et al. Vitamin D inhibits proliferation and profibrotic marker expression in hepatic stellate cells and decreases thioacetamide-induced liver fibrosis in rats. Gut. 2011:gut. 2010.234666. [DOI] [PubMed] [Google Scholar]
- 33.Abramovitch S, Sharvit E, Weisman Y, Bentov A, Brazowski E, Cohen G, et al. Vitamin D inhibits development of liver fibrosis in an animal model but cannot ameliorate established cirrhosis. American Journal of Physiology-Gastrointestinal and Liver Physiology. 2014;308(2):G112–G20. [DOI] [PubMed] [Google Scholar]
- 34.Ding N, Ruth TY, Subramaniam N, Sherman MH, Wilson C, Rao R, et al. A vitamin D receptor/SMAD genomic circuit gates hepatic fibrotic response. Cell. 2013;153(3):601–13. [DOI] [PMC free article] [PubMed] [Google Scholar]
- 35.Zhou QG, Hou FF, Guo ZJ, Liang M, Wang GB, Zhang X. 1, 25-Dihydroxyvitamin D improved the free fatty-acid-induced insulin resistance in cultured C2C12 cells. Diabetes Metab Res Rev. 2008;24(6):459–64. [DOI] [PubMed] [Google Scholar]
- 36.Parker L, Levinger I, Mousa A, Howlett K, de Courten B. Plasma 25-hydroxyvitamin d is related to protein signaling involved in glucose homeostasis in a tissue-specific manner. Nutrients. 2016;8(10):631. [DOI] [PMC free article] [PubMed] [Google Scholar]
- 37.Elseweidy MM, Amin RS, Atteia HH, Ali MA. Vitamin D3 intake as regulator of insulin degrading enzyme and insulin receptor phosphorylation in diabetic rats. Biomed Pharmacother. 2017;85:155–9. [DOI] [PubMed] [Google Scholar]
- 38.Bell NH, Epstein S, Greene A, Shary J, Oexmann MJ, Shaw S. Evidence for alteration of the vitamin D-endocrine system in obese subjects. The Journal of clinical investigation. 1985;76(1):370–3. [DOI] [PMC free article] [PubMed] [Google Scholar]
- 39.Forouhi NG, Luan Ja, Cooper A, Boucher BJ, Wareham NJ. Baseline serum 25-hydroxy vitamin D is predictive of future glycaemic status and insulin resistance: the MRC Ely prospective study 1990-2000. Diabetes. 2008. [DOI] [PMC free article] [PubMed] [Google Scholar]
- 40.Hyppönen E, Boucher BJ, Berry DJ, Power C. 25-hydroxyvitamin D, IGF-1, and metabolic syndrome at 45 years of age: a cross-sectional study in the 1958 British Birth Cohort. Diabetes. 2008;57(2):298–305. [DOI] [PubMed] [Google Scholar]
- 41.Barchetta I, De Bernardinis M, Capoccia D, Baroni MG, Fontana M, Fraioli A, et al. Hypovitaminosis D is independently associated with metabolic syndrome in obese patients. PLoS One. 2013;8(7):e68689. [DOI] [PMC free article] [PubMed] [Google Scholar]
- 42.Barchetta I, Carotti S, Labbadia G, Gentilucci UV, Muda AO, Angelico F, et al. Liver vitamin D receptor, CYP2R1, and CYP27A1 expression: relationship with liver histology and vitamin D3 levels in patients with nonalcoholic steatohepatitis or hepatitis C virus. Hepatology. 2012;56(6):2180–7. [DOI] [PubMed] [Google Scholar]
- 43.Cauley JA, Danielson ME, Boudreau R, Barbour KE, Horwitz MJ, Bauer DC, et al. Serum 25-hydroxyvitamin D and clinical fracture risk in a multiethnic cohort of women: The women’s health initiative (WHI). J Bone Miner Res. 2011;26(10):2378–88. [DOI] [PMC free article] [PubMed] [Google Scholar]
- 44.Scragg R, Sowers M, Bell C. Serum 25-hydroxyvitamin D, diabetes, and ethnicity in the Third National Health and Nutrition Examination Survey. Diabetes Care. 2004;27(12):2813–8. [DOI] [PubMed] [Google Scholar]
- 45.Gutierrez OM, Farwell WR, Kermah D, Taylor EN. Racial differences in the relationship between vitamin D, bone mineral density, and parathyroid hormone in the National Health and Nutrition Examination Survey. Osteoporos Int. 2011;22(6):1745–53. [DOI] [PMC free article] [PubMed] [Google Scholar]
- 46.Hannan MT, Litman HJ, Araujo AB, McLennan CE, McLean RR, McKinlay JB, et al. Serum 25-hydroxyvitamin D and bone mineral density in a racially and ethnically diverse group of men. J Clin Endocrinol Metab. 2008;93(1):40–6. [DOI] [PMC free article] [PubMed] [Google Scholar]
- 47.Michos ED, Reis JP, Post WS, Lutsey PL, Gottesman RF, Mosley TH, et al. 25-Hydroxyvitamin D deficiency is associated with fatal stroke among whites but not blacks: The NHANES-III linked mortality files. Nutrition. 2012;28(4):367–71. [DOI] [PMC free article] [PubMed] [Google Scholar]
- 48.Robinson-Cohen C, Hoofnagle AN, Ix JH, Sachs MC, Tracy RP, Siscovick DS, et al. Racial differences in the association of serum 25-hydroxyvitamin D concentration with coronary heart disease events. JAMA. 2013;310(2):179–88.. [DOI] [PMC free article] [PubMed] [Google Scholar]
- 49.Resnick LM, Muller FB, Laragh JH. Calcium-regulating hormones in essential hypertension. Relation to plasma renin activity and sodium metabolism. Ann Intern Med. 1986;105(5):649–54.. [DOI] [PubMed] [Google Scholar]
- 50.Panichi V, De Pietro S, Andreini B, Bianchi AM, Migliori M, Taccola D, et al. Calcitriol modulates in vivo and in vitro cytokine production: a role for intracellular calcium. Kidney Int. 1998;54(5):1463–9. [DOI] [PubMed] [Google Scholar]
- 51.O’Connell TD, Berry JE, Jarvis AK, Somerman MJ, Simpson RU. 1,25-Dihydroxyvitamin D3 regulation of cardiac myocyte proliferation and hypertrophy. Am J Physiol. 1997;272(4 Pt 2):H1751–8. [DOI] [PubMed] [Google Scholar]
- 52.Li YC, Kong J, Wei M, Chen ZF, Liu SQ, Cao LP. 1,25-Dihydroxyvitamin D(3) is a negative endocrine regulator of the renin-angiotensin system. J Clin Invest. 2002;110(2):229–38. [DOI] [PMC free article] [PubMed] [Google Scholar]
- 53.Brown LL, Cohen B, Tabor D, Zappala G, Maruvada P, Coates PM. The vitamin D paradox in Black Americans: a systems-based approach to investigating clinical practice, research, and public health - expert panel meeting report. BMC Proc. 2018;12(Suppl 6):6. [DOI] [PMC free article] [PubMed] [Google Scholar]
- 54.Levin GP, Robinson-Cohen C, de Boer IH, Houston DK, Lohman K, Liu Y, et al. Genetic variants and associations of 25-hydroxyvitamin D concentrations with major clinical outcomes. JAMA. 2012;308(18):1898–905. [DOI] [PMC free article] [PubMed] [Google Scholar]
- 55.Harris SS, Eccleshall TR, Gross C, Dawson-Hughes B, Feldman D. The vitamin D receptor start codon polymorphism (FokI) and bone mineral density in premenopausal American black and white women. J Bone Miner Res. 1997;12(7):1043–8.. [DOI] [PubMed] [Google Scholar]
- 56.Bid HK, Mishra DK, Mittal RD. Vitamin-D receptor (VDR) gene (Fok-I, Taq-I and Apa-I) polymorphisms in healthy individuals from north Indian population. Asian Pac J Cancer Prev. 2005;6(2):147–52. [PubMed] [Google Scholar]
- 57.Huang X, Cao Z, Zhang Z, Yang Y, Wang J, Fang D. No association between Vitamin D receptor gene polymorphisms and nasopharyngeal carcinoma in a Chinese Han population. Biosci Trends. 2011;5(3):99–103. [DOI] [PubMed] [Google Scholar]
- 58.Powe CE, Evans MK, Wenger J, Zonderman AB, Berg AH, Nalls M, et al. Vitamin D-binding protein and vitamin D status of black Americans and white Americans. N Engl J Med. 2013;369(21):1991–2000. [DOI] [PMC free article] [PubMed] [Google Scholar]
- 59.Pickhardt PJ, Park SH, Hahn L, Lee SG, Bae KT, Yu ES. Specificity of unenhanced CT for non-invasive diagnosis of hepatic steatosis: implications for the investigation of the natural history of incidental steatosis. Eur Radiol. 2012;22(5):1075–82. [DOI] [PubMed] [Google Scholar]
- 60.Park SH, Kim PN, Kim KW, Lee SW, Yoon SE, Park SW, Ha HK, Lee MG, Hwang S, Lee SG, Yu ES, Cho EY. Macrovesicular hepatic steatosis in living liver donors: use of CT for quantitative and qualitative assessment. Radiology. 2006. April;239(1):105–12. [DOI] [PubMed] [Google Scholar]
Associated Data
This section collects any data citations, data availability statements, or supplementary materials included in this article.