Abstract
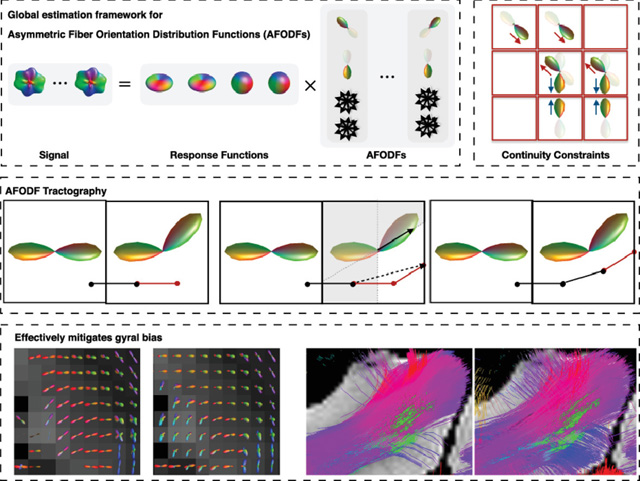
Diffusion tractography in brain connectomics often involves tracing axonal trajectories across gray-white matter boundaries in gyral blades of complex cortical convolutions. To date, gyral bias is observed in most tractography algorithms with streamlines predominantly terminating at gyral crowns instead of sulcal banks. This work demonstrates that asymmetric fiber orientation distribution functions (AFODFs), computed via a multi-tissue global estimation framework, can mitigate the effects of gyral bias, enabling fiber streamlines at gyral blades to make sharper turns into the cortical gray matter. We use ex-vivo data of an adult rhesus macaque and in-vivo data from the Human Connectome Project (HCP) to show that the fiber streamlines given by AFODFs bend more naturally into the cortex than the conventional symmetric FODFs in typical gyral blades. We demonstrate that AFODF tractography improves cortico-cortical connectivity and provides highly consistent outcomes between two different field strengths (3T and 7T).
Keywords: Diffusion MRI, tractography, gyral bias, asymmetric fiber orientation distribution
Graphical Abstract
1. Introduction
Diffusion magnetic resonance imaging (DMRI) (Johansen-Berg and Behrens, 2013) is a powerful imaging technique for non-invasive quantification of tissue microstructure and mapping of axonal trajectories by probing the diffusion patterns of water molecules in the living human brain. DMRI-based connectomics is widely used for understanding neurological development associated with the cerebral cortex (Johansen-Berg and Behrens, 2013; Yamada et al., 2009; Mori and van Zijl, 2002).
A white matter (WM) fiber tract is a collection of axons in the central nervous system with common origin and destination sites, typically in the cortical gray matter (GM) (Makris et al., 1997; Noback et al., 2011; Robertson, 1978). These tracts have long range and involve axons traversing from cortical GM sites through the superficial WM, then the deep WM, and into a distant cortical or subcortical structure. For an accurate connectivity map of the brain, estimated fiber streamlines must be able not only to follow major fiber bundles through the deep WM, but must also correctly follow axonal trajectories as they cross the WM-GM boundary. However, it is shown that up to 70% of the streamlines produced by the state-of-the-art tractography algorithms actually do not reach the GM, even with high angular resolution diffusion imaging (HARDI) (Côté et al., 2013; Maier-Hein et al., 2017). This can be attributed to the complexity of fiber arrangement in the superficial WM, which resides beneath the cortical sheet (Reveley et al., 2015). This in turn causes gyral bias, with streamlines preferentially terminating at gyral crowns rather than sulcal banks (Van Essen et al., 2013a; Schilling et al., 2018). Gyral bias stems from the technical difficulties in tracing highly-curved axonal trajectories across WM-GM boundaries in gyral blades (Van Essen et al., 2013a). The shortcomings of existing tractography algorithms may lead to severe bias in connectivity analysis (Reveley et al., 2015).
Gyral bias can be mitigated by increasing the spatial resolution of DMRI data (Sotiropoulos et al., 2016; Heidemann et al., 2012) or imposing constraints derived from anatomical (e.g., T1-weighted) images (St-Onge et al., 2018; Teillac et al., 2017; Smith et al., 2012). In this paper, we will however introduce an approach to mitigate the gyral bias that does not rely on time-consuming and expensive high-resolution data as well as hypothetical cortical connections derived from anatomical images. Our technique utilizes subvoxel asymmetry and fiber continuity to improve cortical tractography of highly-curved axonal trajectories.
The orientation information at each voxel is typically encoded as a fiber orientation distribution function (FODF), which is typically computed by using spherical deconvolution (SD) (Tournier et al., 2004, 2007). The SD method assumes that the signal profile can be represented as the convolution of the FODF with a fiber response function (RF) estimated from voxels that contain coherent single-directional axonal bundles. FODFs are typically assumed to be antipodal symmetric, implying that an orientation in a positive hemisphere is always identical to its counterpart in the negative hemisphere. However, this symmetry limits the FODF in representing complex WM geometries such as fanning and bending.
The basic idea of this paper is to incorporate information from neighboring voxels in estimating asymmetric FODFs (AFODFs). To date, the impact of AFODFs on the gyral bias has not been investigated. We extend the multi-tissue model in (Jeurissen et al., 2014) to account for the different polarity of fiber orientations separately in order to capture the asymmetry of the underlying fiber geometry in a local neighborhood. We estimate the AFODF at each voxel by enforcing orientation continuity across voxels. We assume that a fiber streamline leaves a voxel along direction u and enters a neighboring voxel along the reverse direction −u with higher fiber continuity. Our continuity constraint is constructed to minimize the difference between the two fiber orientation within the neighborhood. Existing methods for estimating AFODF (Barmpoutis et al., 2008; Cetin Karayumak et al., 2018; Ehricke et al., 2011) typically involves smoothing a field of FODFs taking into account fiber continuity across neighborhood ODFs. However, these methods, e.g., (Bastiani et al., 2017), rely on initialization based on symmetry FODFs and update the corresponding FODFs voxel-wisely according to neighborhood information.
Unlike (Cetin Karayumak et al., 2018; Bastiani et al., 2017; Reisert et al., 2012), our approach is formulated as a convex problem and does not require initialization with pre-computed symmetric FODFs. Instead, we estimate the AFODFs directly from the data by imposing the fiber continuity constraint across voxels. Moreover, our algorithm provides the global solution for multiple voxels simultaneously, taking into account the fiber continuity constraint, instead of solving for each voxel individually. The convexity of our problem formulation allows efficient optimization for large-scale global solutions, unlike the non-convex formulation in (Auría et al., 2015).
Part of this work was presented in (Wu et al., 2018). Herein, we (i) provide a more detailed description of the proposed method; (ii) devise a novel tractography algorithm; (iii) reformulate the fiber continuity term using the von Mises-Fisher distribution; (iv) optimize the algorithm for accelerated global solutions of multiple voxels; (v) provide new insights into consistency across scanners and spatial resolutions; and (vi) compare fiber densities at gyral crowns and sulcal banks determined based on histology and diffusion tractography. None of these is part of the conference publication.
We describe our method in detail in the Methods section and demonstrate its effectiveness with ex-vivo and in-vivo data in the Experimental Results section. We further provide discussion in the Discussion section before concluding in the Conclusion section.
2. Methods
2.1. Multi-Tissue Asymmetric Fiber Orientation Distribution
The FODF F(u), usually assumes antipodal symmetry in the sense that F(u) = F(−u). However, this symmetry limits the FODF in representing complex configurations such as fanning and bending, both very common in gyral blades (see Figure 1). We extend the multi-tissue constrained spherical deconvolution (MT-CSD) framework (Jeurissen et al., 2014) by incorporating information from neighborhood voxels to allow FODF asymmetry for better representation of complex configurations (Cetin Karayumak et al., 2018; Bastiani et al., 2017; Reisert et al., 2012).
Figure 1:
Existing tractography algorithms typically produce biased fiber streamlines that predominantly terminate at gyral crowns, which contradicts actual histology showing that axonal trajectories in gyral blades traverse perpendicularly into gyral crowns and sulcal banks. Gyral bias is caused by the ambiguity of the fiber orientation distribution functions (FODFs) in voxels traversed by bending and fanning trajectories. The inability to trace the fiber streamlines correctly in the superficial WM impedes the detection of long-range cortical connections (Reveley et al., 2015).
MT-CSD decomposes the diffusion signal Sp(g), for gradient direction and voxel location , into tissue types, each of which is represented by the spherical convolution of an axially symmetric RF Ri(g,·) (Tournier et al., 2007; Jeurissen et al., 2014) with an FODF Fp,i(·), 1 ≤ i ≤ M, giving an overall signal
| (1) |
A typical multi-tissue model accounts for signal contributions from white matter (WM), gray matter (GM), and cerebrospinal fluid (CSF), with M = 3. For convenience, the GM and CSF compartments are considered isotropic and the asymmetry will be considered only for the WM compartment.
To improve robustness to noise, FODFs are often estimated with some form of regularization (Tournier et al., 2007; Auría et al., 2015). We regularize the estimation of AFODFs via the fiber continuity constraint (see Figure 2). A fiber streamline leaving a voxel p along direction u should enter the adjacent voxel along direction −u with higher possibility. Here, we denote the as a second order neighbourhood of p. We measure the discontinuity Φ(·) of the FODFs of N voxels, denoted as F, over direction by
| (2) |
where denotes a directional probability distribution function (PDF) that is decided by the angular difference between u and . is a normalization term. We choose to be the von Mises-Fisher distribution with reference direction (see Directional PDF).
Figure 2:
To mitigate gyral bias, we allow the FODF to be asymmetric. This asymmetry is estimated with the orientation consistency constraint across voxels. This constraint links all voxels and necessitates their AFODFs to be estimated concurrently (see the box of constraints). The signal (Sp(g)) is represented as the convolution (‘⊗’) of multi-tissue response functions (R) with the asymmetric FODFs (Fp).
The FODF is commonly represented as a series of real spherical harmonics (SHs) with even-order (Tournier et al., 2004; Frank, 2002). Odd-order SHs typically capture only noise (Hess et al., 2006) and are therefore not included in the representation. Unlike (Bastiani et al., 2017), which attempts to capture the asymmetry using an additional component represented by odd-order SHs, we represent the WM AFODF using two sets of spherical harmonic coefficients:
| (3) |
where y(u) is the real even-order SH basis sampled in direction u, and and are the corresponding SH coefficients at location p for the positive and negative hemispheres (. and ). Note that discontinuity between the hemispheres can be avoided because (i) SH representation with finite order is smooth and discourages abrupt changes, and (ii) the fiber continuity constraint, applied throughout , is directionally smooth thanks to the weighting mechanism based on the von Mises-Fisher distribution. In this paper, we set the maximum SH order as 8. Following (Jeurissen et al., 2014), we use a multi-tissue formulation and represent the GM and CSF FODFs using zeroth-order SH coefficients.
2.2. Directional PDF
The directional PDF should decrease monotonically with the decreasing angular difference between the direction −u and a reference direction . We employ a von Mises-Fisher distribution over the sphere (Mardia and Jupp, 2000) and set
| (4) |
where κ ≥ 0 and I1/2 denotes the modified Bessel function of the first kind at order 1/2. The greater the value of κ the higher the concentration of the distribution around the reference direction . In particular, when κ = 0, the distribution is uniform over the sphere, and as κ → ∞, the distribution tends to a point density. The distribution is rotationally symmetric around and is unimodal for κ ≥ 0. The value of κ was set to 4, giving a half width at half maximum value of 56.5°. More details about von Mises-Fisher distribution can be found in (Kumar et al., 2008; Zhang et al., 2007).
2.3. Problem Formulation
We group the signal vectors of N voxels at locations as columns of matrix S and the SH coefficients of the corresponding AFODFs as columns in matrix X. With a set of directions , we aim to solve the SH coefficients of the N voxels simultaneously as follows:
| (5) |
where
and R = [RWM,RWM,RGM,RCSF]. Matrix R maps the SH coefficients to the diffusion signal by spherical convolution. B is a block diagonal matrix consisting of Y, Y, y0 and y0, where Y = [y(u1),…,y(uK)]⊤ and is the zero-order SH basis. B maps the SH coefficients to the AFODF amplitudes at directions to impose nonnegativity constraint by BX ≽ 0 for all tissue types. In (5), δ controls the strictness of the fiber continuity constraint and ∥·∥F is the Frobenius norm. Φ(F), defined in (2), is computed only for the WM AFODF. We let
| (6) |
with
| (7) |
and the normalization term Kp,u defined in (2). Let A be a block diagonal matrix consisting of Y, Y, 0 and 0, which removes the isotropic components from B and maps the SH coefficients to the AFODF amplitudes. We further define the operator ○ as
| (8) |
where (AX)i is the i-th row of AX and corresponds to direction ui, 1 ≤ i ≤ K. Then, the problem (5) can be rewritten as
| (9) |
which is a linear least-squares problem with linear inequality constraints that can be solved efficiently using convex optimization.
2.4. Optimization
We solve the high-dimensional optimization problem (9) using the alternating direction method of multipliers (ADMM) (Boyd et al., 2011). We note that (9) can be equivalently written as
| (10) |
where Z is an auxiliary variable. Let H be the multiplier for Then, each iteration of ADMM involves minimizing the augmented Lagrangian
| (11) |
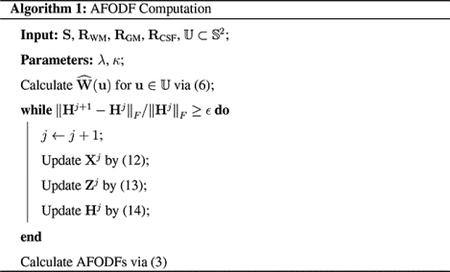
alternatingly for X, Z and updating H. I+(Q) takes 0 if Q ≽ 0 and ∞ otherwise. More specifically, let Xj, Zj and Hj denote the variables at iteration j. Then, we have
| (12) |
| (13) |
and update Hj+1 by
| (14) |
A typical stopping criterion is to check whether Hj has stopped changing, i.e., ∥Hj+1 − Hj∥F/∥Hj∥F ≤ ϵ for a user-defined choice of ϵ. Problem (12) can be written as
| (15) |
and can be solved efficiently via quadratic programming (Stellato et al., 2018). Problem (13) can be solved efficiently using thresholding, i.e., if BZj+1 ≽ 0, and Zj+1 = 0 otherwise. The algorithm is summarized in Algorithm 1.
2.5. AFODF Tractography
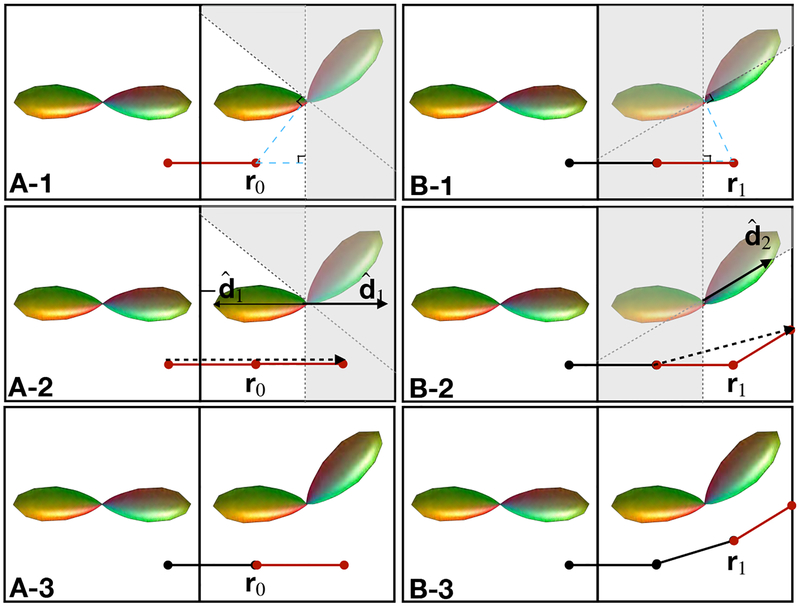
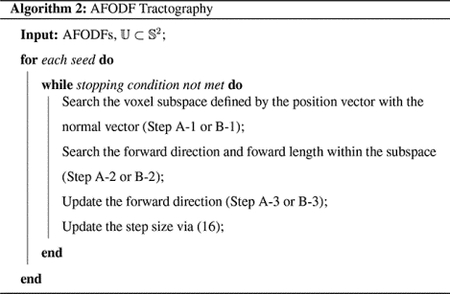
We introduce a tractography algorithm that caters to AFODFs using the direction getter mechanism described in (Garyfallidis et al., 2014; Amirbekian, 2016). The deterministic maximum direction getter returns the most probable direction from a fiber orientation distribution. When multiple plausible directions are available, the choice of best direction is dependent on the direction of the previous fiber segment.
We extend the method described in (Bastiani et al., 2017) and the direction getter mechanism to work with AFODFs (Figure 3). Similar to the deterministic fiber tracking method, we track along the most probable directions subject to the tracking constraints (e.g., maximum turning angle, anisotropy, etc.) (Amirbekian, 2016).
Figure 3:
AFODF tractography algorithm for sharp sub-voxel bending. Tracking order: A-1, A-2, A-3, B-1, B-2, B-3. A-Steps: Tracking across voxels. B-Steps: Tracking within a voxel.
Unlike (Bastiani et al., 2017), in our algorithm the direction may change within a voxel by following the most probable direction without referring to the direction in the previous voxel. The details of our multi-step algorithm are provided below (see Figure 3 and summary in Algorithm 2):
Step A-1 (or B-1): Identify a sub-volume (non-shaded in Figure 3) based on the half-space defined by position r0 (or r1) and the plane through the voxel center that is perpendicular to r0 (or r1).
Step A-2 (or B-2): Determine the most probable direction ( in A-2, in B-2) in the sub-volume defined in Step A-1 (or B-1) for streamline propagation. The sign of direction is flipped whenever necessary.
- Step A-3 (or B-3): The direction of propagation and position are updated (i = 0 for A-3, i = 1 for B-3) using
Similar to (Bastiani et al., 2017), the step size si is determined by the multiplication of the AFODF value associated with di and a scale ρ.(16)
2.6. Evaluation Metrics
2.6.1. Asymmetry Index (ASI)
Based on (Cetin Karayumak et al., 2018), we define an asymmetry index that measures the difference between F(u) and F(−u) for a set of directions :
| (17) |
which has a value of 0 when F(u) = F(−u) for all .
2.6.2. Model Discrepancy Index (MDI)
A model discrepancy indices (MDI) is used to measure the distance between an AFODF and its symmetric counterpart. A Chebyshev distance is used to measure the greatest FODF difference on a unit sphere . Let and be the two kinds of FODFs, e.g., asymmetric and symmetric, which are normalized to range [0,1]. Then, the MDI is defined as
| (18) |
which ranges from 0 to 1.
2.6.3. Interscan Consistency Index (ICI)
Based on (Streiner, 2003), we introduce an interscan consistency index (ICI) to measure the similarity of the distributions of the streamline endpoints of the same subject between two different scans (e.g., 3T and 7T scans). Given two vectors, c1 = [c1,1,…,c1,n] and c2 = [c2,1,…,c2,n], that represent the fractions of endpoints in n regions of interest (ROIs), the index is defined as
| (19) |
where
ICI ranges from 0 (inconsistent) to 1 (consistent). Note that ICI is quite general and can be used to measure the interscan consistency of quantities other than endpoint statistics.
2.6.4. Intra-Class Coefficient (ICC)
Reproducibility was quantified by calculating the robust intra-class coefficient (ICC) between two scans (Shevlyakov and Smirnov, 2011). ICC of two measurement vectors x = [x1,…,xn] and y = [y1,…,yn] is defined as1
| (20) |
where and are the mean of x and y, respectively, and δx and δy are the standard deviations of x and y, respectively. ICC ranges from 0 (unreproducible) to 1 (reproducible).
3. Experimental Results
3.1. Materials
To demonstrate the advantages of AFODFs, we utilized a macaque DMRI dataset with histological data2 for validation. The brain was placed in liquid Fomblin (California Vacuum Technology, CA) and scanned on a Varizan 9.4T, 21 cm bore magnet. The structural image was acquired using a 3D gradient echo sequence (TR=50ms; TE=3ms; flip angle=45°) at 200 μm isotropic resolution. The diffusion data were acquired with a 3D spin-echo diffusion-weighted EPI sequence at 400μm isotropic resolution. The b-values were set to 3000, 6000, 9000, and 12000s/mm2, which due to the decreased diffusivity of ex-vivo tissue (Dyrby et al., 2011), were expected to replicate the signal attenuation profile for in vivo tissue with b-values of 1000, 2000, 3000, and 4000s/mm2 (Schilling et al., 2018). A gradient table of 404 uniformly distributed directions was used to acquire diffusion-weighted volumes with 16 additional non-diffusion-weighted volumes collected at b=0 s/mm2. More acquisition details can be found in (Schilling et al., 2018).
We further utilized the 3T and 7T DMRI dataset (see Table 2) of a subject (ID: 105923) scanned in the Human Connectome Project (HCP) (Van Essen et al., 2013b). More acquisition details are given in (Sotiropoulos et al., 2016; Van Essen et al., 2013b). For reproducibility study, we randomly selected 10 subjects from the HCP test-retest dataset. To demonstrate the robustness of our method under various imaging conditions, we reduced the number of diffusion-weighted images for each shell, i.e., from 90 to 18, 30, and 45 uniformly distributed gradient directions, resulting in 54 (18×3), 90 (30×3) and 135 (45×3) images for three shells combined. We also resampled the images spatially from (1.25mm)3 to (2.5mm)3 and (5mm)3.
Table 2:
Summary of HCP 3T and 7T DMRI protocols.
| 3T | 7T | |
|---|---|---|
| Spatial resolution | (1.25 mm)3, LR/RL phase encoding | (1.05 mm)3, AP/PA phase encoding |
| Acceleration | Multiband = 3 | Multiband = 2, GRAPPA = 3 |
| Total echo train length | 84.24 ms | 41 ms |
| Gradient strength (max) | 100 mT/m | 70 mT/m |
| b-value (s/mm2) | 1000, 2000, 3000 | 1000, 2000 |
| Gradient directions | 270 | 130 |
Tissue segmentation (CSF, cortical GM, deep GM, and WM) was performed using the T1-weighted image using the pipeline described in (Smith et al., 2012). The pipeline was performed using MRtrix software package (Tournier et al., 2012). A mask generated based on the cortical and deep GM volume fraction maps was warped to the space of the diffusion-weighted images for tractography seeding. The cortical regions were labeled based on the Destrieux atlas (Destrieux et al., 2010).
According to (Jeurissen et al., 2014), a fiber RF is estimated from the diffusion signal for each b-shell and each tissue type. Tissue types are determined by the tissue segmentation map warped to the diffusion-weighted images. The WM RF is estimated by averaging the reoriented diffusion signal profiles of voxels with high anisotropy in WM tissue. The isotropic RFs for GM and CSF are estimated from isotropic representative voxels of GM and CSF, respectively, where these voxels were randomly selected with the maximum harmonic order being fixed as 0 as the isotropic model.
3.2. Macaque
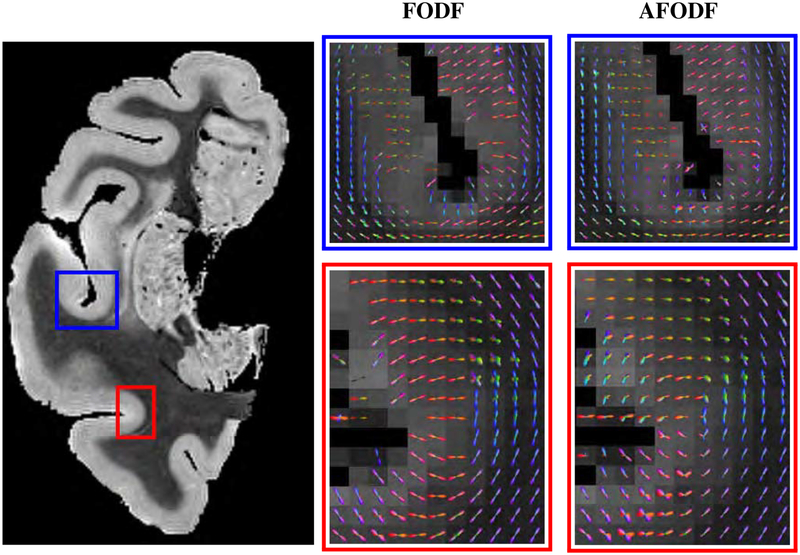
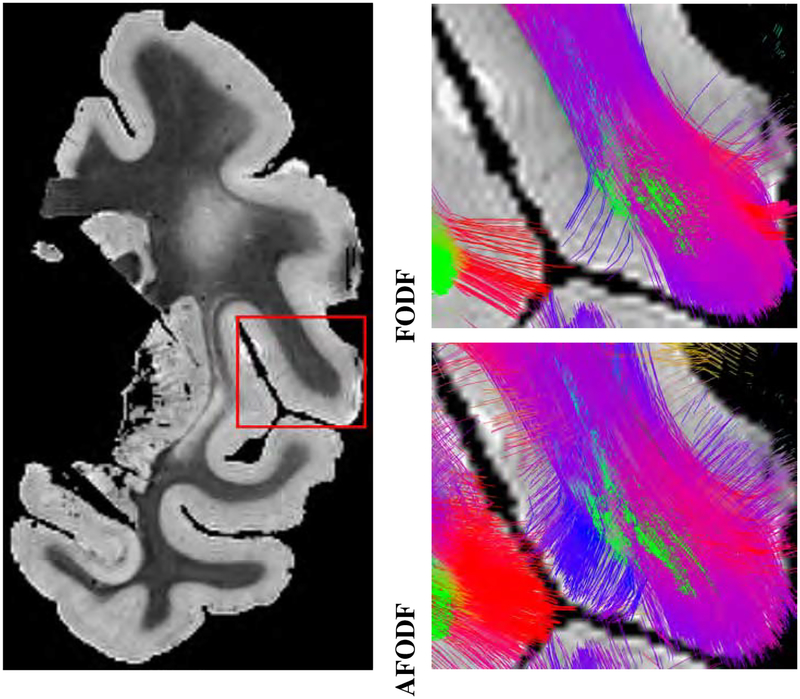
Figure 4 shows the intravoxel architecture as given by FODFs and AFODFs in sulcal banks and fundi. Many areas in both WM and GM show multiple fiber populations. In agreement with previous studies (Leuze et al., 2014), we see that AFODFs are largely oriented perpendicularly to the WM-GM boundary at the sulcal banks. Tractography results in Figure 5 confirm this observation, validating that AFODFs improve tractography across WM-GM boundaries. This increases cortical coverage and reduces gyral bias.
Figure 4:
AFDOFs capture the bending and branching fiber populations at the WM-GM boundary. Orientations are mostly perpendicular to the WM-GM surface. (Macaque data)
Figure 5:
AFDOFs estimated from low-resolution DMRI capture the bending and branching fiber populations at the WM-GM boundary. Orientations are mostly perpendicular to the WM-GM surface. (Macaque data)
Figure 7 shows the ratios of average fiber densities of gyral crowns to sulcal banks for the gyral blades listed in Table 1 and shown in Figure 6. Fiber density is computed as the number of streamlines per voxel. The fiber density ratio are estimated in the histology following the previous study (Schilling et al., 2018). FODF tractography is biased towards gyral crowns in comparison with the axonal density ratios given by the histological data in many gyral blades, for both WM and GM seeding. AFODF tractography yields density ratios that match the histological data better.
Figure 7:
The histological ground truth density ratios are shown as blue circles (mean ± 95% confidence interval). Results for Both WM seeding GM seeding are shown. Logarithmic scale is used for the vertical axis. (Macaque data). Ground truths for fiber density ratio are shown as blue dots and standard deviation error bar.
Table 1:
Abbreviations of gyral blades (Schilling et al., 2018).
| Abbreviation | Name |
|---|---|
| SFG | superior frontal gyrus |
| IFG | inferior frontal gyrus |
| LorG | lateral orbital gyrus |
| Gre | gyrus rectus |
| PrG | pre- central gyrus |
| INS | insula |
| ITG | inferior temporal gyrus |
| PCgG | posterior cingulate gyrus |
| FuG | fusiform gyrus |
| SPL | superior parietal lobule |
| IOG | inferior occipital gyrus |
| CUN | cuneus |
| MFG | medial frontal gyrus |
| FOG | frontal orbital gyrus |
| MorG | medial orbital gyrus |
| ACgG | anterior cingulate gyrus |
| STG | superior temporal gyrus |
| MTG | middle temporal gyrus |
| PoG | postcentral gyrus |
| SMG | supramarginal gyrus |
| AnG | angular gyrus |
| LiG | lingual gyrus |
| OG | occipital gyrus |
Figure 6:
Gyral blades and gyri labeled based on the structural image. The brown areas and the adjacent lake blue areas merge into gyri. (Macaque data)
3.3. 3T and 7T
3.3.1. Intravoxel Architecture
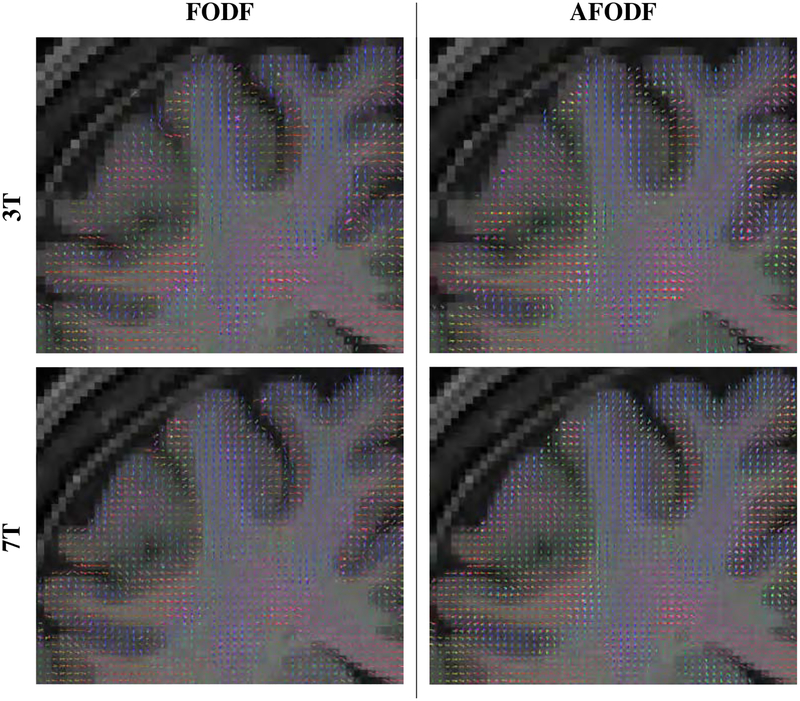
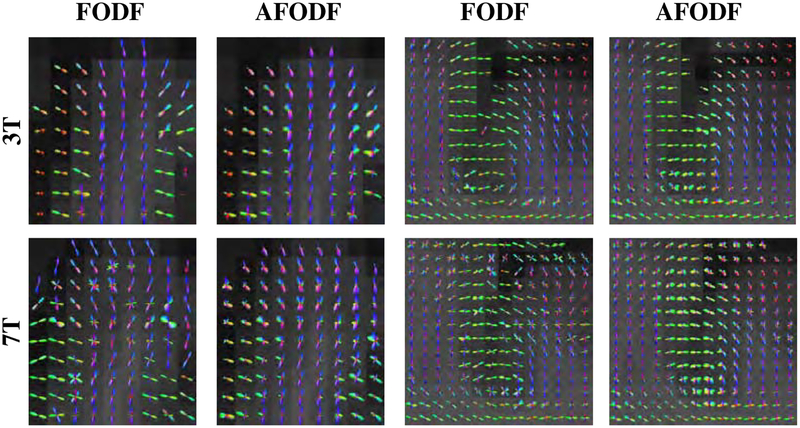
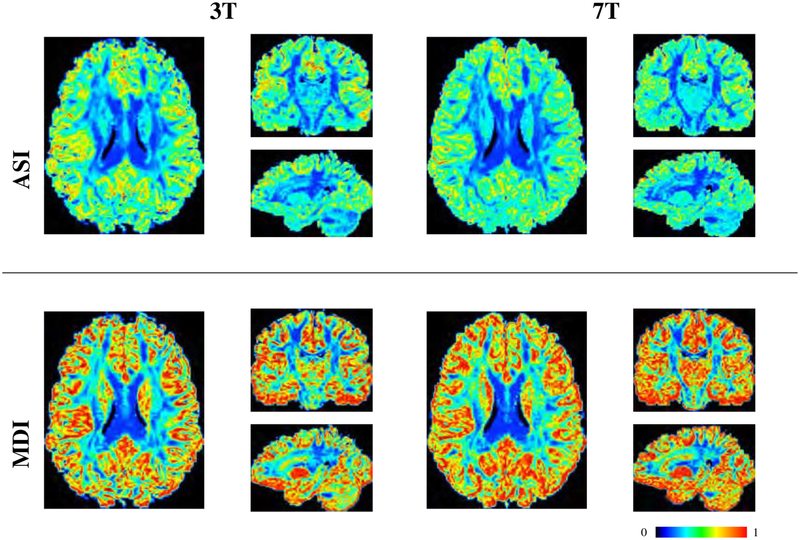
Figure 8 compares the symmetric and asymmetric FODFs based on the HCP data. Close-up views of gyral blades are shown in Figure 9. It can be observed that the AFODFs reflect the bending and branching characteristics of cortical WM pathways. The asymmetry of the AFODFs becomes more apparent for voxels nearer to the cortex. This is confirmed by the ASI and MDI maps shown in Figure 10, indicating higher asymmetry and greater model discrepancy in superficial WM than subcortical WM. The asymmetry stems from the curved nature of the axonal trajectories in these regions.
Figure 8:
Min-max normalized FODFs and AFODFs. The background is the T1-weighted image of the same subject.
Figure 9:
Close-up views of FODFs and AFODFs in gyral blades. AFODFs capture the bending and branching fiber trajectories. At the superficial WM, fiber orientations are mostly perpendicular to the WM-GM interface.
Figure 10:
FODF asymmetry (ASI) and model discrepancy (MDI) of the 3T and 7T dataset. Axial, sagittal, and coronal views of each case are shown. FODFs near the cortex exhibit a higher values, indicating greater asymmetry.
3.3.2. Tractography
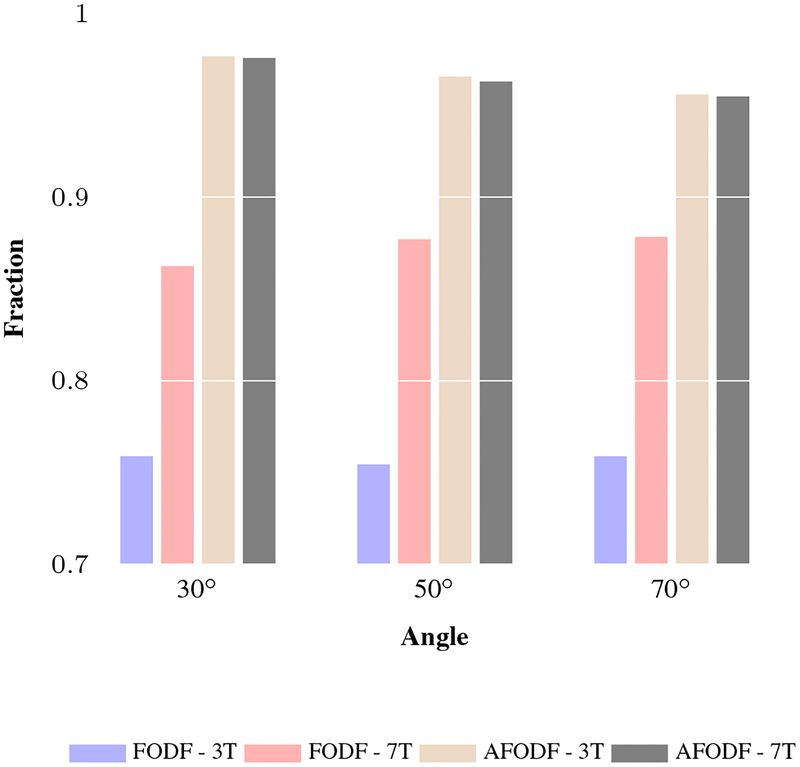
Tractography results in Figure 11 indicate that AFODFs yield a significantly greater amount of streamlines. The same GM seeds were used for tractography and streamlines not connecting cortico-cortically/cortico-subcortically or shorter than 10mm were deemed ‘invalid’ and removed. The ‘valid’ streamlines were retained. The maximum turning angle was set to 50°, unless mentioned otherwise, for the rest of the paper. Figure 12 shows the tractography results in a gyral blade, indicating that symmetric FODFs are less likely to produce streamlines that turn into the sulcal banks. This problem is mitigated by AFODFs.
Figure 11:
Tractography results using FODFs and AFODFs for the 3T and 7T datasets. The same GM seeds were used for tractography and streamlines not connecting cortico-cortically/corticosubcortically or shorter than 10mm were removed. In the background is the cortical GM tissue map of the same subject.
Figure 12:
Comparison of tractography results in gyral blades. Streamlines within a 5mm slab are shown. The background image is the cortical GM from the same subject.
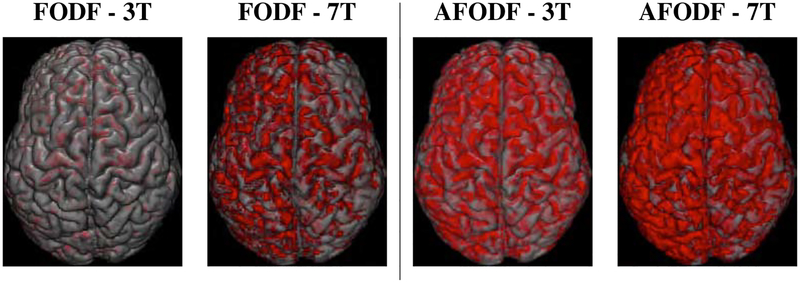
Figure 13 shows the distribution of the endpoints of fiber streamlines on the cortical surface, confirming that AFODF tractography reduces gyral bias with a more uniform coverage of the cortex across gyral crowns and sulcal banks. This observation is confirmed quantitatively in Figure 14, which shows that AFODFs yield higher fractions of valid streamlines. This indicates that there is a high probability that a streamline initiated from a GM voxel will connect with another GM voxel.
Figure 13:
Coverage of the cortex by streamline endpoints (red).
Figure 14:
Fractions of valid streamlines for various maximum turning angles. The same GM seeds were used for tractography and we removed streamlines not connecting cortico-cortically/cortico-subcortically or shorter than 10mm. The retained streamlines are denoted as ‘valid’. A higher fraction of valid streamlines usually indicated the greater connecting cortico-cortically/cortico-subcortically.
3.3.3. Consistency of Endpoint Coverage
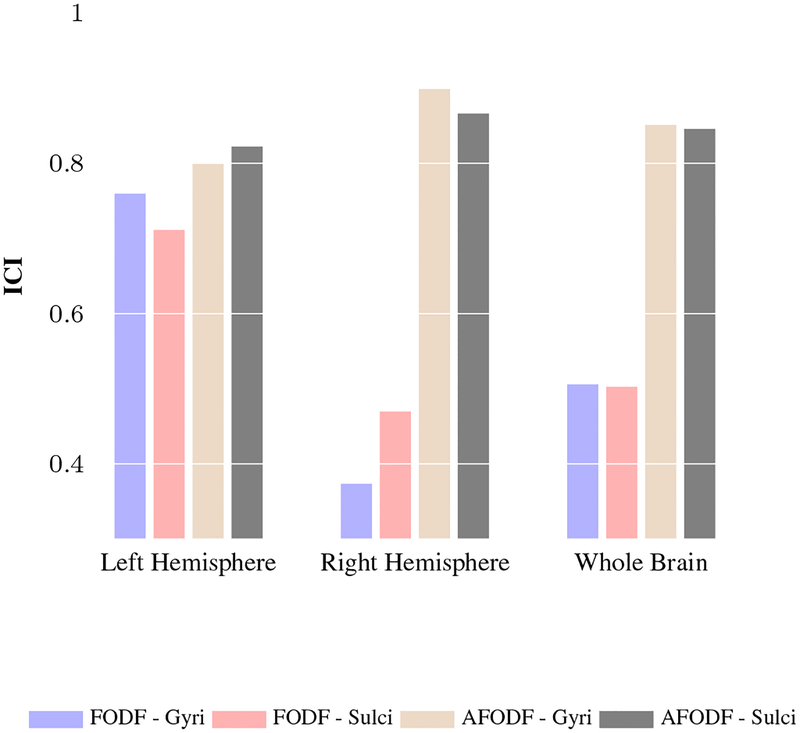
We further investigated the distribution of the streamline endpoints at the cortex. For the same subject, the distribution should ideally not vary with changes in imaging conditions. Based on the ROIs given by the Destrieux atlas, we computed the fraction of endpoints in each ROI (i.e., number of endpoints in ROI divided by total number of endpoints over all ROIs). We then computed the ICI based on (19) of the endpoint count fractions of streamlines obtained with symmetric and asymmetric FODFs using datasets acquired with 3T and 7T scanners. Figure 15 shows the ICI values of streamline endpoints in gyri and sulci, indicating that AFODFs result in greater consistency across field strengths for both gyri and sulci.
Figure 15:
ICI values, computed between 3T and 7T data, for endpoint coverage of gyri and sulci.
To evaluate the uniformity of the spatial distribution of the streamline endpoints at the cortex, we also computed the standard deviations of the fiber densities (count per volume) across voxels in different cortical regions. GM and WM masks were generated for tractography seeding. The results in Figure 16 indicate that AFODF tractography yields much lower standard deviations than FODF tractography.
Figure 16:
Standard deviations of fiber densities at gyral and sulcal WM-GM boundaries, which exhibits a lower value for the greater reliability.
3.3.4. Connectivity
Based on normalized streamline counts, we constructed a connectivity matrix (C) computed by counting streamlines connecting two regions. The connectivity matrix was normalized by . where D is the degree matrix. AFODFs yield a higher ICI value of 0.94 of the vectorized 3T and 7T connectivity matrices, compared with the lower ICI value of 0.90 given by FODFs.
3.4. Comparison with State of the Art
In this section, we compare our method with a state-of-the-art method presented by Bastiani et al. (2017).
3.4.1. Intravoxel Architecture
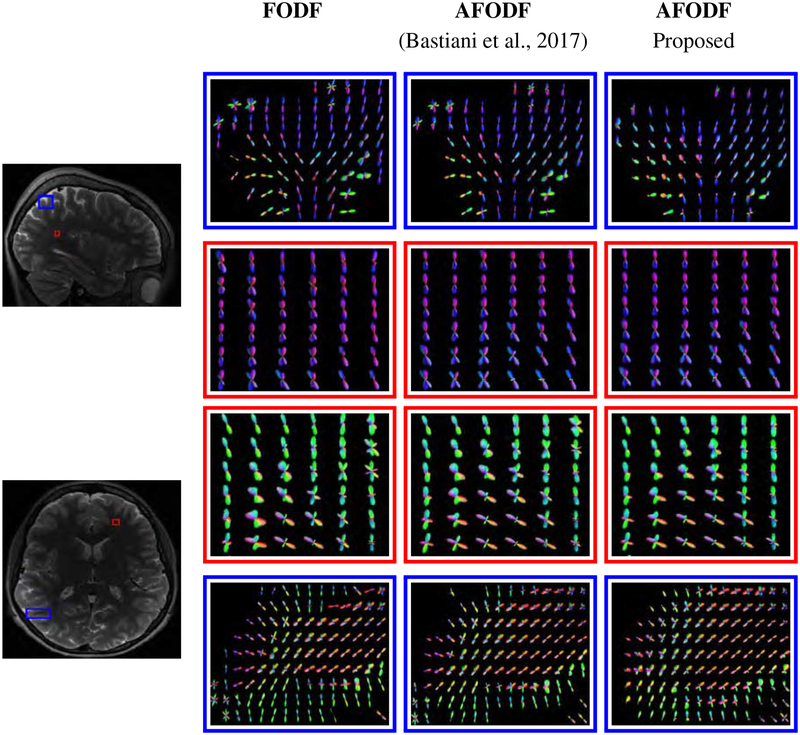
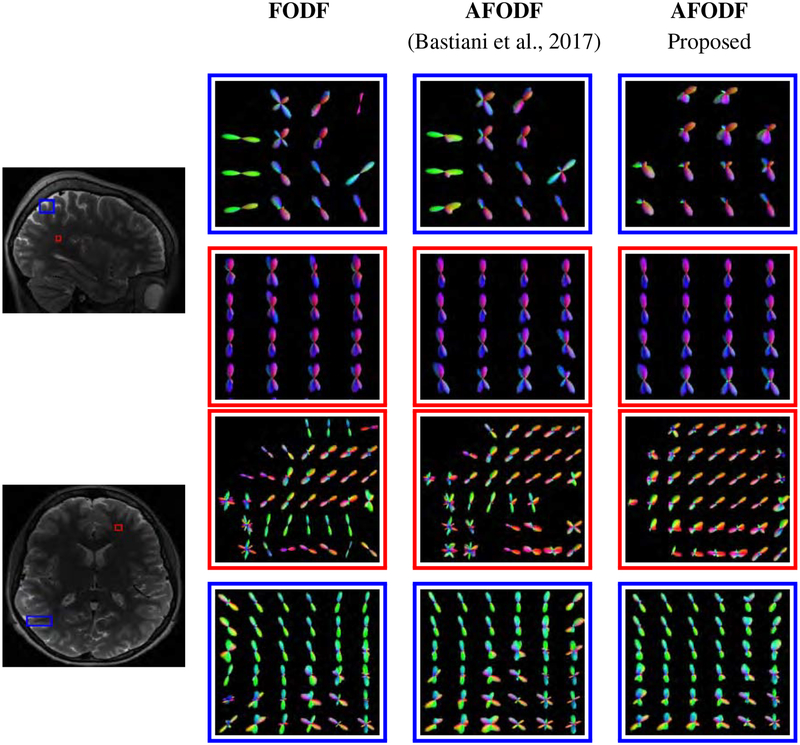
Figure 17 shows the AFODFs in some regions with fiber bending, fanning, and crossing. Figure 18 shows the corresponding results for low-resolution data. Both figures indicate that our method results in AFODFs with less spurious peaks and better reflect bending and fanning trajectories.
Figure 17:
AFODFs capture the bending and branching fiber trajectories. At the superficial WM, fiber orientations are mostly perpendicular to the WM-GM interface (blue box). Voxel size: (1.25mm)3. The reference image is the T2 image from the same subject.
Figure 18:
AFODFs capture the bending and branching fiber trajectories at low-resolution data. Voxel size: (2.5mm)3. The reference image is the T2 image from the same subject.
3.4.2. Optic Radiation
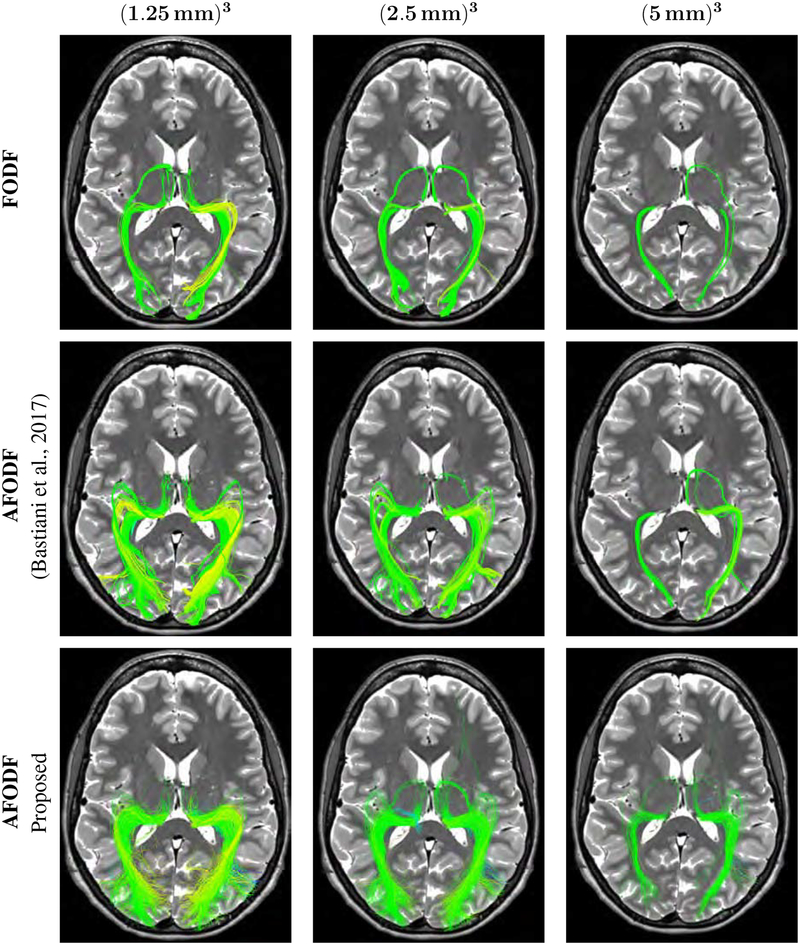
Figure 19 shows the optic radiation (OR) reconstructed using different methods. The OR connects the thalamus and regions including lingual cortex, pericalcarine cortex, cuneus cortex, and lateraloccipital cortex. The OR is key to the visual system and a key structure at risk in WM diseases such as multiple sclerosis. It is challenging to reconstruct the OR due to the sharp turning angle in Meyer’s loop and the presence of kissing and crossing fibers along the pathway. Part of the optic radiation, Meyer’s loop sweeps back on itself into the temporal lobe, just lateral to the temporal horn of the lateral ventricle. Here, the OR was reconstructed using the White Matter Query Language (WMQL) (Wassermann et al., 2016) with regions determined using FreeSurfer cortical parcellation (Destrieux et al., 2010). The results demonstrate the consistency of our method across spatial resolutions.
Figure 19:
Comparison of the optic radiation (OR) reconstructed via data of various spatial resolutions. The OR is defined as a connection between the thalamus and regions including lingual cortex, pericalcarine cortex, cuneus cortex, and lateraloccipital cortex. The background image is the T2 image from the same subject.
3.4.3. Fiber Density
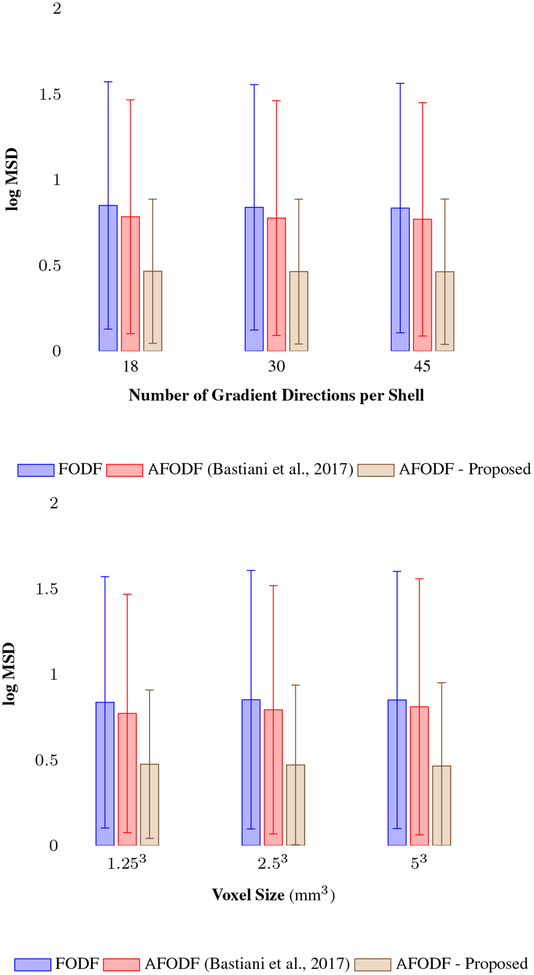
We used the HCP test-retest dataset described in Section 3.1 for assessing reproducibility in terms of fiber density. Reliability was assessed via the mean squared difference (MSD) between the test-retest fiber density images. The fiber density image is computed via track density imaging (TDI) (Calamante et al., 2010) by countung the number of tracts passing through each imaging voxel at the WM-GM interface. TDI generates density maps with high anatomical contrast and has been used as a surrogate measure of fiber density in many studies (Jeurissen et al., 2017; Wright et al., 2017). Figure 20 shows the MSD values in logarithmic scale for different angular and spatial resolutions, indicating that our method exhibits the greatest reliability.
Figure 20:
The MSD values of fiber density map in logarithmic scale at the WM-GM boundaries for different angular (Top) and spatial resolutions (Bottom), which exhibits a lower value for the greater reliability.
3.4.4. Connectivity
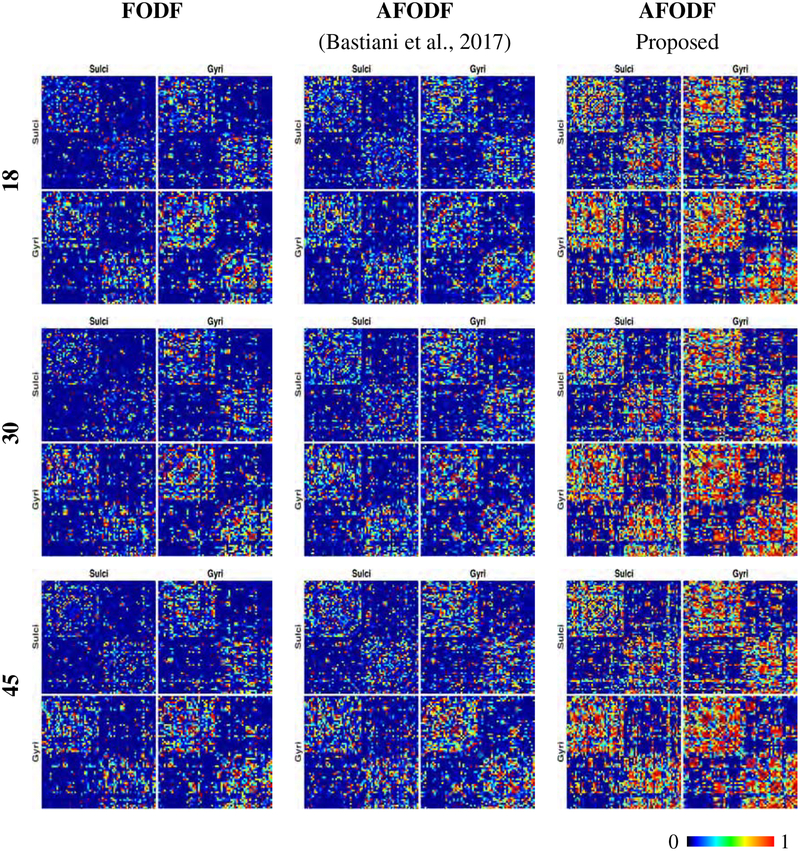
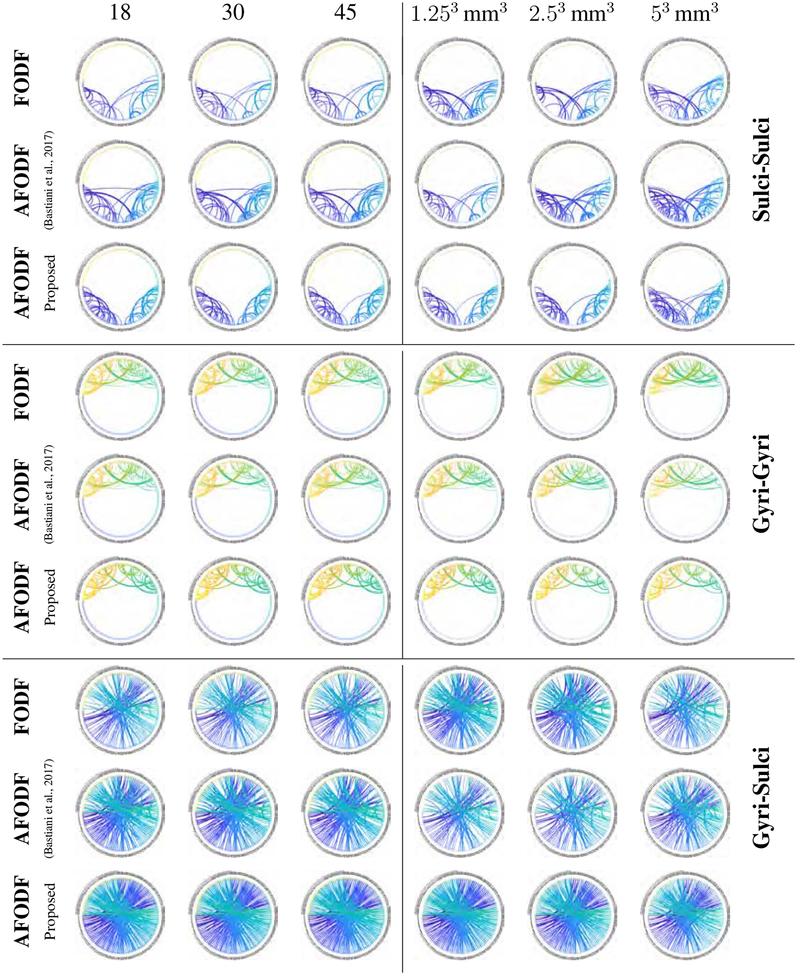
Figure 21 shows the ICC values of normalized streamline counts between gyri and sulci, indicating that our method is significantly more reliable between test-retest scans, irrespective of the number of gradient directions per shell. Figure 22 indicate that AFODFs generated by both Bastiani et al.’s method (Bastiani et al., 2017) and the proposed method result in greater gyri-sulci and sulci-sulci connections than symmetric FODFs. A closer look at the results also shows our method yields higher reliability with more connections to the sulcal banks compared with Bastiani et al.’s method (Bastiani et al., 2017).
Figure 21:
ICC value of normalized streamline counts for three connection patterns (Sulci-Sulci, Gyri-Gyri, Gyri-Sulci) with respect to the number of gradient directions per shell, which exhibits a higher value for the greater reliable between test-retest scans.
Figure 22:
Connectivity between the cortical regions listed in Table 3 defined by the Destrieux Atlas (Destrieux et al., 2010). Of which three connection patterns (Sulci-Sulci, Gyri-Gyri, Gyri-Sulci) with respect for different angular (Left) and spatial resolutions (Right) are shown.
4. Discussion
We have introduced a global estimation framework for asymmetric fiber orientation distribution functions (AFODFs). We have shown that AFODFs can resolve subvoxel fiber configurations and mitigate gyral bias in cortical tractography. We have demonstrated that AFODF tractography is reproducible across test-retest datasets. Our work supports the fact that spatial information across voxels is useful for inferring subvoxel asymmetric orientations, in line with previous work (Yap et al., 2014; Goh et al., 2009).
Unlike (Bastiani et al., 2017), which attempts to capture the asymmetry using an additional component represented by odd-order SHs, we represent the WM AFODF using two sets of spherical harmonic coefficients. We also note that SH representation with finite order is smooth and discourages abrupt changes, and the fiber continuity constraint, applied throughout , is directionally smooth thanks to the von Mises-Fisher weighting.
Our method involves a global optimization problem in the sense that the solutions for all voxels are obtained simultaneously. This is an important feature of our method since the fiber continuity constraint causes the solutions of the voxels to be interdependent. Unlike existing methods of global orientation estimation (Schwab et al., 2018b,a; Pesce et al., 2018; Auría et al., 2015), our formulation is convex and does not rely on initialization based on symmetric FODFs (Barmpoutis et al., 2008; Reisert et al., 2012; Cetin Karayumak et al., 2018). This allows the AFODFs to be estimated directly from the diffusion-weighted images.
We have demonstrated that AFODFs are successful in mitigating gyral bias with fuller coverage of both gyral crowns and sulcal banks (Figure 13). Unlike existing methods for mitigating gyral bias (Girard et al., 2014; Smith et al., 2012; Heidemann et al., 2012; St-Onge et al., 2018; Teillac et al., 2017), the proposed method does not rely on specialized high-resolution imaging techniques and anatomical priors that are derived, for example, from T1-weighted images.
Mitigating gyral bias is also important for reliable inference of anatomical pathways connecting cortical regions (Schilling et al., 2018; Reveley et al., 2015). With the proposed method, over 95% of streamlines initiated from cortical GM voxels connect to another cortical GM voxels (Figure 14) with high consistency across different field strengths. Mitigating gyral bias also improves tract reproducibility (Figures 19 – 22). These results provide evidence indicating that improving tractography in the superficial WM helps detection of long-range cortical connections (Reveley et al., 2015).
While effective, our method has the following limitations that can be addressed in the future:
A fixed set of fiber RFs throughout the whole brain, ignoring spatial changes associated with, for example, brain development (Wu et al., 2019).
Multi-shell data are required to tease out the signal contributions from multiple compartments and single-shell data might not work well with our method.
The geometry of the cortical surface is not taken into account to improve tractography (St-Onge et al., 2018).
5. Conclusion
In this work, we have presented a method for estimation of asymmetric fiber orientation distribution functions (AFODFs) with a multi-tissue global framework to mitigate gyral bias in cortical tractography. Our method allows robust estimation of realistic subvoxel fiber configurations. We showed that fiber streamlines at gyral blades were able to make sharper turns in gyral blades into the cortical gray matter with AFODFs than conventional FODFs. We also showed that AFODF tractography results in better cortico-cortical connectivity. Experimental results also indicate that our method yields greater consistency across different imaging conditions. Comparison with histological data also confirms the efficacy our method.
Table 3:
Labels of gyri and sulci (Destrieux et al., 2010).
| ID | Name |
|---|---|
| 1 | ctx_lh_Lat_Fis-ant-Horizont |
| 2 | ctx_lh_Lat_Fis-ant-Vertical |
| 3 | ctx_lh_Lat_Fis-post |
| 4 | ctx_lh_Pole_occipital |
| 5 | ctx_lh_Pole_temporal |
| 6 | ctx_lh_S_calcarine |
| 7 | ctx_lh_S_central |
| 8 | ctx_lh_S_cingul-Marginalis |
| 9 | ctx_lh_S_circular_insula_ant |
| 10 | ctx_lh_S_circular_insula_inf |
| 11 | ctx_lh_S_circular_insula_sup |
| 12 | ctx_lh_S_collaL_transv_ant |
| 13 | ctx_lh_S_collaL_transv_post |
| 14 | ctx_lh_S_front_inf |
| 15 | ctx_lh_S_front_middle |
| 16 | ctx_lh_S_front_sup |
| 17 | ctx_lh_S_interm_prim-Jensen |
| 18 | ctx_lh_S_intrapariet_and_P_trans |
| 19 | ctx_lh_S_oc_middle_and_Lunatus |
| 20 | ctx_lh_S_oc_sup_and_transversal |
| 21 | ctx_lh_S_occipital_ant |
| 22 | ctx_lh_S_oc-temp_lat |
| 23 | ctx_lh_S_oc-temp_med_and_Lingual |
| 24 | ctx_lh_S_orbital_lateral |
| 25 | ctx_lh_S_orbital_med-olfact |
| 26 | ctx_lh_S_orbital-H_Shaped |
| 27 | ctx_lh_S_parieto_occipital |
| 28 | ctx_lh_S_pericallosal |
| 29 | ctx_lh_S_postcentral |
| 30 | ctx_lh_S_precentral-inf-part |
| 31 | ctx_lh_S_precentral-sup-part |
| 32 | ctx_lh_S_suborbital |
| 33 | ctx_lh_S_subparietal |
| 34 | Ctx_lh_S_temporal_inf |
| 35 | ctx_lh_S_temporal_sup |
| 36 | ctx_rh_Lat_Fis-ant-Horizont |
| 37 | ctx_rh_Lat_Fis-ant-Vertical |
| 38 | ctx_rh_Lat_Fis-post |
| 39 | ctx_rh_Pole_occipital |
| 40 | ctx_rh_Pole_temporal |
| 41 | ctx_rh_S_calcarine |
| 42 | ctx_rh_S_central |
| 43 | ctx_rh_S_cingul-Marginalis |
| 44 | ctx_rh_S_circular_insula_ant |
| 45 | ctx_rh_S_circular_insula_inf |
| 46 | ctx_rh_S_circular_insula_sup |
| 47 | ctx_rh_S_collat_transv_ant |
| 48 | ctx_rh_S_collat_transv_post |
| 49 | ctx_rh_S_front_inf |
| 50 | ctx_rh_S_front_middle |
| 51 | ctx_rh_S_front_sup |
| 52 | ctx_rh_S_interm_prim-Jensen |
| 53 | ctx_rh_S_intrapariet_and_P_trans |
| 54 | ctx_rh_S_oc_middle_and_Lunatus |
| 55 | ctx_rh_S_oc_sup_and_transversal |
| 56 | ctx_rh_S_occipital_ant |
| 57 | ctx_rh_S_oc-temp_lat |
| 58 | ctx_rh_S_oc-temp_med_and_Lingual |
| 59 | ctx_rh_S_orbital_lateral |
| 60 | ctx_rh_S_orbital_med-olfact |
| 61 | ctx_rh_S_orbital-H_Shaped |
| 62 | ctx_rh_S_parieto_occipital |
| 63 | ctx_rh_S_pericallosal |
| 64 | ctx_rh_S_postcentral |
| 65 | ctx_rh_S_precentral-inf-part |
| 6 | ctx_rh_S_precentral-sup-part |
| 67 | ctx_rh_S_suborbital |
| 68 | ctx_rh_S_subparietal |
| 69 | ctx_rh_S_temporal_inf |
| 70 | ctx_rh_S_temporal_sup |
| 71 | ctx_lh_G_cingul-Post-dorsal |
| 72 | ctx_lh_G_cingul-Post-ventral |
| 73 | ctx_lh_G_cuneus |
| 74 | ctx_lh_G_front_inf-Opercular |
| 75 | ctx_lh_G_front_inf-Orbital |
| 76 | ctx_lh_G_front_inf-Triangul |
| 77 | ctx_lh_G_front_middle |
| 78 | ctx_lh_G_front_sup |
| 79 | ctx_lh_G_Ins_lg_and_S_cent_ins |
| 80 | ctx_lh_G_insular_short |
| 81 | ctx_lh_G_occipital_middle |
| 82 | ctx_lh_G_occipital_sup |
| 83 | ctx_lh_G_oc-temp_lat-fusifor |
| 84 | ctx_lh_G_oc-temp_med-Lingual |
| 85 | ctx_lh_G_oc-temp_med-Parahip |
| 86 | ctx_lh_G_orbital |
| 87 | ctx_lh_G_pariet_inf-Angular |
| 88 | ctx_lh_G_pariet_inf-Supramar |
| 89 | ctx_lh_G_parietal_sup |
| 90 | ctx_lh_G_postcentral |
| 91 | ctx_lh_G_precentral |
| 92 | ctx_lh_G-precuneus |
| 93 | ctx_lh_G_rectus |
| 94 | ctx_lh_G_subcallosal |
| 95 | ctx_lh_G_temp_sup-G_T_transv |
| 96 | ctx_lh_G_temp_sup-Lateral |
| 97 | ctx_lh_G_temp_sup-Plan_polar |
| 98 | ctx_lh_G_temp_sup-Plan_tempo |
| 99 | ctx_lh_G_temporal_inf |
| 100 | ctx_lh_G-temporal_middle |
| 101 | ctx_rh_G_cingul-Post-dorsal |
| 102 | ctx_rh_G_cingul-Post-ventral |
| 103 | ctx_rh_G_cuneus |
| 104 | ctx_rh_G_front_inf-Opercular |
| 105 | ctx_rh_G_front_inf-Orbital |
| 106 | ctx_rh_G_front_inf-Triangul |
| 107 | ctx_rh_G_front_middle |
| 108 | ctx_rh_G_front_sup |
| 109 | ctx_rh_G_Ins_lg_and_S_cent_ins |
| 110 | ctx_rh_G_insular_short |
| 111 | ctx_rh_G_occipital_middle |
| 112 | ctx_rh_G_occipital_sup |
| 113 | ctx_rh_G_oc-temp_lat-fusifor |
| 114 | ctx_rh_G_oc-temp_med-Lingual |
| 115 | ctx_rh_G_oc-temp_med-Parahip |
| 116 | ctx_rh_G_orbital |
| 117 | ctx_rh_G_pariet_inf-Angular |
| 118 | ctx_rh_G_pariet_inf-Supramar |
| 119 | ctx_rh_G_parietal_sup |
| 120 | ctx_rh_G_postcentral |
| 121 | ctx_rh_G_precentral |
| 122 | ctx_rh_G_precuneus |
| 123 | ctx_rh_G_rectus |
| 124 | ctx_rh_G_subcallosal |
| 125 | ctx_rh_G_temp_sup-G_T_transv |
| 126 | ctx_rh_G_temp_sup-Lateral |
| 127 | ctx_rh_G_temp_sup-Plan_polar |
| 128 | ctx_rh_G_temp_sup-Plan_tempo |
| 129 | ctx_rh_G_temporal_inf |
| 130 | ctx_rh_G_temporal_middle |
Highlights.
Gyral bias can be mitigated by asymmetric fiber orientation distribution functions (AFODFs).
Novel estimation technique to simultaneously solve for the AFODFs of all voxels subject to the fiber continuity constraint.
Extensive evaluations demonstrate that AFODF tractography improves cortico-cortical connectivity and is highly consistent across field strengths.
Method effectiveness confirmed by evaluation with histological data.
6. Acknowledgment
This work was supported in part by NIH grants (NS093842, EB022880, and EB006733) and an NSFC grant (61379020). Data were provided in part by the Human Connectome Project, WU-Minn Consortium (Principal Investigators: David Van Essen and Kamil Ugurbil; 1U54MH091657) funded by the 16 NIH Institutes and Centers that support the NIH Blueprint for Neuroscience Research; and by the McDonnell Center for Systems Neuroscience at Washington University. The macaque dataset3 was made available by Schilling et al. (2018).
Footnotes
Publisher's Disclaimer: This is a PDF file of an unedited manuscript that has been accepted for publication. As a service to our customers we are providing this early version of the manuscript. The manuscript will undergo copyediting, typesetting, and review of the resulting proof before it is published in its final form. Please note that during the production process errors may be discovered which could affect the content, and all legal disclaimers that apply to the journal pertain.
References
- Amirbekian B, 2016. Modeling of white matter architecture and networks using diffusion MRI: Tools, methods and applications. Ph.D. thesis, University of California, San Francisco. [Google Scholar]
- Auría A, Daducci A, Thiran JP, Wiaux Y, 2015. Structured sparsity for spatially coherent fibre orientation estimation in diffusion MRI. NeuroImage 115, 245–255. [DOI] [PubMed] [Google Scholar]
- Barmpoutis A, Vemuri BC, Howland D, Forder JR, 2008. Extracting tractosemas from a displacement probability field for tractography in DW-MRI. In: International Conference on Medical Image Computing and Computer-Assisted Intervention Springer, pp. 9–16. [DOI] [PMC free article] [PubMed] [Google Scholar]
- Bastiani M, Cottaar M, Dikranian K, Ghosh A, Zhang H, Alexander DC, Behrens TE, Jbabdi S, Sotiropoulos SN, 2017. Improved tractography using asymmetric fibre orientation distributions. NeuroImage 158 (December 2016), 205–218. [DOI] [PMC free article] [PubMed] [Google Scholar]
- Boyd S, Parikh N, Chu E, Peleato B, Eckstein J, et al. , 2011. Distributed optimization and statistical learning via the alternating direction method of multipliers. Foundations and Trends® in Machine learning 3 (1), 1–122. [Google Scholar]
- Calamante F, Tournier JD, Jackson GD, Connelly A, 2010. Track-density imaging (TDI): Super-resolution white matter imaging using whole-brain trackdensity mapping. NeuroImage 53 (4), 1233–1243. [DOI] [PubMed] [Google Scholar]
- Cetin Karayumak S, Özarslan E, Unal G, 2018. Asymmetric orientation distribution functions (AODFs) revealing intravoxel geometry in diffusion MRI. Magnetic Resonance Imaging 49, 145–158. [DOI] [PubMed] [Google Scholar]
- Côté MA, Girard G, Boré A, Garyfallidis E, Houde JC, Descoteaux M, October 2013. Tractometer: Towards validation of tractography pipelines. Medical Image Analysis 17 (7), 844–857. [DOI] [PubMed] [Google Scholar]
- Destrieux C, Fischl B, Dale A, Halgren E, 2010. Automatic parcellation of human cortical gyri and sulci using standard anatomical nomenclature. Neuroimage 53 (1), 1–15. [DOI] [PMC free article] [PubMed] [Google Scholar]
- Dyrby TB, Baaré WF, Alexander DC, Jelsing J, Garde E, Søgaard LV, 2011. An ex vivo imaging pipeline for producing high-quality and high-resolution diffusion-weighted imaging datasets. Human brain mapping 32 (4), 544–563. [DOI] [PMC free article] [PubMed] [Google Scholar]
- Ehricke H-H, Otto K-M, Klose U, 2011. Regularization of bending and crossing white matter fibers in MRI q-ball fields. Magnetic resonance imaging 29 (7), 916–926. [DOI] [PubMed] [Google Scholar]
- Frank LR, June 2002. Characterization of anisotropy in high angular resolution diffusion-weighted MRI. Magnetic Resonance in Medicine 47 (6), 1083–1099. [DOI] [PubMed] [Google Scholar]
- Garyfallidis E, Brett M, Amirbekian B, Rokem A, van der Walt S, Descoteaux M, Nimmo-Smith I, February 2014. Dipy, a library for the analysis of diffusion MRI data. Frontiers in Neuroinformatics 8, 8. [DOI] [PMC free article] [PubMed] [Google Scholar]
- Girard G, Whittingstall K, Deriche R, Descoteaux M, September 2014. Towards quantitative connectivity analysis: Reducing tractography biases. NeuroImage 98, 266–278. [DOI] [PubMed] [Google Scholar]
- Goh A, Lenglet C, Thompson PM, Vidal R, 2009. Estimating orientation distribution functions with probability density constraints and spatial regularity. In: International Conference on Medical Image Computing and Computer-Assisted Intervention Springer, pp. 877–885. [DOI] [PubMed] [Google Scholar]
- Heidemann RM, Anwander A, Feiweier T, Knösche TR, Turner R, 2012. k-space and q-space: Combining ultra-high spatial and angular resolution in diffusion imaging using ZOOPPA at 7T. NeuroImage 60 (2), 967–978. [DOI] [PubMed] [Google Scholar]
- Hess CP, Mukherjee P, Han ET, Xu D, Vigneron DB, July 2006. Q-ball reconstruction of multimodal fiber orientations using the spherical harmonic basis. Magnetic Resonance in Medicine 56 (1), 104–117. [DOI] [PubMed] [Google Scholar]
- Jeurissen B, Descoteaux M, Mori S, Leemans A, September 2017. Diffusion MRI fiber tractography of the brain. NMR in Biomedicine, e3785. [DOI] [PubMed] [Google Scholar]
- Jeurissen B, Tournier JD, Dhollander T, Connelly A, Sijbers J, 2014. Multi-tissue constrained spherical deconvolution for improved analysis of multi-shell diffusion MRI data. NeuroImage 103, 411–426. [DOI] [PubMed] [Google Scholar]
- Johansen-Berg H, Behrens TE, 2013. Diffusion MRI: from quantitative measurement to in vivo neuroanatomy. Academic Press. [Google Scholar]
- Kumar R, Barmpoutis A, Vemuri BC, Carney PR, Mareci TH, Jun. 2008. Multi-fiber reconstruction from DW-MRI using a continuous mixture of von Mises-Fisher distributions In: Proc. IEEE Computer Society Conf. Computer Vision and Pattern Recognition Workshops. IEEE, pp. 1–8. [Google Scholar]
- Leuze CW, Anwander A, Bazin PL, Dhital B, Stüber C, Reimann K, Geyer S, Turner R, February 2014. Layer-specific intracortical connectivity revealed with diffusion MRI. Cerebral Cortex 24 (2), 328–339. [DOI] [PMC free article] [PubMed] [Google Scholar]
- Maier-Hein KH, Neher PF, Houde JC, Côté MA, Garyfallidis E, Zhong J, Chamberland M, Yeh FC, Lin YC, Ji Q, Reddick WE, Glass JO, Chen DQ, Feng Y, Gao C, Wu Y, Ma J, Renjie H, Li Q, Westin CF, Deslauriers-Gauthier S, González JOO, Paquette M, St-Jean S, Girard G, Rheault F, Sidhu J, Tax CM, Guo F, Mesri HY, Dávid S, Froeling M, Heemskerk AM, Leemans A, Boré A, Pinsard B, Bedetti C, Desrosiers M, Brambati S, Doyon J, Sarica A, Vasta R, Cerasa A, Quattrone A, Yeatman J, Khan AR, Hodges W, Alexander S, Romascano D, Barakovic M, Auría A, Esteban O, Lemkaddem A, Thiran JP, Cetingul HE, Odry BL, Mailhe B, Nadar MS, Pizzagalli F, Prasad G, Villalon-Reina JE, Galvis J, Thompson PM, Requejo FDS, Laguna PL, Lacerda LM, Barrett R, Dell’Acqua F, Catani M, Petit L, Caruyer E, Daducci A, Dyrby TB, Holland-Letz T, Hilgetag CC, Stieltjes B, Descoteaux M, December 2017. The challenge of mapping the human connectome based on diffusion tractography. Nature Communications 8 (1), 1349. [DOI] [PMC free article] [PubMed] [Google Scholar]
- Makris N, Worth AJ, Sorensen AG, Papadimitriou GM, Wu O, Reese TG, Wedeen VJ, Davis TL, Stakes JW, Caviness VS, Kaplan E, Rosen BR, Pandya DN, Kennedy DN, 1997. Morphometry of in vivo human white matter association pathways with diffusion-weighted magnetic resonance imaging. Annals of Neurology 42 (6), 951–962. [DOI] [PubMed] [Google Scholar]
- Mardia KV, Jupp PE, 2000. Distributions on spheres. Directional Statistics (i), 159–192. [Google Scholar]
- Mori S, van Zijl PCM, 2002. Fiber tracking: principles and strategies - a technical review. NMR in Biomedicine 15 (7–8), 468–480. [DOI] [PubMed] [Google Scholar]
- Noback CR, Strominger NL, Demarest RJ, Ruggiero DA, 2011. The Little Black Book of Neuropsychology. No. 744. Springer US, Boston, MA. [Google Scholar]
- Pesce M, Repetti A, Auría A, Daducci A, Thiran J-P, Wiaux Y, 2018. Fast fiber orientation estimation in diffusion MRI from kq-space sampling and anatomical priors. arXiv preprint arXiv:1802.02912. [DOI] [PMC free article] [PubMed] [Google Scholar]
- Reisert M, Kellner E, Kiselev VG, 2012. About the geometry of asymmetric fiber orientation distributions. IEEE Transactions on Medical Imaging 31 (6), 1240–1249. [DOI] [PubMed] [Google Scholar]
- Reveley C, Seth AK, Pierpaoli C, Silva AC, Yu D, Saunders RC, Leopold DA, Ye FQ, 2015. Superficial white matter fiber systems impede detection of long-range cortical connections in diffusion MR tractography. Proceedings of the National Academy of Sciences 112 (21), E2820–E2828. [DOI] [PMC free article] [PubMed] [Google Scholar]
- Robertson RT, 1978. Neuroanatomical research techniques. Academic Press. [Google Scholar]
- Schilling K, Gao Y, Janve V, Stepniewska I, Landman BA, Anderson AW, 2018. Confirmation of a gyral bias in diffusion MRI fiber tractography. Human Brain Mapping 39 (3), 1449–1466. [DOI] [PMC free article] [PubMed] [Google Scholar]
- Schwab E, Haeffele B, Charon N, Vidal R, 2018a. Separable dictionary learning with global optimality and applications to diffusion MRI. arXiv preprint arXiv:1807.05595. [Google Scholar]
- Schwab E, Vidal R, Charon N, 2018b. Joint spatial-angular sparse coding for dMRI with separable dictionaries. Medical image analysis 48, 25–42. [DOI] [PubMed] [Google Scholar]
- Shevlyakov G, Smirnov P, 2011. Robust estimation of the correlation coefficient: An attempt of survey. Austrian Journal of Statistics 40 (1&2), 147–156. [Google Scholar]
- Smith RE, Tournier JD, Calamante F, Connelly A, September 2012. Anatomicallyconstrained tractography: Improved diffusion MRI streamlines tractography through effective use of anatomical information. NeuroImage 62 (3), 1924–1938. [DOI] [PubMed] [Google Scholar]
- Sotiropoulos SN, Hernández-Fernández M, Vu AT, Andersson JL, Moeller S, Yacoub E, Lenglet C, Ugurbil K, Behrens TE, Jbabdi S, July 2016. Fusion in diffusion MRI for improved fibre orientation estimation: An application to the 3T and 7T data of the human connectome project. NeuroImage 134, 396–409. [DOI] [PMC free article] [PubMed] [Google Scholar]
- St-Onge E, Daducci A, Girard G, Descoteaux M, 2018. Surface-enhanced tractography (SET). NeuroImage 169, 524–539. [DOI] [PubMed] [Google Scholar]
- Stellato B, Banjac G, Goulart P, Bemporad A, Boyd S, 2018. Osqp: An operator splitting solver for quadratic programs. In: 2018 UKACC 12th International Conference on Control (CONTROL) IEEE, pp. 339–339. [Google Scholar]
- Streiner DL, 2003. Starting at the beginning: an introduction to coefficient alpha and internal consistency. Journal of personality assessment 80 (1), 99–103. [DOI] [PubMed] [Google Scholar]
- Teillac A, Beaujoin J, Poupon F, Mangin JF, Poupon C, 2017. A novel anatomically-constrained global tractography approach to monitor sharp turns in gyri In: Lecture Notes in Computer Science (including subseries Lecture Notes in Artificial Intelligence and Lecture Notes in Bioinformatics). Vol. 10433 LNCS. Springer, pp. 532–539. [Google Scholar]
- Tournier JD, Calamante F, Connelly A, 2007. Robust determination of the fibre orientation distribution in diffusion MRI: Non-negativity constrained superresolved spherical deconvolution. NeuroImage 35 (4), 1459–1472. [DOI] [PubMed] [Google Scholar]
- Tournier JD, Calamante F, Connelly A, March 2012. MRtrix: Diffusion tractography in crossing fiber regions. International Journal of Imaging Systems and Technology 22 (1), 53–66. [Google Scholar]
- Tournier JD, Calamante F, Gadian DG, Connelly A, 2004. Direct estimation of the fiber orientation density function from diffusion-weighted MRI data using spherical deconvolution. NeuroImage 23 (3), 1176–1185. [DOI] [PubMed] [Google Scholar]
- Van Essen DC, Jbabdi S, Sotiropoulos SN, Chen C, Dikranian K, Coalson T, Harwell J, Behrens TE, Glasser MF, 2013a. Mapping connections in humans and non-human primates. aspirations and challenges for diffusion imaging In: Diffusion MRI: From Quantitative Measurement to In vivo Neuroanatomy: Second Edition Elsevier, pp. 337–358. [Google Scholar]
- Van Essen DC, Smith SM, Barch DM, Behrens TE, Yacoub E, Ugurbil K, October 2013b. The WU-Minn human connectome project: An overview. NeuroImage 80, 62–79. [DOI] [PMC free article] [PubMed] [Google Scholar]
- Wassermann D, Makris N, Rathi Y, Shenton M, Kikinis R, Kubicki M, Westin C-F, Dec. 2016. The white matter query language: a novel approach for describing human white matter anatomy. Brain structure & function 221, 4705–4721. [DOI] [PMC free article] [PubMed] [Google Scholar]
- Wright DK, Johnston LA, Kershaw J, Ordidge R, O’Brien TJ, Shultz SR, 2017. Changes in apparent fiber density and track-weighted imaging metrics in white matter following experimental traumatic brain injury. Journal of neurotrauma 34 (13), 2109–2118. [DOI] [PubMed] [Google Scholar]
- Wu Y, Feng Y, Shen D, Yap P-T, 2018. A Multi-Tissue global estimation framework for asymmetric fiber orientation distributions In: International Conference on Medical Image Computing and Computer-Assisted Intervention. Springer, pp. 45–52. [DOI] [PMC free article] [PubMed] [Google Scholar]
- Wu Y, Lin W, Shen D, Yap P-T, Consortium., U. B. C. P., 2019. Asymmetry spectrum imaging for baby diffusion tractography. In: International Conference on Information Processing in Medical Imaging Springer, pp. 319–331. [DOI] [PMC free article] [PubMed] [Google Scholar]
- Yamada K, Sakai K, Akazawa K, Yuen S, Nishimura T, 2009. MR tractography: A review of its clinical applications. Magnetic Resonance in Medical Sciences 8 (4), 165–174. [DOI] [PubMed] [Google Scholar]
- Yap P-T, An H, Chen Y, Shen D, 2014. Fiber-driven resolution enhancement of diffusion-weighted images. NeuroImage 84, 939–950. [DOI] [PMC free article] [PubMed] [Google Scholar]
- Zhang F, Goodlett C, Hancock E, Gerig G, 2007. Probabilistic fiber tracking using particle filtering. International Conference on Medical Image Computing and Computer-Assisted Intervention 10, 144–152. [DOI] [PubMed] [Google Scholar]


