Abstract
Variable-temperature electrospray ionization combined with ion mobility spectrometry (IMS) and mass spectrometry (MS) techniques are used to monitor structural transitions of the protein myohemerythrin from peanut worm in aqueous ammonium acetate solutions from ~15 to 92 °C. At physiological temperatures, myohemerythrin favors a four-helix bundle motif and has a diiron oxo cofactor that binds oxygen. As the solution temperature is increased from ~15 to 35 °C, some bound oxygen dissociates; at ~66 °C, the cofactor dissociates to produce populations of both folded and unfolded apoprotein. At higher temperatures (~85 °C and above), the IMS-MS spectrum indicates that the folded apoprotein dominates, and provides evidence for stabilization of the structure by formation of a non-native disulfide bond. In total, we find evidence for 18 unique forms of myohemerythrin as well as information about the structures and stabilities of these states. The high-fidelity of IMS-MS techniques provides a means of examining the stabilities of individual components of complex mixtures that are inaccessible by traditional calorimetric and spectroscopic methods.
Graphical Abstract
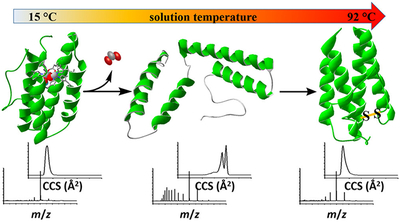
Recently, we developed a variable-temperature (vT) electrospray ionization (ESI) source, coupled with ion mobility spectrometry (IMS) and mass spectrometry (MS) techniques, to investigate structural transitions in the model protein ubiquitin.1 This study provided evidence for nine unique structures upon thermal denaturation. This is somewhat remarkable; it is rare to resolve, let alone characterize, the physical properties of non-native structures.2,3Here, we extend this approach to investigate the stability of myohemerythrin (Mhr), a ~14 kDa oxygen binding protein found in marine invertebrates.4–6 The native structure of Mhr is a four helix bundle that coordinates a diiron oxo [Fe(μ-O)Fe] cofactor that can bind oxygen. Over the range of solution temperatures that are studied (15–92 °C), we find evidence for 18 unique structural forms of Mhr, including oxygen-bound and unbound folded states, observed at low temperatures (15 to ~65 °C); folded and unfolded apoproteins at intermediate temperatures (~50 to ~80 °C); apoforms where the folded structure is stabilized by a non-native disulfide bond (~80 to 92 °C); and folded and unfolded apoproteins with oxidized methionine or cysteine modifications (~83 to 92 °C). Below, we show that the ability to resolve thermal transitions for complex heterogeneous systems based on changes in masses and shapes provides remarkably detailed insight into denatured protein structures and the factors that stabilize such states. Such information is inaccessible by traditional calorimetric and spectroscopic measurements.
The analytical techniques described below build upon a body of pioneering work that explored MS-based methods as a means of studying thermally induced structural transitions.7–9 Soon after the introduction of electrospray ionization (ESI), Chait and co-workers demonstrated changes in charge state distributions upon heating droplets as they were transferred into the mass spectrometers through capillary inlets.10 Kaltoshov and co-workers showed that it was possible to determine a protein’s melting temperature (Tm) by following changes in charge state distributions upon controlling the temperature of the ESI needle.11 Robinson’s group refined and standardized an approach for determining Tm by plotting the weighted average of the charge state distribution as a function of ESI needle temperature.12 This approach for normalization removes ambiguity associated with defining a peak in the mass spectrum as either folded or unfolded, and such analyses yield transition temperatures that are in remarkably close agreement with accepted spectroscopic strategies. Heck and his coworkers used MS to study thermally induced dissociations of the chaperone protein complexes GroES and gp31.13 This work is especially interesting because of the large size of these complexes and demonstrates the ability of MS to identify specific products formed upon thermal disassembly of the complexes.
In the work presented below, we describe a vT-ESI-IMS-MS approach. This combination of techniques provides detailed insight about structural transitions, conformational stability, and chemical modifications. Protein stability is important for function, regulation, and turnover.14,15 Structures with abnormally high stabilities can lead to cytotoxicity from overaccumulation and aggregation;16,17 unstable states may have abnormally short lifetimes and decreased functionalities, as is the case with a number of inherited disorders.18–20 Stability is altered by post-translational modifications, non-covalent ligand binding, formation of protein complexes, and environmental variations21–23 that stabilize or destabilize either native or non-native structures. Little is known about non-native structures. Below we show that it is possible to sample a wide range of structures and modifications that arise upon thermal denaturation with what is now widely available instrumentation. Such detailed information complements existing calorimetric methods, which provide information about when a structure becomes unstable, but lack key details about why this occurs.
EXPERIMENTAL SECTION
Protein Expression and Purification.
A codon optimized gene for Themiste hennahi (Peanut worm) myohemerythrin (Uniprot P02247) was synthesized as a gBlock gene fragment (integrated DNA Technologies, Coralville, IA, U.S.A.). The synthetic DNA contained overhangs to allow for an Infusion cloning reaction (Clontech, Mountain View, CA, U.S.A) with a modified pET28 vector (Novagen, Madison, WI, U.S.A.) that was digested with BamHI and XhoI (New England Biolabs, Ipswich, MA, U.S.A.). The resulting expression construct produced myohemerythrin, harboring an N-terminal TEV protease-cleavable 6× His-tag and maltose binding protein. Recombinant Mhr protein was expressed in E. coli strain Rosetta 2(DE3) (Novagen, Madison, WI, U.S.A.) and grown overnight in the Terrific Broth containing chloramphenicol (34 μg/mL) and kanamycin (50 μg/mL) at 37 °C. The overnight culture was used to inoculate Terrific Broth containing kanamycin (50 μg/mL) and grown at 37 °C until the optical density at 600 nm reached 0.8. The culture was then chilled to 4 °C, 1 mM of isopropyl 1-thio-β-d-galactopyranoside was added, and the culture was grown for 24 h at 20 °C. Cells were harvested by centrifugation at 6000 × g for 10 min at 4 °C. To purify recombinant Mhr, cells were resuspended in 50 mM Tris/HCl (pH 7.4) containing 300 mM NaCl, 20 mM imidazole, and 10% glycerol. The homogeneous suspension was lysed with 3–4 passes through a Microfluidics M-110P microfluidizer at 20000 psi, and then centrifuged at 30000 × g for 30 min at 4 °C. Protein purification was carried out on an AKTA pure system (GE Healthcare, Chicago, IL, U.S.A.). The supernatant containing recombinant Mhr was then applied onto a HisTrap 5 mL column (GE Healthcare, Chicago, IL, U.S.A.), and eluted with the same buffer containing 500 mM imidazole. Peak fractions containing the tagged Mhr protein were desalted using a HiPrep 26/10 desalting column (GE Healthcare, Chicago, IL, U.S.A.). The purified Mhr was then digested with TEV protease at a ratio of 6.67 μg of TEV per mg of Mhr for overnight in the cold room. The digested sample was then loaded onto a HisTrap 5 mL column and the flow-through was harvested and concentrated. Concentrated material was loaded onto a HiLoad 16/600 Superdex 75pg column (GE Healthcare, Chicago, IL, U.S.A.), which was equilibrated in size-exclusion buffer (20 mM Tris, 150 mM NaCl, pH 7.4) for gel filtration. The fractions containing tagfree Mhr were pooled and concentrated using a Amicon Ultra-15 centrifugal concentrator with 3000 MWCO (Millipore, Burlington, MA, U.S.A.). The protein concentration was determined by DC Protein Assay kit (Bio-Rad, Hercules, CA, U.S.A.) using bovine serum albumin as the standard. Protein samples were buffer exchanged and diluted to 20 μM in 30 mM ammonium acetate (pH 6.8) for analysis.
vT-IMS-MS Experiments.
IMS-MS experiments were performed on a SYNAPT G2 mass spectrometer (Waters, Milford, MA, U.S.A.) with the source interlocks overridden to allow use of a custom-built vT-ESI device.1 A schematic diagram of the vT-ESI source used in the experiments described here is shown in the Supporting Information. Briefly, a nanoelectrospray emitter is housed in a copper block with a channel cut through the center. The block is heated using a Peltier thermoelectric device (TE tech, Traverse City, MI, U.S.A.) that is electrically isolated from the copper block by a 1 cm thick thermally conductive ceramic spacer. A solution containing Mhr (20 μM Mhr in a 30 mM aqueous ammonium acetate solution at pH = 6.8) is pumped through the fused silica line at a flow rate of ~0.5 μL·min−1. An ESI voltage of ~ 1.0–1.5 kV is applied to the solution via a conductive union. The incubation time that the solution spends in the heated region at each temperature can be calculated from the flow rate and the emitter channel volume. In these experiments, the protein is heated for ~2–3 min before reaching the ESI tip. Data recorded using other flow rates and emitter geometries (over a 0.5–5 min incubation time range) yield results that are indistinguishable for those presented below. The solution temperature is monitored by a thermocouple probe in contact with the silica lines (accurate to ±0.5 °C). Fused silica emitters were pulled to a fine point (~20 μm) using a Sutter Instrument P-2000 capillary puller (Sutter Instruments, Novato, CA, U.S.A.). IMS-MS data were extracted using TWIMextract software (University of Michigan, Ann Arbor, MI, U.S.A.)24 and analyzed with OriginPro 2015 (Originlab, Northhampton, MA, U.S.A.). Transition midpoint temperatures were determined using a logistic function to model the experimental data. Ion transmission optics voltages were optimized to minimize gas-phase activation as the ions traversed the instrument. Collision cross section (CCS) values from the traveling wave IMS data were estimated using the protocol described by Ruotolo et al.25 with equine myoglobin used as a calibrant (N2 CCS values),26 and N2 as the drift gas. High-resolution accurate mass measurements of Mhr were performed using an Orbitrap Fusion Lumos mass spectrometer (Thermo Fisher, San Jose, CA, U.S.A.).
Criteria Used To Determine the Number of Unique Resolvable Solution Species.
Different solution species are delineated based on differences in mass, charge state, cross section, melting temperature (Tm), and temperature profile. Mhr binds a diiron oxo cofactor. The intact protein–cofactor complex is the holo-form (hMhr). Upon loss of the cofactor, the apoprotein (aMhr) is formed. These are distinguishable based on differences in mass, as described below. The hMhr complex can bind oxygen and this can also be discerned based on a measured mass difference. The presence of other unique solution structures is inferred from analysis of the temperature dependence of each IMS feature for every charge state that is observed. In some cases, different charge states show similar IMS features (and CCS). If each of the temperature profiles have similar shapes and Tm values, we assume that these ions are formed from the same solution precursor conformer. That is, during the ESI process multiple charge states of the same solution structure are formed. In the data presented below, we identify 53 unique features in the IMS-MS distributions. Upon grouping these data according to similarities in temperature profiles and IMS peak shapes, we find evidence for at least 18 unique components in solution. Because the temperature profiles are recorded simultaneously, even relatively small changes in the temperature profiles are observable. We consider two profiles to correspond to different solution species when values of Tm determined from a sigmoidal fit to the temperature profile differs by more than 1.0 °C or when the abundances of specific species show a different temperature dependence.
Far-UV Circular Dichroism Experiments.
Circular dichroism (CD) melting experiments we performed using a Jasco J-715 CD spectrometer (Jasco Inc., Easton, MD) using a 1 mm path length quartz cuvette (Hellma Analytics, Müllheim, Germany). Sample preparation methods used for IMS-MS experiments were also used in CD experiments (20 μM Mhr, 30 mM ammonium acetate) for comparison purposes.
RESULTS AND DISCUSSION
Determination of the Melting Temperature of Mhr by CD.
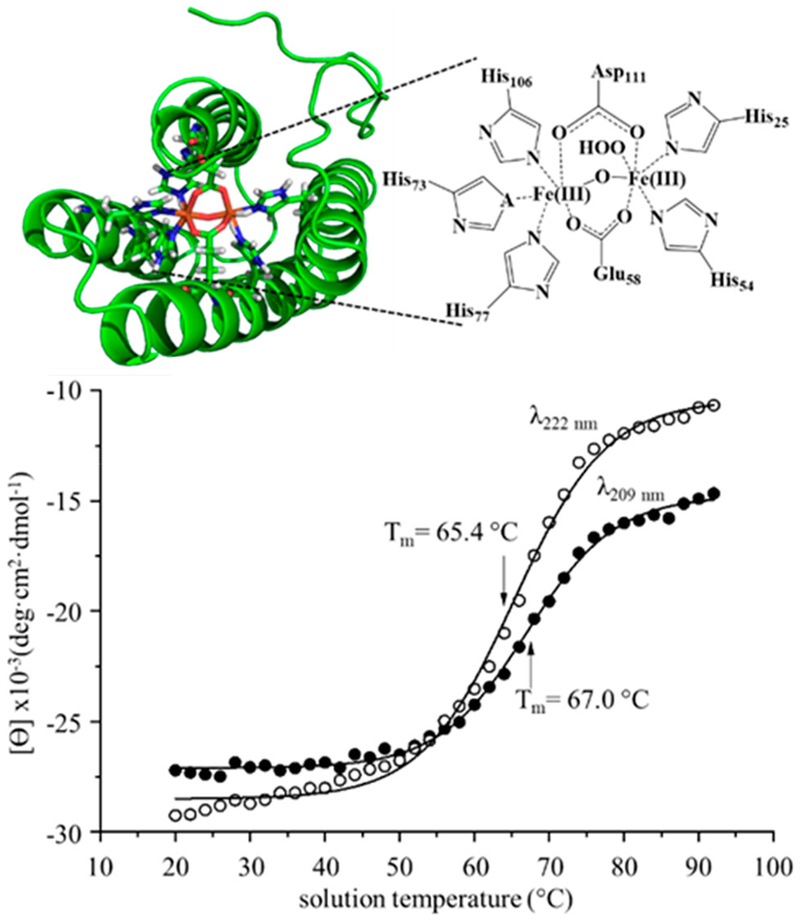
By monitoring the molar ellipticity at λ = 209 and 222 nm, we have determined the melting temperature of Mhr (Figure 1). Inspection of these data shows a transition beginning at ~50 °C that is complete by ~80 °C. From the average midpoint temperatures of sigmoidal fits to both data sets, we determine the melting temperature of Mhr in a 30 mM ammonium acetate solution (pH 6.8) to be ~66.2 ± 0.2 °C.
Figure 1.
Cartoon structure of the Mhr binding site (PDB structure: 2MHR) depicting the five His residues and the two bridging Asp and Glu residues involved with metal cofactor coordination (top panel). One coordination site remains available for O2 binding. Melting curves from CD data monitoring molar ellipticity (θ) at wavelengths 209 (open circles) and 220 nm (closed circles) as a function of solution temperature (bottom panel). Sigmoidal fits to the data results in midpoint melting temperatures of 65.4 ± 0.3 °C (222 nm) and 67.0 ± 0.2 °C (209 nm).
vT-ESI-MS Analysis.
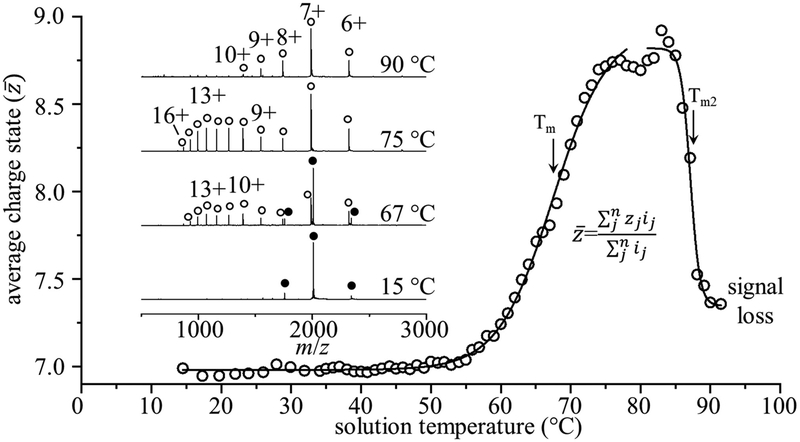
Figure 2 shows example mass spectra acquired at ESI solution temperatures of 15, 67, 75, and 90 °C and the weighted average charge state determined for all of the temperatures that were examined in this study. At the lowest temperature studied, we observe the +6, +7, and +8 charge states for the cofactor bound holoMhr (hMhr) form of the protein. The narrow range of this distribution centered about the relatively low charge state hMhr7+ species is consistent with the ionization of a folded structure at this temperature. At 67 °C, hMhr7+ is still the largest peak in the mass spectrum; in addition, a new broad distribution of highly charged +9 to +16 species is observed. These new ions correspond to a mass that is 127.7 Da less than the intact holo form of the protein, indicating that the diiron oxo cofactor has dissociated from the protein, corresponding to the apoprotein (aMhr). At 75 °C the cofactor has completely dissociated. The observation of the high-charge state distribution suggests that when the diiron oxo cofactor dissociates, the aMhr species unfolds.27 The unfolded protein allows access to interior basic residues that are protonated to form these highly charged ions. Interestingly, as the temperature is increased to 90 °C, the aMhr charge state distribution shifts back to lower charge states. Apparently, at high temperatures, the protein adopts a compact structure that protects some of the basic sites that were exposed at intermediate temperatures upon cofactor loss.
Figure 2.
Weighted average charge state as a function of solution temperature with midpoint melting temperature Tm = 67.5 ± 2.2 °C, and a second transition at Tm2 = 87.1 ± 3.0 °C. Inset mass spectra show shifts in charge state, and dissociation of the cofactor from the holoprotein to form the apo state with increasing temperature. Filled circles represent the holoprotein, and open circles denote the apoprotein. A table of all observed m/z values is provided in the Supporting Information (Table S1).
Figure 2 also shows a plot of the weighted average charge state as a function of solution temperature. The change in average charge state that is shown reflects an average of all species, including the hMhr and aMhr forms of the protein. This plot is interesting to consider, as it should be similar to a melting curve that would be obtained by traditional bulk measurements, where individual components are not distinguishable. Overall, the shapes of the melting curves obtained from the vT-ESI-IMS-MS and CD measurements (Figure 1) are similar. First considering the average (ensemble) measurements, the sigmoidal curves observed from both techniques are consistent with a cooperative two-state transition and yield melting temperatures (Tm) of 67.5 ± 2.2 °C as measured by MS and 66.2 ± 0.2 °C from CD, in close agreement. Second, unlike CD measurements, vT-ESI-IMS-MS measurements provide additional insight into solution species upon thermal denaturation that can be differentiated from the ensemble behavior. The Tm values for unfolding and for cofactor loss (shown in Figure 3) are nearly identical, indicating that these are likely coupled events. At higher temperatures, the MS analysis shows an additional shift to lower average charge state; this shift also fits to a two-state model and suggests an additional structural change, having a transition temperature of Tm = 87.1 ± 3.0 °C. The decrease in average charge state is atypical of previous MS-based experiments1,7–12 and suggests that, at very high temperatures, the aMhr species adopts a compact conformation, having a “native-like” charge state distribution. This is discussed in detail below.
Figure 3.
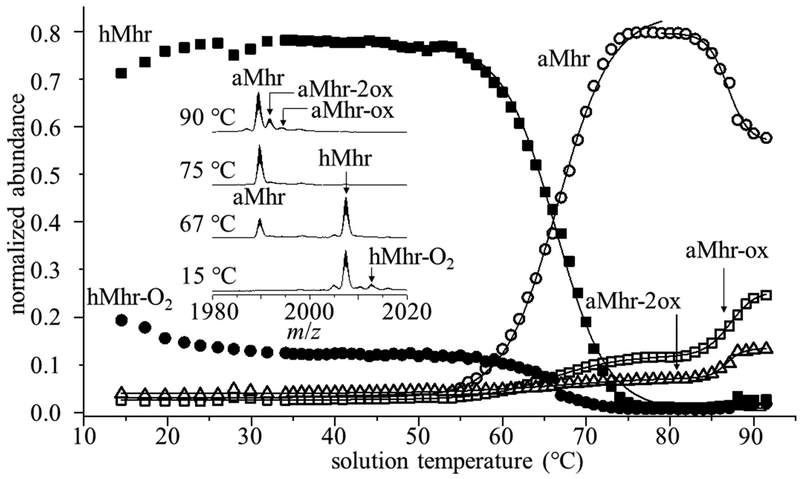
Overall melting behavior from all charge states of hMhr (filled squares), hMhr-O2(filled circles), aMhr (open circles), aMhrox (open squares), and aMhr-2ox (open triangles). Mass spectra of the +7 charge state at four representative temperatures (15, 67, 75, and 90 °C) showing changes in ligation state with increasing solution temperature (inset).
Influence of the Cofactor on the Overall Charge State.
So far, we have interpreted the overall change in charge state with increasing temperature as a result of dissociation of the diiron cofactor, followed by cooperative transition to unfolded aMhr species. While this interpretation is simplistic, the change in charge associated with loss of the diiron oxo cofactor is complicated, since the cofactor is also charged. High-resolution accurate mass measurements of this system indicate that the iron atoms in the cofactor contribute an overall 4+ charge in hMhr, with the remaining ionic charge coming from protonation of basic residues, for example, [M + FeIII(μ-O)FeIII + nH](n+4)+ (see Supporting Information). Upon dissociation of the cofactor, five buried histidine residues (His25, His54, His73, His77, and His106) involved in cofactor coordination are exposed (Figure 1), which can partially account for the shift in average charge observed in the multiply protonated aMhr ions ([M + nH]n+). Each helix in the bundle contributes at least one histidine residue coordinating the diiron cofactor, suggesting that the cofactor acts to stabilize and hold together the four-helix bundle, preserving the native structure. At 86 °C, there is a shift in charge state toward lower charged aMhr species, having an average charge state similar to the low-temperature native Mhr distribution.
Evidence for Bound O2.
For data recorded at the lowest temperatures, close inspection of each charge state reveals several peaks in the mass spectrum that appear to correspond to noncovalent binding of oxygen to hMhr (Figure 3). At low temperatures, we observe a peak at m/z = 2007.3 that we assign to the +7 charge state of hMhr and an additional small peak at an m/z = 2012.7. Based on high-resolution mass measurements of this sample (see Supporting Information), we assign the small peak at m/z 2012.7 as the oxygen-bound protein, hMhr-O2. The summed abundance of this species across all charge states exhibits an interesting temperature dependence (Figure 3). It is the only form of Mhr that loses abundance in our lowest temperature range (from ~15 to 30 °C). Additionally, when the sample solution is bubbled with O2 immediately prior to analysis, the abundance of this peak increases. These changes suggest that this analysis is sensitive to weak noncovalent interactions that lead to binding of O2, presumably to the diiron oxo cofactor.
Above ~30 °C, the intensity of m/z = 2012.7 peak levels off, as shown in the abundance plot of Figure 3, and eventually (e.g., the 75 °C data shown in Figure 3) it disappears entirely. The midpoint for loss of noncovalently bound O2 (Tm = 65.3 °C) is near the temperature associated with cofactor loss (Tm = 66.3 °C) and unfolding. One interpretation for this interesting behavior is that there is more than one type of bound oxygen and perhaps two different binding sites associated with the noncovalent hMhr-O2. Oxygen has been reported to bind to the metal cofactor in the active site via a two-electron oxidation/internal proton transfer reaction, where oxygen is formally bound as a hydroperoxo (OOH−) ligand.28 Another possible explanation is that the abundance profile reflects an hMhr-O2 ↔ hMhr + O2 solution equilibrium. In this case, the decrease in hMhr-O2 abundance observed from ~15 to 30 °C reflects the decreased solubility of O2 at higher solution temperatures.29 Finally, the relatively constant abundance of the m/z = 2012.7 species (comprising ~10% of the signal from ~30 to 60 °C) may suggest that at elevated temperatures a more stable species is formed. For example, the diiron oxo cofactor might react with O2 to form Fe2O3 (rust). While we cannot rule this out, it seems unlikely since loss of the O2-bound ligand occurs at Tm = 65.3 °C, near Tm = 66.3 °C required for cofactor dissociation. It seems likely that formation of Fe2O3 would have a substantial impact on how the protein coordinates the ligand and thus a measurably different melting temperature.
Oxidation of aMhr.
At very high solution temperatures (~85 °C and higher), several new peaks (e.g., m/z = 1992.1 and m/z = 1994.3 in the +7 charge state) are observed. These m/z shifts correspond to ~16 and ~32 Da increases in the aMhr mass, consistent with incorporation of one or two oxygen atoms into the apo species. We observe these peaks after dissociation of the iron cofactor and hydroperoxide species and tentatively assign them as products of oxidation (e.g., at side chains of Met, and Cys residues) and denote them aMhr-ox and aMhr-2ox. We note that others have described an auto-oxidation reaction in hMhr-O2 leading to the displacement of O2 from the diiron oxo metal center in the form of H2O2.28,30 H2O2 is capable of oxidizing Met and Cys residues, as well as generating stronger oxidizing agents, by reaction with iron from the cofactor.31 This auto-oxidation provides an interesting look at oxidative stress, which one normally thinks of in a cellular context. In the case of hMhr, dissociation of the diiron oxo cofactor not only is associated with a conformational change, producing the unfolded aMhr species, it also leads to a chemical modification. A list of m/z values for all observed Mhr species is provided in the Supporting Information.
Analysis of IMS Distributions.
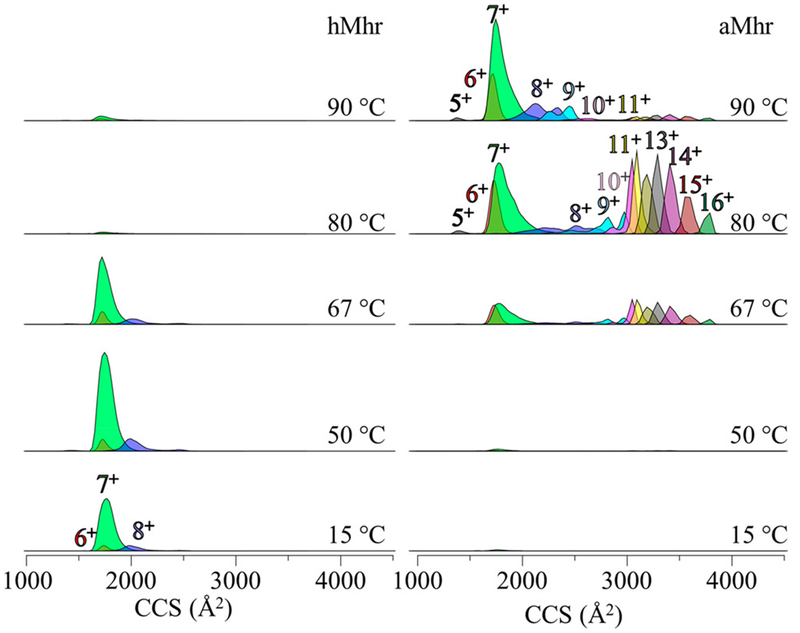
The MS analysis provided above resolves five independent protein forms associated with thermal denaturation of Mhr. These include (1) the hMhr precursor, that is the most abundant species below ~66 °C; (2) the lower-abundance, oxygen-bound hMhr-O2 complex that is observed from ~15 to 30 °C (and possibly other oxygen containing hMhr forms as discussed above); (3) the aMhr product of melting that becomes the dominant species above 66 °C; and (4) the aMhr-ox and (5) aMhr-2ox species that likely involve oxidation of Met or Cys residues. Additional Mhr structures are resolved upon examining the IMS distributions for each of the mass-resolved species. Figure 4 shows the CCS distributions determined from IMS measurements of several charge states for hMhr and aMhr at five representative temperatures along the melting curve (15, 50, 67, 80, and 90 °C). At low solution temperatures (15 to ~67 °C), where the +6, +7, and +8 hMhr peaks are most abundant, we observe sharp peaks centered at CCS ~ 1740, 1770, and 1995 Å,2 respectively. At higher temperatures, the aMhr is favored and a broad distribution of charge states (+5 to +16) is distributed across a much wider range, from CCS ~ 1400 to 3800 Å2. The wider range of cross sections for aMhr charge states is consistent with the idea that unfolded structures are favored. Interestingly, when the solution temperature is increased beyond ~80 °C the fraction of elongated highly charged aMhr species decreases and compact aMhr species are most abundant.
Figure 4.
CCS distributions of each charge state over a range of five temperatures from 15–90 °C for the holo state (left) and the apo state (right).
Evidence for Formation of a Non-Native Disulfide Bond in aMhr above ~80 °C.
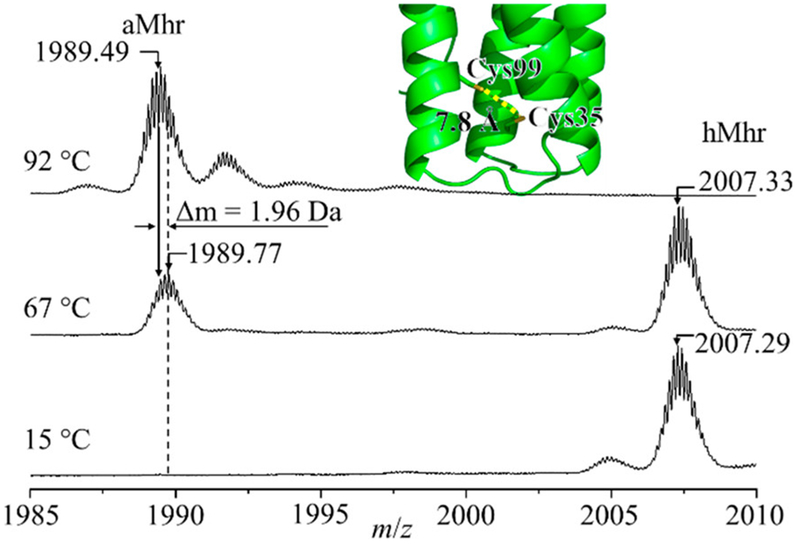
The formation of more compact folded aMhr structures at high temperatures suggests that new interactions must stabilize a native-like, compact structure(s). Such stabilization may be explained by the formation of a non-native disulfide bond between Cys35 and Cys99, effectively cross-linking two of the four helices together. The native crystal structure (PDB entry 2MHR)5 shows Cys35 and Cys99 are located 7.8 Å apart, suggesting a linkage between the two side chains is plausible in the oxidizing environment associated with O2 and cofactor dissociation into solution. Oxidation of two free thiol side chains to form a disulfide bond is accompanied by a decrease in the overall mass of the protein by 2 Da. Such a subtle change in mass is difficult to resolve for an intact protein; however, a shift in the isotopic peak center of the aMhr species is observed in the temperature range of 68–92 °C corresponding to Δm = −1.96 Da, as shown in Figure 5. There is no shift in the peak center of the hMhr species or the high charge state aMhr ions having extended CCS values (Supporting Information), suggesting this modification is unique to the compact aMhr species formed at high temperatures. The observation of oxidatively modified aMhr-ox species (Figure 3) and the shift to more compact CCS (and lower charge states), as well as the slight shift in observed mass, all suggest that the highly stable, compact aMhr product states arise from the formation of a non-native disulfide bond. This assignment is further supported by liquid chromatography–mass spectrometry (LC-MS) sequencing of Mhr after incubation at 90 °C, which identified an abundance of tryptic peptides cross-linked with a disulfide bond between Cys35 and Cys99 (Supporting Information).
Figure 5.
Mass spectra of Mhr +7 charge state recorded at 15, 67, and 90 °C (left) show a decrease in m/z in the apo state corresponding to a decrease in mass of ~1.96 Da. The positions of Cys99 and Cys35 relative to one another determined from PDB structure 2MHR are shown embedded in the mass spectrum.
Additionally, the unfolding of Mhr appears to be irreversible beyond ~80 °C. Cooling the protein solution after heating to 90 °C does not result in reincorporation of the metal center, and the charge state distribution does not revert back to the native distribution observed prior to heating. When the solution is cooled from 90 to 60 °C (below the Tm = 67.5 °C), the charge state and CCS distributions are nearly identical to what was observed at 90 °C (Supporting Information). The irreversible unfolding at high temperature appears to coincide with the appearance of oxidative modifications to Met and Cys residues, suggesting that the oxidative environment caused by dissociation of the diiron oxo cofactor and the presence of ROS at high temperatures causes irreversible damage to the protein structure, similar to the effects of oxidative stress in a cell.32–34
Assessing the Total Number of Mhr Solution States.
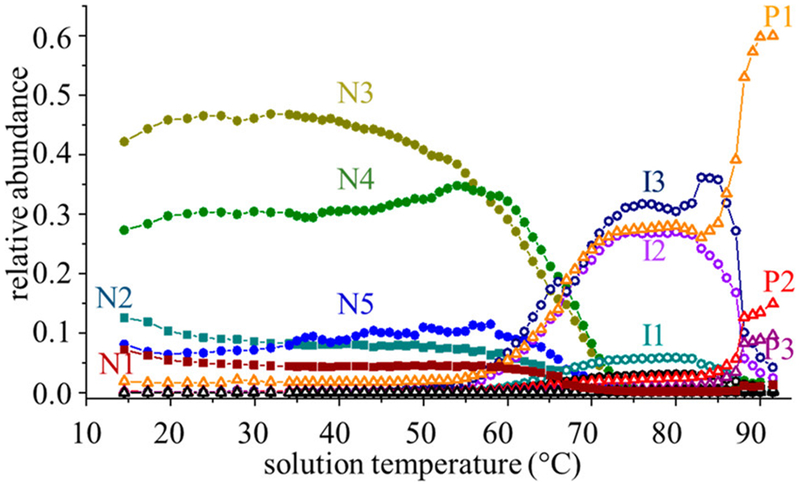
We have created independent melting transition profiles and determined melting temperatures for each of the mobility-resolved species shown in Figure 4. Comparison of melting profiles for the 53 resolved IMS-MS features leads us to assign 16 unique solution conformers. A summary of these groupings is provided in Table 1 (plots and descriptions of transition profiles for each of the resolved peaks are shown in the Supporting Information). Figure 6 shows the combined populations for each of the 11 most abundant species. Briefly, the following solution species are resolved: five native conformer types for the hMhr-O2 species (N1 and N2) and hMhr species (N3, N4, and N5) resolved at relatively low temperatures; three aMhr states that have elongated cross sections (I1, I2, and I3) that are formed upon cofactor loss and persist to ~80 °C; and three aMhr species having compact cross sections that are formed above ~80 °C. As indicated in Table 1, two additional I states and three additional P states are observed in very low abundance (<1%). Finally, as shown in Figure 3, we find evidence for two additional oxidized apo forms, aMhr-ox, and aMhr-2ox, for a total of 18 resolvable states resulting from thermal denaturation.
Table 1.
Assignments of IMS-MS Features to Conformer Types Based on Melting Profiles
| species | conformer | IMS-MS features grouped: (z(+),a CCSb (Å2), Tm|Tfc (°C)) |
|---|---|---|
| hMhr-O2 | N1 | (6, 1571, 65.0); (7, 1745, 65.9); (8, 1995, 65.8) |
| hMhr-O2 | N2 | (6, 1737, 63.2); (7, 1767, 62.3); (8, 2222, 62.3) |
| hMhr | N3 | (7, 1768, 62.8) |
| hMhr | N4 | (6, 1720, 67.4); (7, 1720, 66.5); (8, 1754, 66.1) |
| hMhr | N5 | (5, 1416, 66.1); (8, 2021, 65.7); (8, 2222, 66.3); (8, 2460, 66.7) |
| aMhr | I1 | (7, 2427, 66.5|86.5); (8, 2664, 65.5|86.4); (9, 2820, 65.1|86.1); (9, 2973, 65.1|85.8) |
| aMhr | I2 | (10, 3048, 66.5|86.6); (11, 3092, 65.9|87.1); (12, 3188, 65.9|87.3) |
| aMhr | I3 | (13, 3290, 65.5|87.5); (14, 3407, 65.5|87.5); (15, 3602, 65.7|87.5); (16, 3790, 66.6|87.5) |
| aMhr | I4 | (8, 2507, 65.2|85.8); (9, 2716, 65.3|86.7); (10, 2840, 67.0|87.7) |
| aMhr | I5 | (5, 1745, 68.0|82.4); (6, 1737, 65.7|87.1) |
| aMhr | P1 | (7, 1790, 65.7|87.3); (7, 1922, 65.8|87.6); (8, 2072, 67.5|87.4) |
| aMhr | P2 | (8, 2197, 66.8|87.4); (8, 2319, 67.1|87.4); (9, 2275, 72.8|87.5) |
| aMhr | P3 | (9, 2445, 76.7|87.4); (10, 2624, 73.8|87.5) |
| aMhr | P4 | (9, 2555, 70.7) |
| aMhr | P5 | (5, 1432, 66.7) |
| aMhr | P6 | (5, 1370, 71.6|85.7) |
Positive mode ESI charge state of ion.
Peak center from collision cross section distribution
Midpoint melting or formation temperature determined from sigmoidal fit of peak area as a function of solution temperature.
Figure 6.
Overall melting behavior of all major observable species associated with the thermal denaturation of Mhr. The native O2 bound hMhr-O2 states (N1 and N2) are indicated with squares, “native-like” hMhr states (N3–N5) are indicated with filled circles, extended aMhr intermediate states (I1–I3) are indicated with open circles, and stable compact aMhr product states (P1–P3) are designated with open triangles.
CONCLUSIONS
The combination of a vT-ESI source with IMS-MS has uncovered structural transitions of Mhr that occur upon thermal denaturation of the protein in solution. The analysis provides evidence for several native conformers with slightly different stabilities suggesting that this technique can resolve ensembles of closely related conformers present in equilibrium. At elevated temperatures diiron oxo cofactor dissociates from the protein and the aMhr form of the protein unfolds. Several distinct partially folded aMhr structures exist in equilibrium at elevated solution temperatures, but are only marginally stable above ~80 °C. Cofactor and oxygen dissociation in solution leads to oxidative modifications (likely to Met and Cys residues) of the protein. We find evidence for a non-native disulfide bond that appears to stabilize a more compact folded apo form that is incapable of reincorporating the metal cofactor. The overall two-state cooperative unfolding transition of Mhr is shown to be a composite of multiple ligand dissociation and structural changes that are not observed by other biophysical methods (e.g., CD).
Supplementary Material
ACKNOWLEDGMENTS
This work is supported in part by funds from the National Institutes of Health Grants 5R01GM117207-04 and 5R01GM121751-02 (D.E.C.), as well as DP2GM123486 (A.L.) and P41GM128577-01 (D.H.R.).
Footnotes
Supporting Information
The Supporting Information is available free of charge on the ACS Publications website at DOI: 10.1021/acs.analchem.9b00981.
Additional experimental data including a diagram of the vT-ESI source, additional mass spectra, IMS data used in conformer grouping analysis, and LC-MS/MS sequencing data (PDF)
The authors declare no competing financial interest.
REFERENCES
- (1).El-Baba TJ; Woodall DW; Raab SA; Fuller DR; Laganowsky A; Russell DH; Clemmer DE J. Am. Chem. Soc 2017, 139, 6306. [DOI] [PubMed] [Google Scholar]
- (2).Lumry R; Eyring H J. Phys. Chem 1954, 58, 110–120. [Google Scholar]
- (3).Bohrer BC; Merenbloom SI; Koeniger SL; Hilderbrand AE; Clemmer DE Annu. Rev. Anal. Chem 2008, 1, 293–327. [DOI] [PMC free article] [PubMed] [Google Scholar]
- (4).Stenkamp RE Handbook of Metalloproteins; John Wiley & Sons: New York, 2006. [Google Scholar]
- (5).Sheriff S; Hendrickson WA; Smith JL J. Mol. Biol 1987, 197, 273–96. [DOI] [PubMed] [Google Scholar]
- (6).Martins LJ; Hill CP; Ellis WR Biochemistry 1997, 36, 7044. [DOI] [PubMed] [Google Scholar]
- (7).Kim M-Y; Maier CS; Reed DJ; Deinzer ML Protein Sci 2002, 11, 1320–1329. [DOI] [PMC free article] [PubMed] [Google Scholar]
- (8).Sterling HJ; Williams ER J. Am. Soc. Mass Spectrom 2009, 20, 1933–1943. [DOI] [PMC free article] [PubMed] [Google Scholar]
- (9).Cong X; Liu Y; Liu W; Liang X; Russell DH; Laganowsky A J. Am. Chem. Soc 2016, 138, 4346–4349. [DOI] [PubMed] [Google Scholar]
- (10).Chowdhury SK; Katta V; Chait BT J. Am. Chem. Soc 1990, 112, 9012. [Google Scholar]
- (11).Wang G; Abzalimov RR; Kaltashov IA Anal. Chem 2011, 83, 2870–2876. [DOI] [PubMed] [Google Scholar]
- (12).Benesch JLP; Sobott F; Robinson CV Anal. Chem 2003, 75, 2208. [DOI] [PubMed] [Google Scholar]
- (13).Geels RB; Calmat S; Heck AJ; Van Der Vies SM; Heeren RM Rapid Commun. Mass Spectrom 2008, 22, 3633–3641. [DOI] [PubMed] [Google Scholar]
- (14).Kubbutat MHG; Jones SN; Vousden KH Nature 1997, 387, 299–303. [DOI] [PubMed] [Google Scholar]
- (15).Toyama BH; Savas JN; Park SK; Harris MS; Ingolia NT; Yates JR; Hetzer MW Cell 2013, 154 (5), 971–982. [DOI] [PMC free article] [PubMed] [Google Scholar]
- (16).Dobson CM Nature 2003, 426, 884. [DOI] [PubMed] [Google Scholar]
- (17).Bullock AN; Fersht AR Nat. Rev. Cancer 2001, 1, 68. [DOI] [PubMed] [Google Scholar]
- (18).Wang Z; Moult J Hum. Mutat 2001, 17, 263–270. [DOI] [PubMed] [Google Scholar]
- (19).Yue P; Li Z; Moult J J. Mol. Biol 2005, 353, 459–473. [DOI] [PubMed] [Google Scholar]
- (20).Redler RL; Das J; Diaz JR; Dokholyan NV J. Mol. Evol 2016, 82 (1), 11–16. [DOI] [PMC free article] [PubMed] [Google Scholar]
- (21).Vouret-Craviari V; Grall D; Chambard J-C; Rasmussen UB; Pouysségur J; Van Obberghen-Schilling E J. Biol. Chem 1995, 270, 8367–8372. [DOI] [PubMed] [Google Scholar]
- (22).Houde D; Peng Y; Berkowitz SA; Engen JR Mol. Cell. Proteomics 2010, 9, 1716. [DOI] [PMC free article] [PubMed] [Google Scholar]
- (23).Walsh G; Jefferis R Nat. Biotechnol 2006, 24, 1241. [DOI] [PubMed] [Google Scholar]
- (24).Haynes SE; Polasky DA; Dixit SM; Majmudar JD; Neeson K; Ruotolo BT; Martin BR Anal. Chem 2017, 89, 5669–5672. [DOI] [PMC free article] [PubMed] [Google Scholar]
- (25).Ruotolo BT; Benesch JLP; Sandercock AM; Hyung SJ; Robinson CV Nat. Protoc 2008, 3, 1139. [DOI] [PubMed] [Google Scholar]
- (26).Bush MF; Hall Z; Giles K; Hoyes J; Robinson CV; Ruotolo BT Anal. Chem 2010, 82, 9557–9565. [DOI] [PubMed] [Google Scholar]
- (27).Kaltashov IA; Mohimen A Anal. Chem 2005, 77, 5370–5379. [DOI] [PMC free article] [PubMed] [Google Scholar]
- (28).Xiong J; Phillips RS; Kurtz DM; Jin S; Ai J; Sanders-Loehr J Biochemistry 2000, 39, 8526–8536. [DOI] [PubMed] [Google Scholar]
- (29).Butler IB; Schoonen MAA; Rickard DT Talanta 1994, 41, 211–215. [DOI] [PubMed] [Google Scholar]
- (30).Kryatov SV; Rybak-Akimova EV; Schindler S Chem. Rev 2005, 105, 2175–2226. [DOI] [PubMed] [Google Scholar]
- (31).Yamazaki I; Piette LH J. Biol. Chem 1990, 265, 13589–13594. [PubMed] [Google Scholar]
- (32).Lin MT; Beal MF Nature 2006, 443, 787. [DOI] [PubMed] [Google Scholar]
- (33).Halliwell B J. Neurochem 2006, 97, 1634–1658. [DOI] [PubMed] [Google Scholar]
- (34).Davies MJ Biochim. Biophys. Acta, Proteins Proteomics 2005, 1703, 93–109. [DOI] [PubMed] [Google Scholar]
Associated Data
This section collects any data citations, data availability statements, or supplementary materials included in this article.


