

Abstract
A new method for quantifying lipid–lipid interactions within biomimetic membranes undergoing electrocompression is demonstrated by coupling droplet mechanics and membrane biophysics. The membrane properties are varied by altering the lipid packing through the introduction of cholesterol. Pendant drop tensiometry is used to measure the lipid monolayer tension at an oil–water interface. Next, two lipid-coated aqueous droplets are manipulated into contact to form a bilayer membrane at their adhered interface. The droplet geometries are captured from two angles to provide accurate measurements of both the membrane area and the contact angle between the adhered droplets. Combining the monolayer tension and contact angle measurements enables estimations of the membrane tension with respect to lipid composition. Then, the membrane is electromechanically compressed using a transmembrane voltage. Electrostatic pressure, membrane tension and the work necessary for bilayer thinning are tracked, and a model is proposed to capture the mechanics of membrane compression. The results highlight that a previously unaccounted for energetic term is produced during compression, potentially reflecting changes in the lateral membrane structure. This residual energy is eliminated in cases with cholesterol mole fractions of 0.2 and higher, suggesting that cholesterol diminishes these adjustments.
Keywords: model membranes, electrophysiology, tensiometry, droplet interface bilayers, cholesterol
1. Introduction
Cellular organisms are surrounded by semi-permeable membranes that differentiate the cytoplasm and the extracellular fluid [1], consisting primarily of a double layer of amphiphilic phospholipids. Additional biomolecules are interwoven between the lipids, including proteins and sterols. The membrane composition varies by cellular functionality, suggesting that the lipid composition is adapted based on the requirements of the cell [2,3]. Furthermore, biological membranes contain multiple lipid types with varying properties [4] which in turn influence the properties of the membrane as a whole [5,6]. One such property is the shape of the lipids produced by imbalances between the hydrophilic and hydrophobic groups [7,8]. Different lipids packed together within the membrane reach a mutually agreeable configuration where many lipids are frustrated or out of equilibrium due to their inability to achieve their desired shape [9], producing energetic penalties [10].
These lipid–lipid interactions have been proposed as mechanisms for membrane trafficking [11] and for aiding phenomena such as membrane fusion and fission processes [12,13]. Consequently, quantifying lipid–lipid interactions in membranes is crucial to better understanding cellular biophysics. Model membranes approximating cellular membranes have been created through various techniques with the purpose of studying these biological phenomena in a controlled environment, but these are often not intended for quantifying the internal lipid–lipid interactions. This shortcoming is partially addressed here by combining tensiometry and electrophysiology with the droplet interface bilayer (DIB) technique [14–16].
In the DIB technique, lipids are used as surfactants in a water-in-oil mixture, coating aqueous droplets in lipid monolayers within an oil reservoir. Lipids are dispersed in either the aqueous phase or the oil phase, and align and unfold at the water–oil interface to form the lipid monolayer. Monolayer stabilization takes several minutes dependent on the droplet volume and selected oil [17]. The lipid bilayer is formed when the lipid-coated droplets are brought into contact, expelling the residual solvent between them (figure 1a), coupling membrane mechanics and adhesive droplet mechanics. The dimensions of the bilayer are controlled by the equilibrium of tensions acting at the triple point, minimizing the total interfacial energy of the adhered droplet pair (figure 1b, equation (1.1)) and linking the tensions to the measured contact angle. These tensions are dependent on the favourability of interface formation as well as the area per surfactant molecule [18]. An advantage of DIBs is the ability to estimate the lipid bilayer membrane tension or energy per area visually from the geometry of the connected droplets when both droplets have an equal monolayer composition and volume [19,20] through:
| 1.1 |
where γb is the bilayer tension (mN m−1), γm is the monolayer surface tension (mN m−1) and θ is half the angle between the two droplets. This is a modified form of Neumann's construct for the intersection between three liquids [21,22] specifically formulated for DIBs formed from uniform droplets.
Figure 1.

The DIB technique is used to create lipid membranes. (a) DIB schematic showing the two droplets submerged in oil from two angles. Lipid monolayers are assembled at the water–oil interfaces. The lipid bilayer is formed at the interface of the two adhered droplets. (b) Sum of the surface tensions at the annulus predicts the apparent bilayer tension based on the monolayer surface tension and the contact angle. (c) The electrical model of the membrane consists of a capacitor and a resistor in parallel. (Online version in colour.)
The thermodynamic favourability of the bilayer formation is quantified by the energy of adhesion [16], which compares the bilayer tension against twice the monolayer tension (equation (1.2)). The greater the energy of adhesion, the more favourable the formation of the bilayer. The adhesion energy reflects how much energy the system conserves per unit area by forming a membrane, described by the Young–Dupre equation [23,24]:
| 1.2 |
where ε is the energy of adhesion (mN m−1). A positive adhesion energy allows for the favourable replacement of the monolayer areas of the two droplets with a single bilayer interface. Here, the adhesion energy is defined as the opposite of the free energy of interaction (ΔF), where ε = −ΔF [23].
The adhesion energy can also be defined as the integral of the disjoining pressure (Π, figure 2) over a separation distance (h) from infinity to the equilibrium thickness (heq) [23,26–28].
| 1.3 |
The disjoining pressure (Π) is the sum of multiple attractive and repulsive forces varying as a function of the distance h between the leaflets. At relatively high thicknesses, the attractive forces are dominant and drive the leaflets closer together. Once the thin film reaches an approximate thickness of approximately 5 nm [25], repulsive forces between the opposing leaflets begin to counteract the attraction until an equilibrium thickness is attained where the summed interactions in the thin film matches the Laplace pressure inside the droplets. Any additional forces that compress the bilayer below this equilibrium thickness will be further resisted through increases in the repulsive terms.
Figure 2.
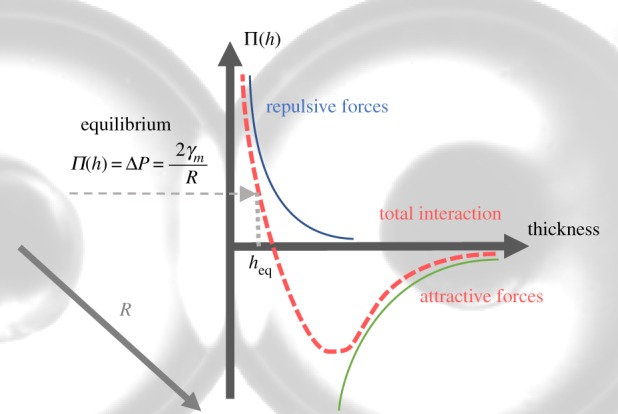
A sketch of the disjoining pressure versus the bilayer thickness. Attractive and repulsive forces act on the bilayer as a function of its thickness [25]. At a relatively high thickness, attractive forces pull the two leaflets close until repulsive terms stabilize the thin film at an equilibrium thickness. (Online version in colour.)
Combining equation (1.3) with equation (1.2) produces
| 1.4 |
which describes how the bilayer tension develops as the membrane thins from a relatively infinite separation (h = ∞) to the equilibrium thickness determined by the balance of forces between the droplet surfaces, as shown in figure 2 [28]. With droplet–droplet adhesion in DIBs, the contact angle and droplet dimensions are sufficiently large to render contributions from film thickness and monolayer line tensions negligible [26].
Based on these phenomena, measuring changes in bilayer tension (γb) caused by alterations in membrane composition provides insights on internal lipid–lipid interactions. In this work, the equilibrium monolayer tension (γm) was measured using the pendant drop approach [29], and the angle of contact between the droplets at equilibrium was used to estimate the corresponding bilayer tension (equation (1.1)). Changes in the geometry of the droplets and electrical characteristics of the membrane are translated into changes in the membrane structure, recognizing that unfavourable interactions between the lipids are manifested as increases in the measured membrane energy per area or interfacial tension.
The impact of cholesterol on DPhPC (1,2-diphytanoyl-sn-glycero-3-phosphocholine) membranes undergoing electrocompression is investigated here. When cholesterol-laden lipid vesicles are introduced to a polar–apolar interface, cholesterol is dispersed between the phospholipids at the interface but struggles to limit unfavourable water–hydrophobic interactions. Mixtures of phospholipids and cholesterols adjust in a manner that minimizes these unfavourable interactions (figure 3c). Cholesterol molecules insert between the phospholipids, leading to a more condensed monolayer by limiting the motions of the phospholipids' hydrophobic acyl chains, influencing the membrane structure [30]. This is expected to produce energetic penalties associated with the frustration of the desired lateral spread of the lipids which will cause changes in the interfacial tension or energy per area of the interface. Changes in the interfacial energetics and response to compression will be tracked as a function of the membrane composition.
Figure 3.

(a) Illustrative comparison of phospholipid and cholesterol molecules. Cholesterol molecules possess a small hydrophilic region compared to their large hydrophobic region. (b) At the water–oil interface phospholipids assemble and form the monolayer with minimal complications or distortion. (c) Cholesterol incorporated into the monolayer causes deformation of the surrounding lipids and produces energetic penalties which manifests as changes in the surface tension or energy per area. (Online version in colour.)
DPhPC is a synthetic phospholipid that is often used for DIBs [17,31]. DPhPC does not exhibit a phase transition from −120°C to 120°C [32], rendering the lipids temperature-invariant and its low spontaneous curvature provides a stable planar membrane [13]. In contrast to DPhPC, cholesterol does not self-assemble into vesicles or sheets when dispersed in an aqueous solution, preferring crystallization [4]. This is because cholesterol possesses a very low hydrophilic/hydrophobic ratio as depicted in figure 3a, producing a cone-shaped structure.
DPhPC is not ideal for recreating and studying the influence of cholesterol on mammalian cell membranes since it is derived from archaeal organisms which rarely encounter cholesterol. However it is selected in this work due to its high mechanical and chemical stability [33], the abundance of available data on baseline tensions and specific capacitances for DPhPC DIB membranes for calibration of the developed approach [19,20], and the ability to readily form DIB membranes with minimal complications relative to unsaturated lipids such as 1,2-dioleoyl-sn-glycero-3-phosphocholine (DOPC) and 1-palmitoyl-2-oleoyl-glycero-3-phosphocholine (POPC) [34]. The findings are presented here as demonstration of the developed technique rather than investigating the role of cholesterol in mammalian cell membranes.
This research is enabled by simultaneously measuring the membrane area (Am) and contact angle (θ) between the droplets. While precise measurements of membrane area have been achieved using a droplet hydrogel bilayer (DHB) [19] and precise measurements of the contact angle have been achieved using traditional DIBs [20], calibration factors or assumptions on the geometry were employed in both approaches to account for gravitational influences when estimating the other value. Here, a dual-view approach is used to provide simultaneous characterization of membrane area and contact angle without requiring additional assumptions allowing for greater clarity. This clarity allows for a thorough investigation of the membrane properties, uncovering additional phenomena present during membrane electrocompression.
2. Material and methods
2.1. Solution preparations
Lipid-in solutions were used in all the described experiments, where lipids are dispersed in the aqueous phases [17]. Buffer solutions (500 mM potassium chloride (KCl, ≥99.1%—Sigma-Aldrich), 10 mM of 3-(N-Morpholino) propane sulfonic acid (MOPS, ≥99.5%—Sigma-Aldrich), Sigma Aldrich) were prepared and then mixed with DPhPC (Avanti Polar Lipids) and cholesterol (ovine wool, greater than 98%—Avanti Polar Lipids) as described in electronic supplementary material, S1. Solutions were prepared with 0, 10, 20 and 30% mole fraction cholesterol in DPhPC. The maximum cholesterol mole fraction used in this work was 30%, ensuring cholesterol solubility with phospholipids and avoiding cholesterol precipitation [35,36]. Hexadecane (99%—Sigma-Aldrich) was used for the oil phase, as it has shown to enable the formation of relatively solvent-free model membranes in comparison to shorter-chain alkanes, such as decane [19,37].
2.2. Monolayer surface tension measurements
Monolayer surface tensions were measured using the pendant drop technique [29]. An aqueous droplet is suspended from a needle inside a glass cuvette containing hexadecane. Once the droplet is introduced to the oil reservoir, lipid molecules migrate towards the water–oil interface forming the monolayer and decreasing the surface tension. The droplet gradually sags from a spherical shape to a pendant shape and the monolayer tension can then be estimated (figure 4). The process is recorded using a zoom lens camera (6.5× zoom lenses with a 0.7–4.5× magnification range, Thorlabs). Droplet images are used to calculate the interfacial tension using the open-source tensiometry software OpenDrop [29]. The capability to vary the needle dimensions and magnification allows for the assessment of low surface tension cases which otherwise would be problematic. After the lipid monolayer is established the tension reaches a steady-state value and minimal drift is observed as shown in figure 4. Additional experimental details may be found in electronic supplementary material, S2.
Figure 4.
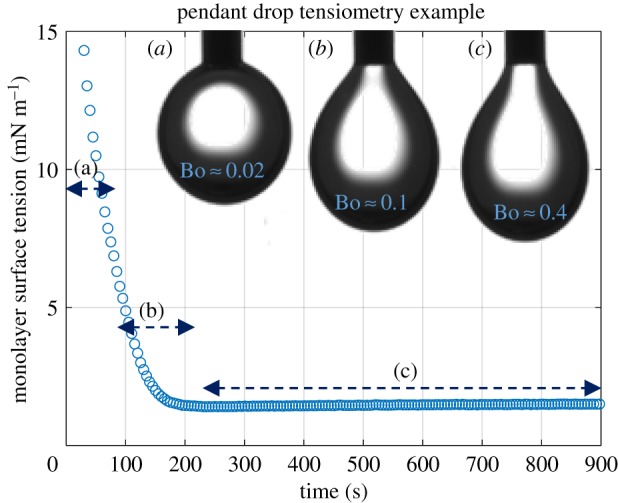
The pendant drop technique was used to measure the monolayer surface tension. (a) Initially, surface tension is dominant, leading to a sphere-shaped droplet. (b) As lipids begin coating the interface, the surface tension is reduced and gravitational effects become more significant. (c) After a few minutes, equilibrium is reached where surface tension and gravitational forces are in balance. (Online version in colour.)
2.3. Droplet interface bilayer creation and characterization
Figure 5 describes the set-up used for the experiments, intended for the accurate characterization of DIBs with simultaneous measurements of membrane area (Am) and contact angle (θ). Aqueous droplets are injected onto two silver/silver-chloride (Ag/AgCl) electrodes, which are submerged in an acrylic glass cube (1 cm × 1 cm base, 1 mm thick walls) filled with hexadecane. The tips of the Ag/AgCl electrodes are coated with agarose gel (low EEO, Sigma-Aldrich Co.) to aid in droplet adhesion. The electrodes are connected back to an Axopatch 200B patch-clamp amplifier and a Digidata 1440 data acquisition system (Molecular Devices). A prescribed voltage is maintained between the electrodes, and the current necessary to maintain this voltage is recorded. Voltage-clamp mode (whole cell β = 1) was used at a 5 kHz sampling frequency with a low pass filter of 1 kHz (using the embedded low-pass Bessel filter −80 dB/decade). Prior to each experiment, the pipette offset was compensated by coalescing the droplets and adjusting the offset to V = 0 in current-clamp mode. Residual electrode capacitance was eliminated using the patch clamp amplifier's built-in whole-cell capacitance compensation prior to membrane formation.
Figure 5.

Experimental set-up used for the creation and characterization of DIBs. The droplets are submerged in an acrylic glass dish with hexadecane and connected to electrophysiology equipment. An inverted microscope and a zoom lens camera are used to enable simultaneous measurements of the bilayer area and contact angle. (Online version in colour.)
The lipid membrane may be approximated as a capacitor and a resistor in parallel [38] (figure 1c). Consequently, the recorded current may be split into a capacitive and a resistive current (equation (2.1))
| 2.1 |
where Cm and Rm are the membrane's capacitance and resistance, respectively. i and V are the measured current and prescribed voltage, respectively. A 40 Hz, 10 mV sinusoidal voltage signal was typically used to avoid complications at higher frequencies due to the resistance of the electrode–electrolyte interface and provide a frequency-independent capacitance [28,38] while generating sufficient current for precise measurements. At these frequencies, the voltage drop falls primarily across the membrane itself and the measured current will be primarily capacitive due to the high resistance of the DPhPC membranes [38]. Any residual conductive currents across the membrane may be eliminated by fitting the measured current and prescribed voltage to equation (2.1) through nonlinear regression, isolating the capacitive current.
A key advantage of this approach is the ability to simultaneously measure the area of the adhered bilayer and contact angle. Gravitational forces and the adhesion of the droplet on the electrode surface distort the droplet, creating elliptical rather than circular membranes. The droplet shape depends on a variety of factors such as the density of the oil, type of lipids used, diameter of the electrodes, volume of the droplets and qualities of the hydrogel on the electrode. Consequently, it is difficult to estimate the correction factors necessary to account for the membrane ellipticity. The additional side camera addresses this limitation by capturing the droplet contours. When combined with the inverted microscope, both principal axes of the elliptical membrane area are available. The ratio of the major radius to the minor radius depends on the size of the droplets, electrode properties and oil density as noted in electronic supplementary material, S5.
2.4. Data analysis
The lipid membrane may be approximated as a parallel plate capacitor. Thus, the bilayer's thickness estimated in this study reflects the dielectric thickness or the distance between the two aqueous charged surfaces. In the case of a DIB, the dielectric thickness is the region occupied by lipid acyl chains and any residual oil solvent. The membrane capacitance is given by
| 2.2 |
where Cm is the total membrane capacitance, Am is the membrane area, a and b are the principal radii of the membrane (figure 6b), Cs is the membrane specific capacitance or capacitance per area, ε0 is the vacuum permittivity (F/m) and εr is the relative permittivity of the hydrocarbon chains, assumed to be equal to 2.2 [20]. The total capacitance Cm reflects the specific capacitance Cs multiplied by the membrane area Am. The total capacitance is obtained by sending a sinusoidal voltage (amplitude: 10 mV; frequency: 40 Hz) across the membrane and recording the current output as shown in figure 6a. These two recordings are then imported into MATLAB code that separates the capacitive and conductive currents using curve fitting and equation (2.1). Owing to the gravitational influences on the droplet shape, both bottom view and side view images are needed to measure the membrane area as shown in figure 6b. Images from the inverted microscope were imported into MATLAB and the imfindcircles() command was used to locate the centre of each droplet as well as their radii. The distance between the centre of the droplets and their dimensions are used to identify the two overlapping points defining the membrane minor axis and the calculated outlines are exported to the original image to check for consistency. If the droplets are not sufficiently circular, then some interference due to electrode positioning is assumed and the experiment is repeated.
Figure 6.

The sinusoidal voltage applied across the bilayer (amplitude: 10 mV; frequency: 40 Hz) along with the output current (pA) enable the calculation of the total capacitance. (b) Both bottom and side views of the DIB are necessary to obtain the area, which is calculated as the area of an ellipse with the major and minor radii as the side and bottom radii, respectively. The contact angle is captured by a customized Matlab code. (c) Membrane's specific capacitance is the slope of capacitance versus area, which was controlled manually by micromanipulators. (Online version in colour.)
The contact angle between droplets is then calculated from the measured dimensions as shown in figure 6b1. The intersection of the two circles denotes the point of tangency for defining the contact angle. The contact angle was then used to visually estimate the bilayer tension as a function of the monolayer tension using equation (1.1). The contact angle at the liquid–liquid–liquid intersection obeys Neumann's construct and, assuming that the monolayer and bilayer tensions are constant with respect to location within their respective interface, it may be assumed that the contact angle is uniform around the perimeter of the membrane. Determining a tangential point on the droplet contour using the side view images leads to complications, consequently, only the view of the droplets from the bottom wherein the droplets assume a circular profile is used to estimate θ [21,22].
Images from the second camera were also imported into Matlab and the locations of the two intersections are identified at the highest and lowest point of the membrane as shown in figure 6b2, and the distance between them was calculated. This measurement was combined with the measurement for membrane dimensions from the previous step. The membrane's surface area was calculated as the area of an ellipse Am = πab, where the minor (a) and major (b) radii are the bottom and side radii, respectively.
Membrane capacitance Cm and area Am are needed to calculate the specific capacitance Cs of the membrane (). For the specific capacitance measurements, the droplets were gradually pulled apart using micromanipulators to vary the membrane area. The measured capacitance at each step was plotted versus the corresponding area and the data points were fitted using a first-order linear regression setting the intercept to zero where the resulting slope denotes the membrane's specific capacitance [20] (figure 6). The membrane's dielectric thickness (in ångströms) was calculated next using equation (2.2). The dimensions of the inverted view were obtained manually for these measurements rather than in Matlab, since the separation of the droplets led to non-circular projections. Ellipticity values may be found in electronic supplementary material, S5.
3. Results and discussion
Table 1 reports the averages and standard deviations of all variables for lipid monolayers and bilayers assembled with varying cholesterol concentrations. The values for the specific capacitance (Cs), monolayer tension (γm) and contact angle (θ) were directly measured and the standard deviations and sample sizes are reported in the table. Dielectric thickness (h), bilayer tension (γb) and adhesion energy (ε) were then calculated from these average values, and uncertainty was determined using error propagation equations. The methodology is then assessed by comparing the measured values against known values in the literature. Measurements for the specific capacitance and thickness of DPhPC without cholesterol in hexadecane match those of the membrane area using the DHB technique [19], and the monolayer and bilayer tensions of DPhPC without cholesterol in hexadecane are within the standard deviation of previously reported values in the literature [20,39].
Table 1.
Results showing the influence of cholesterol on the monolayer surface as well as on the droplet interface bilayer.
| cholesterol mole fraction | 0 | 0.1 | 0.2 | 0.3 |
|---|---|---|---|---|
| 0.62 (±0.01) N = 5 | 0.63 (±0.01) N = 6 | 0.63 (±0.02) N = 5 | 0.63 (±0.01) N = 5 | |
| h (Å) | 31.5 (±0.3) | 30.8 (±0.4) | 30.9 (±0.7) | 31.1 (±0.5) |
| (mN m−1) | 1.14 (±0.04) N = 10 | 1.17 (±0.07) N = 5 | 1.30 (±0.04) N = 7 | 1.43 (±0.05) N = 11 |
| 2θ (°) | 48.8 (±4.8) N = 12 | 49.0 (±3.2) N = 17 | 52.4 (±2.0) N = 12 | 47.4 (±2.1) N = 11 |
| (mN m−1) | 2.07 (±0.12) | 2.13 (±0.16) | 2.33 (±0.10) | 2.61 (±0.14) |
| ε (mN m−1) | 0.20 (±0.15) | 0.21 (±0.21) | 0.27 (±0.13) | 0.24 (±0.18) |
3.1. Influence of cholesterol on the bilayer and monolayer tensions
The monolayer tension of the water–hexadecane interface increases with the incorporation of cholesterol as measured using pendant drop tensiometry (table 1). Monolayer surface tension ranges from 1.14 mN m−1 (±0.04 mN m−1) with no cholesterol included to 1.43 mN m−1 (±0.05 mN m−1) for 30% cholesterol mole fraction (detailed results in electronic supplementary material, S2). Cholesterol disrupts the monolayer structure due to its higher negative curvature relative to DPhPC, increasing the surface tension. This increase generates a similar increase in the bilayer's tension as measured by the DIB contact angle and monolayer tension from equation (1.1). Cholesterol-free lipid bilayers exhibit a surface tension of 2.07 mN m−1 (±0.12 mN m−1), whereas the addition of 30% cholesterol increases the tension to 2.61 mN m−1 (±0.14 mN m−1), reflecting the unfavourable lipid–lipid interactions between cholesterol and DPhPC. This increase matches reported trends in the literature [40]. The contact angle does not show significant variation with respect to cholesterol concentrations, and little can be said about the changes in the energy of adhesion as the calculated error intervals are considerable.
3.2. Influence of cholesterol on the bilayer's dielectric thickness
Table 1 also presents the specific capacitance, and subsequently thickness, of DIBs for the different lipid concentrations. Cholesterol-free DIBs show a specific capacitance of 0.62 µF cm−2 (±0.01 µF cm−2). The addition of 10, 20 or 30% cholesterol increases the specific capacitance to an average value of 0.63 µF cm−2 (±0.012 µF cm−2). Subsequently, the membrane's thickness shows a slight change from 31.5 Å (±0.3 Å) with no cholesterol incorporation to 30.9 Å (±0.6 Å) as an average for all cholesterol concentrations (detailed experimental results in electronic supplementary material, S4). Cholesterol may slightly reduce the membrane's dielectric thickness, but a conclusion cannot be definitively stated as the change is minor and the error intervals overlap.
3.3. Droplet interface bilayer response to applied voltage
The membrane behaves as an elastic capacitor, thinning in response to electrostatic stresses [41,42]. The applied voltage generates a compressive stress across the membrane as a function of the applied voltage V.
| 3.1 |
This also produces a reduction in the apparent bilayer tension through electrical energy [4,43].
| 3.2 |
This reduction in apparent surface tension of the adhered interface produces electrowetting [21], where the incorporation of additional membrane area becomes more energetically favourable [19,20]. As a result, the membrane simultaneously thins and expands when a voltage is applied across the membrane. It is important to note that the majority of the expansion is primarily due to the incorporation of additional lipids within the membrane rather than lipid lateral distortion associated with membrane elasticity, as the membrane area increases substantially. The changes in the bilayer's specific capacitance Cs and total capacitance Cm are approximately quadratic with respect to the applied voltage. The symmetry of the bilayer centres the parabola at V = 0 mV, meaning that the membrane's lowest specific capacitance—i.e. highest thickness—is obtained at 0 mV. Thus, the changes can be fit into a parabolic equation of the form [19,20,44,45]
| 3.3 |
where β is the electro-thinning coefficient. These behaviours may be seen in figure 7.
Figure 7.

(a) The application of a DC voltage increases bilayer area and contact angle while electrocompression leads to bilayer thinning, i.e. increase in specific capacitance. The increase in (b) total capacitance, (c) membrane area and (d) specific capacitance is quadratic with the voltage. Figures and data are taken from a DPhPC DIB in hexadecane. (Online version in colour.)
Measuring the changes in the membrane thickness under electrocompression provides information on the disjoining pressure and membrane mechanics (figure 2). It has been observed that the thickness properties and behaviour depend considerably on the oil medium [19,20,37,46]. As an example, figure 8 shows the changes in specific capacitance of three separate DIBs—submerged in three different oils—with respect to an increasing DC voltage.
Figure 8.

Changes in the membrane's specific capacitance (µF cm−2) with respect to the applied voltage (V) for different oils. β is the electro-thinning coefficient as the data for each experiment were fit into a parabolic curve (equation (3.3)). (Online version in colour.)
Figure 8 shows that decane oil—C10H22–displays the smallest initial specific capacitance (0.26 µF cm−2) and the highest β coefficient (25.58/V2). This change in thickness is a function of the expulsion of residual oil within the membrane rather than lipid compression. As the carbon chain of the oil used increases in length, the amount of residual oil is reduced. In fact, hexadecane oil—C16H34—demonstrates the highest initial specific capacitance (0.63 µF cm−2) and the smallest electro-thinning coefficient of 1.75/V2. Tetradecane—C14H30—values fall in between those of decane and hexadecane, further confirming this dependency. This trend is dependent on the length of the alkane chain [19,37,46]. Hexadecane possesses a similar chain length as the selected lipid (DPhPC) in this study, and should not produce membranes with excess residual solvent. This hypothesis was recently tested by Tarun et al. [37], examining the properties of lipid bilayer membranes with hexadecane, heptadecane and squalene. They note that while heptadecane produces the thinnest membranes, hexadecane is an acceptable alternative as long as sufficient time is provided for membrane equilibration. Heptadecane requires elevated temperatures as its melting point is just above room temperature (Tm = 23°C). Consequently, hexadecane is selected for all remaining studies on membrane compression to minimize the influence of the solvent. However, it is important to note that the membrane still exhibits excessive compression when compared to ‘dry’ or truly solvent-free membranes [19] which indicates some solvent still resides within the membrane even when hexadecane is used.
3.4. Influence of cholesterol on membrane properties
Next, the effect of cholesterol on the structure and mechanics of a DPhPC membrane is investigated using electrical fields producing electrowetting and electrocompression. Electrowetting is the apparent reduction in surface tension upon the application of an electric field causing an expansion of the membrane interface [47] as shown in figure 9c(ii), and equation (3.2). Electrocompression occurs as well, where the bilayer thickness is compressed by electrostatic forces (equation (3.1)) as shown in figure 9c(iii). These two phenomena—formation of new membrane area and reduction in membrane thickness—combine to significantly increase the total capacitance as shown in figure 9c(i) and described in equation (2.2).
Figure 9.

(a) The bilayer area expands as the DC voltage increases. (b) The voltage is increased until the membrane failure (droplet coalescence). (c) Total capacitance, membrane area, and the specific capacitance exhibit a linear increase with respect to V2. (d) The dielectric stress versus bilayer thickness represents resistance to thinning. The data shown here are averaged from four separate experiments for each membrane composition. Twenty per cent cholesterol is not included due to excessive leak currents observed for this particular membrane composition. (Online version in colour.)
DC voltage increments of 10 mV are applied until membrane failure (≈330 mV) as shown in figure 9b, holding the voltage for 60 s at each increment. The membrane's specific capacitance (equation (2.2)) is obtained from the recorded membrane capacitance and area at each voltage, enabling the calculation of the dielectric stress applied on the leaflets σelec (equation (3.1)) and the corresponding bilayer dielectric thickness h, figure 9a,b. As the voltage increases, pores form as measured by increasing the membrane conductance, beginning around 200 mV (figure 9b). This is repeated for each cholesterol–lipid mixture.
Plots of the dielectric stress (kPa) versus membrane thickness (ångströms) are shown in figure 9d. The critical stress at failure does not significantly vary between cholesterol-free and cholesterol-embedded bilayers. The average maximum stress in the three cases is found to be roughly equivalent at approximately 100 ± 15 kPa. However it should be noted that the maximum voltage reached prior to membrane rupture does increase with cholesterol due to the changes in membrane thickness (equation (3.1), figure 9d), agreeing with previous research on the influence of cholesterol on electroporation [48].
For 0% cholesterol, a reduction in the membrane dielectric thickness of almost 2 Å is achieved before failure, while this compression reduces to 0.6 Å with the incorporation of 30% cholesterol. Twenty per cent cholesterol produces membranes with significant ion leakage or conductivity which compromises the recordings at higher voltages. As discussed in the introduction, cholesterol's primary influence on lipid bilayers is through condensing and ordering the membrane, even as the overall tension is increased. Cholesterol restricts the movement of phospholipids, leading to a more rigid, well-packed, bilayer structure. Thus, cholesterol-embedded bilayers show a significant decrease in electrocompression. This decrease is likely due to a combination of reduced residual solvent within the membrane and enhanced rigidity offered by the cholesterol.
3.5. Influence of cholesterol on membrane tension during electrocompression
The application of an electrical field across the DIB compresses the leaflets [19,20,45]. This reduction in thickness leads to subsequent increases in the disjoining pressure (figure 2), which is directly linked to the bilayer tension (equation (1.4)). Therefore, the change in bilayer tension when a voltage is applied assuming invariant monolayer tension may be described as:
| 3.4 |
where the subscript 0 is without the voltage and the subscript V is with the applied voltage. At equilibrium, the disjoining pressure will match the pressure applied at the membrane surface from within the droplets. This may be approximated as a combination of the pressure from the electric field (equation (3.1)) and the Laplace pressure [49]:
| 3.5 |
The electric field across the monolayer is negligible and the monolayer tension at equilibrium may be considered invariant with respect to the applied voltage. Therefore, the apparent change in bilayer tension may be estimated visually using the contact angle between the droplets (equation (1.1)). This apparent change in bilayer tension includes reductions from the electrical energy (equation (3.2)) and increases from the strain energy (equation (3.4) combined with equation (3.5)). From experimental observations, the apparent reduction in membrane tension is typically less than the estimated reduction provided by combination of the electric field and strain energy, suggesting that an additional energetic penalty associated with the compression is present. A residual term Eresidual is proposed to reflect changes in the leaflet lateral structure not captured by the integration of the disjoining pressure or electric field. All of these terms aside from Eresidual are available from the previously described experimental approach, resulting in equation (3.6):
| 3.6 |
where the visually estimated reduction in membrane tension (Δγb,app) is on the left-hand side and proposed mechanisms responsible for this apparent change are on the right-hand side, including the electrical energy (Δγb,elec) and change in tension from equations ((3.4) and (3.5)) (Δγb,mech). If the final two terms on the right-hand side are omitted, this produces the classic Young–Lippmann equation adjusted for DIBs [19,20]. Equation (3.6) effectively compares the visually reported membrane tension against approximations for each term responsible for the change, with the final term Eresidual providing a ‘catch-all’ for any unconsidered variables in the model.
Here, the radius of the droplets is assumed to remain constant as the membrane forms new area since these reductions in the Laplace pressure will have minimal influence. The strain energy is integrated numerically from the recorded membrane thickness with the increasing voltage similarly to figure 9d.
A DC voltage ranging from 0 to 160 mV with 40 mV steps held at 60 s intervals is applied. At each voltage, the membrane area, capacitance and contact angle are obtained. These values are combined with the monolayer tensions recorded in table 1 and the residual energy in equation (3.6) is estimated from these recordings. Values for the first three terms in equation (3.6) at 160 mV are presented in figure 10 with an increasing cholesterol concentration. Membranes without cholesterol exhibit a notable deviation from the visually indicated change in tension and the measured reduction in membrane tension due to electrical energy, producing an energetic penalty that is not captured by the Lippmann–Young equations.
Figure 10.
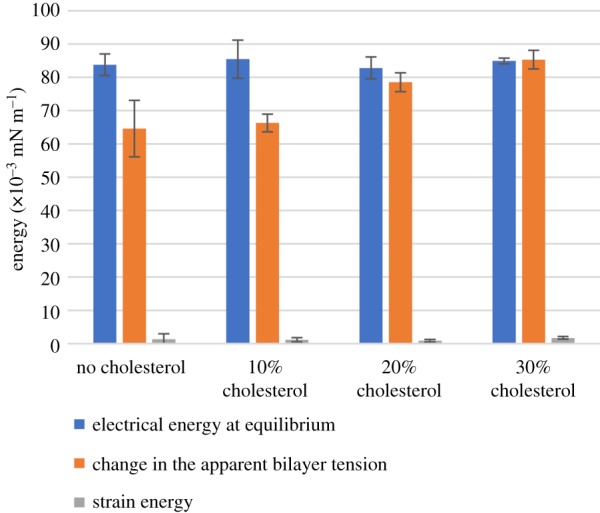
Electrical energy, change in apparent bilayer tension and strain energy for different cholesterol–DPhPC mole fractions. Each value is the average of five experiments. These values are all taken at ±160 mV DC voltage applied. (Online version in colour.)
As the cholesterol within the membrane increases this residual energy becomes negligible. Figure 11 shows this residual term for each case plotted as a function of the dielectric stress. Membranes formed with less than or equal to 10% mole fraction cholesterol exhibit an increase in the residual energy during electrocompression. Membranes formed with greater than or equal to 20% mole fraction cholesterol do not exhibit a similar increase. These changes in the residual energy reflect an increase in the base bilayer tension under compression.
Figure 11.

The residual energy in equation (3.4) is plotted for different cholesterol concentrations as a function of the pressure induced by the electric field. Zero per cent and 10% cholesterol exhibit an additional energetics term that is not accounted for in the original equation. Twenty per cent and 30% cholesterol minimize the residual energy contribution. (Online version in colour.)
Since the proposed model for membrane compression (equation (3.6)) does not include lateral changes in the membrane properties, it is hypothesized that the electrocompression leads to distortion of the lipids within the membrane. The presence of cholesterol limits these lateral rearrangements as shown in figure 9d. Complete membrane incompressibility cannot be assumed in DIBs due to the presence of residual oil [19,37,46], but some coupling of the lateral and transverse deformation is to be expected in the ‘solvent-free’ cases such as hexadecane. When the leaflets are compressed transversely, the rigid structure of the cholesterol–DPhPC membrane resists deformation in both the transverse and lateral directions, leading to a relatively constant area per lipid during electrocompression. These mechanics are detected using the DIB approach and demonstrate the capability to measure changes in the interfacial energetics of the membrane under loading. The authors suggest that this is the primary mechanism responsible for the results; however there are likely multiple contributing factors present including changes in mechanical properties with cholesterol [50], out-of-plane undulations that are invisible with brightfield microscopy [51], and the reduction of residual solvent.
3.6. Sensitivity analysis
The sensitivity of Eresidual with respect to errors in measurements of the primary variables must be examined. These primary variables include the membrane area (Am), contact angle (θ), and monolayer tension (γm). The traditional Berge–Lippmann–Young predictions were compared to the experimental data and these parameters were varied until a fit was achieved. This removes the second two terms from the right-hand side of equation (3.6), directly comparing the electrical energy and visual change in bilayer tension. An adjustment ratio, Κadj, is defined for each of these variables, where in the case of membrane area and monolayer tension, Κadj = XBLY/XExp. XBLY is the theoretical value calculated assuming zero residual energy and XExp is the experimentally measured value assumed to be incorrect. As for the contact angle Κadj is defined as θBLY = θExp + Κadj. Figure 12 shows the Κadj values with varying cholesterol mole fractions.
Figure 12.
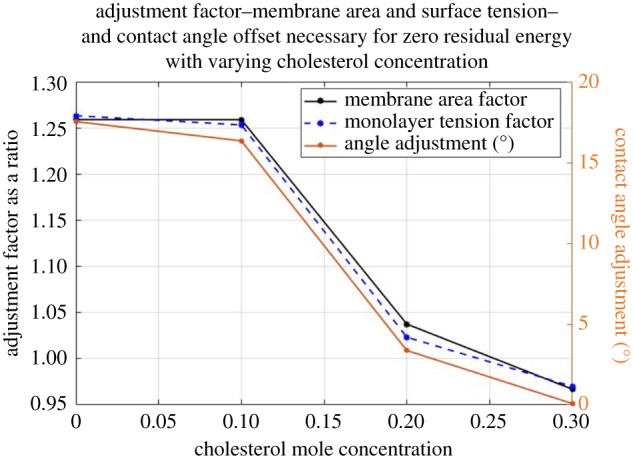
Assuming zero residual energy, an adjustment ratio for the membrane area and the monolayer tension was obtained for each cholesterol concentration and plotted on the left y-axis. A contact angle adjustment value (2* Κadj, in degrees) is shown on the right y-axis. (Online version in colour.)
Based on the results shown in figure 12, the authors note that a 1.25 adjustment factor to the membrane area, a 1.26 adjustment to the monolayer tension, and 17° to the contact angle are necessary to eliminate Eresidual in the cases of less than or equal to 10% cholesterol. The recorded membrane specific capacitance Cs (required accurate area and capacitance measurements) monolayer tension γm (requires accurate pendant drop measurements), and bilayer tension γb (requires accurate measurements of the angle of contact) are all within the accepted ranges in comparison to the literature for DPhPC in hexadecane [19,20]. Furthermore, the same experimental protocols and methodologies were followed for each membrane composition. The authors conclude that Eresidual likely represents a physical phenomenon associated with membrane electrocompression producing changes in the membrane structure. While unforeseen experimental errors or complications may be partially responsible for some portion of this value, it is unlikely to comprise the whole.
4. Conclusion
A new approach for investigating membrane energetics under electrocompression is proposed. The DIB technique was used as a platform for creating model membranes or lipid bilayers. The unique nature of the DIB approach allows for measuring changes in the interfacial properties by combining droplet and membrane mechanics. Two cameras were implemented to simultaneously track the membrane area (Am) and contact angle (θ), enhancing the precision of the measurements. Membrane behaviour with and without cholesterol were compared to study the influence of lipid frustration on membrane properties. Pendant drop monolayer tension measurements were used to provide estimations for bilayer tension through the angle between the droplets, and changes in the contact angle were recorded with an increasing voltage across the membrane. Changes in the apparent bilayer tension were compared to a model including contributions from the electrical energy and strain energy with electrocompression. Bilayers without cholesterol generated an unaccounted for residual energy when undergoing electrocompression, suggesting the potential for lateral rearrangements of lipids as further evidenced by measurements of membrane thickness versus pressure. Cholesterol enhances the rigidity of the membrane by interdigitating within the lipids and restricts the lipid movement during loading, and the membrane lateral structure remains relatively unperturbed during electrocompression.
Supplementary Material
Data accessibility
Key experimental data and protocols are all provided in the figures and tables within the manuscript and electronic supplementary material. Original images and axon binary files used to produce these figures are available from the authors on request.
Authors' contributions
J.B. carried out the experimental work, participated in data analysis, participated in the design of the study and drafted the manuscript. M.M., G.T. and S.S. participated in the design of the study and data analysis and critically revised the manuscript. E.F. conceived of the study, coordinated the study, participated in data analysis and design of the study and helped draft the manuscript. All authors gave final approval for publication and agree to be held accountable for the work performed therein.
Competing interests
We declare we have no competing interests.
Funding
The authors gratefully acknowledge support from the National Science Foundation (NSF) under grant no. 1537410.
References
- 1.Lodish H, Berk A. 2007. Molecular cell biology. Vol. 3.
- 2.Fridriksson EK, Shipkova PA, Sheets ED, Holowka D, Baird B, Mclafferty FW. 1999. Quantitative analysis of phospholipids in functionally important membrane domains from RBL-2H3 mast cells using tandem high-resolution mass spectrometry. Biochemistry 38, 8056–8063. ( 10.1021/bi9828324) [DOI] [PubMed] [Google Scholar]
- 3.Pike LJ, Han X, Chung K-N, Gross RW. 2002. Lipid rafts are enriched in arachidonic acid and plasmenylethanolamine and their composition is independent of caveolin-1 expression: a quantitative electrospray ionization/mass spectrometric analysis. Biochemistry 41, 2075–2088. ( 10.1021/bi0156557) [DOI] [PubMed] [Google Scholar]
- 4.Heimburg T. 2008. Thermal biophysics of membranes. Weinheim, Germany: John Wiley & Sons. [Google Scholar]
- 5.Evans E, Needham D. 1987. Physical properties of surfactant bilayer membranes: thermal transitions, elasticity, rigidity, cohesion and colloidal interactions. J. Phys. Chem. 91, 4219–4228. ( 10.1021/j100300a003) [DOI] [Google Scholar]
- 6.Needham D. 1995. Cohesion and permeability of lipid bilayer vesicles. In Permeability and stability of lipid bilayers, pp. 49–76. Boca Raton, FL: CRC Press. [Google Scholar]
- 7.Marsh D. 2007. Lateral pressure profile, spontaneous curvature frustration, and the incorporation and conformation of proteins in membranes. Biophys. J. 93, 3884–99. ( 10.1529/biophysj.107.107938) [DOI] [PMC free article] [PubMed] [Google Scholar]
- 8.Cullis PR, Hope MJ, Tilcock CP. 1986. Lipid polymorphism and the roles of lipids in membranes. Chem. Phys. Lipids 40, 127–44. ( 10.1016/0009-3084(86)90067-8) [DOI] [PubMed] [Google Scholar]
- 9.Sadoc J, Charvolin J. 1986. Frustration in bilayers and topologies of liquid crystals of amphiphilic molecules. J. Phys. 47, 683–91. ( 10.1051/jphys:01986004704068300) [DOI] [Google Scholar]
- 10.Nielsen C, Andersen OS. 2000. Inclusion-induced bilayer deformations: effects of monolayer equilibrium curvature. Biophys. J. 79, 2583–604. ( 10.1016/S0006-3495(00)76498-8) [DOI] [PMC free article] [PubMed] [Google Scholar]
- 11.Chorlay A, et al. 2019. Membrane asymmetry imposes directionality on lipid droplet emergence from the ER. Dev. Cell. 50, 25–42. [DOI] [PubMed] [Google Scholar]
- 12.Kawamoto S, Klein ML, Shinoda W. 2015. Coarse-grained molecular dynamics study of membrane fusion: curvature effects on free energy barriers along the stalk mechanism. J. Chem. Phys. 143, 243112 ( 10.1063/1.4933087) [DOI] [PubMed] [Google Scholar]
- 13.Kollmitzer B, Heftberger P, Rappolt M, Pabst G. 2013. Monolayer spontaneous curvature of raft-forming membrane lipids. Soft Matter 9, 10 877–10 884. ( 10.1039/c3sm51829a) [DOI] [PMC free article] [PubMed] [Google Scholar]
- 14.Bayley H, Cronin B, Heron A, Holden MA, Hwang WL, Syeda R, Thompson J, Wallace M. 2008. Droplet interface bilayers. Mol. Biosyst. 4, 1191–1208. ( 10.1039/b808893d) [DOI] [PMC free article] [PubMed] [Google Scholar]
- 15.Funakoshi K, Suzuki H, Takeuchi S. 2006. Lipid bilayer formation by contacting monolayers in a microfluidic device for membrane protein analysis. Anal. Chem. 78, 8169–8174. ( 10.1021/ac0613479) [DOI] [PubMed] [Google Scholar]
- 16.Poulin P, Bibette J. 1998. Adhesion of water droplets in organic solvent. Langmuir 14, 6341–6343. ( 10.1021/la9801413) [DOI] [Google Scholar]
- 17.Venkatesan GA, Lee J, Farimani AB, Heiranian M, Collier CP, Aluru NR, Sarles SA. 2015. Adsorption kinetics dictate monolayer self-assembly for both lipid-in and lipid-out approaches to droplet interface bilayer formation. Langmuir 31, 12 883–12 893. ( 10.1021/acs.langmuir.5b02293) [DOI] [PubMed] [Google Scholar]
- 18.Chen Y, Helm C, Israelachvili J. 1991. Molecular mechanisms associated with adhesion and contact angle hysteresis of monolayer surfaces. J. Phys. Chem. 95, 10 736–10 747. ( 10.1021/j100179a041) [DOI] [Google Scholar]
- 19.Gross LC, Heron AJ, Baca SC, Wallace MI. 2011. Determining membrane capacitance by dynamic control of droplet interface bilayer area. Langmuir 27, 14 335–14 342. ( 10.1021/la203081v) [DOI] [PubMed] [Google Scholar]
- 20.Taylor GJ, et al. 2015. Direct in situ measurement of specific capacitance, monolayer tension, and bilayer tension in a droplet interface bilayer. Soft Matter 11, 7592–7605. ( 10.1039/C5SM01005E) [DOI] [PubMed] [Google Scholar]
- 21.Berthier J, Brakke K. 2012. The physics of microdrops, vol. 10 Beverly, MA: Scrivener-Wiley Publishing. [Google Scholar]
- 22.Style RW, Dufresne ER. 2012. Static wetting on deformable substrates, from liquids to soft solids. Soft Matter 8, 7177–7184. ( 10.1039/c2sm25540e) [DOI] [Google Scholar]
- 23.Leal-Calderon F, Schmitt V, Bibette J. 2007. Emulsion science: basic principles. Berlin, Germany: Springer Science & Business Media. [Google Scholar]
- 24.Schrader ME. 1995. Young–Dupre revisited. Langmuir 11, 3585–3589. ( 10.1021/la00009a049) [DOI] [Google Scholar]
- 25.Bergeron V. 1999. Forces and structure in thin liquid soap films. J. Phys.: Condens. Matter 11, R215 ( 10.1088/0953-8984/11/19/201) [DOI] [Google Scholar]
- 26.De Feijter JA, Vrij A. 1972. I. Transition regions, line tensions and contact angles in soap films. J. Electroanal. Chem. Interfacial Electrochem. 37, 9–22. ( 10.1016/S0022-0728(72)80209-2) [DOI] [Google Scholar]
- 27.De Feijter J, Rijnbout J, Vrij A. 1978. Contact angles in thin liquid films. I. Thermodynamic description. J. Colloid Interface Sci. 64, 258–268. ( 10.1016/0021-9797(78)90361-2) [DOI] [Google Scholar]
- 28.Andrews D, Manev E, Haydon D. 1970. Composition and energy relationships for some thin lipid films, and the chain conformation in monolayers at liquid–liquid interfaces. Spec. Discuss. Faraday Soc. 1, 46–56. ( 10.1039/sd9700100046) [DOI] [Google Scholar]
- 29.Berry JD, et al. 2015. Measurement of surface and interfacial tension using pendant drop tensiometry. J. Colloid Interface Sci. 454, 226–237. ( 10.1016/j.jcis.2015.05.012) [DOI] [PubMed] [Google Scholar]
- 30.Róg T, Vattulainen I. 2014. Cholesterol, sphingolipids, and glycolipids: what do we know about their role in raft-like membranes? Chem. Phys. Lipids 184, 82–104. ( 10.1016/j.chemphyslip.2014.10.004) [DOI] [PubMed] [Google Scholar]
- 31.Milianta PJ, Muzzio M, Denver J, Cawley G, Lee S. 2015. Water permeability across symmetric and asymmetric droplet interface bilayers: interaction of cholesterol sulfate with DPhPC. Langmuir 31, 12 187–12 196. ( 10.1021/acs.langmuir.5b02748) [DOI] [PubMed] [Google Scholar]
- 32.Husslein T, Newns DM, Pattnaik PC, Zhong Q, Moore PB, Klein ML. 1998. Constant pressure and temperature molecular-dynamics simulation of the hydrated diphytanolphosphatidylcholine lipid bilayer. J. Chem. Phys. 109, 2826–2832. ( 10.1063/1.476835) [DOI] [Google Scholar]
- 33.Kara S, Afonin S, Babii O, Tkachenko AN, Komarov IV, Ulrich AS. 2017. Diphytanoyl lipids as model systems for studying membrane-active peptides. Biochim. Biophys. Acta 1859, 1828–1837. ( 10.1016/j.bbamem.2017.06.003) [DOI] [PubMed] [Google Scholar]
- 34.Venkatesan GA, Taylor GJ, Basham CM, Brady NG, Collier CP, Sarles SA. 2018. Evaporation-induced monolayer compression improves droplet interface bilayer formation using unsaturated lipids. Biomicrofluidics 12, 024101 ( 10.1063/1.5016523) [DOI] [PMC free article] [PubMed] [Google Scholar]
- 35.Huang J, Buboltz JT, Feigenson GW. 1999. Maximum solubility of cholesterol in phosphatidylcholine and phosphatidylethanolamine bilayers. Biochim. Biophys. Acta 1417, 89–100. ( 10.1016/S0005-2736(98)00260-0) [DOI] [PubMed] [Google Scholar]
- 36.Parker A, Miles K, Cheng KH, Huang J. 2004. Lateral distribution of cholesterol in dioleoylphosphatidylcholine lipid bilayers: cholesterol–phospholipid interactions at high cholesterol limit. Biophys. J. 86, 1532–1544. ( 10.1016/S0006-3495(04)74221-6) [DOI] [PMC free article] [PubMed] [Google Scholar]
- 37.Tarun OB, Eremchev MY, Roke S. 2018. Interaction of oil and lipids in freestanding lipid bilayer membranes studied with label-free high-throughput wide-field second-harmonic microscopy. Langmuir 34, 11 305–11 310. ( 10.1021/acs.langmuir.8b01790) [DOI] [PubMed] [Google Scholar]
- 38.Creasy MA, Freeman EC, Philen MK, Leo DJ. 2015. Deterministic model of biomolecular networks with stimuli-responsive properties. J. Intell. Mater. Syst. Struct. 26, 921–930. ( 10.1177/1045389X14536004) [DOI] [Google Scholar]
- 39.Barlow NE, et al. 2018. Measuring bilayer surface energy and curvature in asymmetric droplet interface bilayers. arXiv, arXiv:1810.09919.
- 40.Petelska AD, Naumowicz M, Figaszewski ZA. 2006. The interfacial tension of the lipid membrane formed from lipid–cholesterol and lipid–lipid systems. Cell Biochem. Biophys. 44, 205–211. ( 10.1385/CBB:44:2:205) [DOI] [PubMed] [Google Scholar]
- 41.Mosgaard LD, Zecchi KA, Heimburg T. 2015. Mechano-capacitive properties of polarized membranes. Soft Matter 11, 7899–7910. ( 10.1039/C5SM01519G) [DOI] [PubMed] [Google Scholar]
- 42.Sokolov V, Mirsky V. 2004. Electrostatic potentials of bilayer lipid membranes: basic principles and analytical applications. In Ultrathin electrochemical chemo- and biosensors, pp. 255–291. Berlin, Germany: Springer; ( 10.1007/978-3-662-05204-4_11) [DOI] [Google Scholar]
- 43.Berthier J. 2012. Micro-drops and digital microfluidics. Oxford, UK: William Andrew. [Google Scholar]
- 44.Alvarez O, Latorre R. 1978. Voltage-dependent capacitance in lipid bilayers made from monolayers. Biophys. J. 21, 1–17. ( 10.1016/S0006-3495(78)85505-2) [DOI] [PMC free article] [PubMed] [Google Scholar]
- 45.Toyama S, Nakamura A, Toda F. 1991. Measurement of voltage dependence of capacitance of planar bilayer lipid membrane with a patch clamp amplifier. Biophys. J. 59, 939–944. ( 10.1016/S0006-3495(91)82308-6) [DOI] [PMC free article] [PubMed] [Google Scholar]
- 46.Beltramo PJ, Scheidegger L, Vermant J. 2018. Towards realistic large area cell membrane mimics: excluding oil, controlling composition and including ion channels. Langmuir 20, 5880–5888. [DOI] [PubMed] [Google Scholar]
- 47.Mugele F, Baret J-C. 2005. Electrowetting: from basics to applications. J. Phys.: Condens. Matter 17, R705–R774. ( 10.1088/0953-8984/17/28/R01) [DOI] [Google Scholar]
- 48.Koronkiewicz S, Kalinowski S. 2004. Influence of cholesterol on electroporation of bilayer lipid membranes: chronopotentiometric studies. Biochim. Biophys. Acta 1661, 196–203. ( 10.1016/j.bbamem.2004.01.005) [DOI] [PubMed] [Google Scholar]
- 49.Anklam M, Saville D, Prud'Homme R. 1999. Disjoining pressure and film tension in comb–graft copolymer-stabilized oil films. Langmuir 15, 7299–7307. ( 10.1021/la9901581) [DOI] [Google Scholar]
- 50.Needham D, Nunn RS. 1990. Elastic deformation and failure of lipid bilayer membranes containing cholesterol. Biophys. J. 58, 997–1009. ( 10.1016/S0006-3495(90)82444-9) [DOI] [PMC free article] [PubMed] [Google Scholar]
- 51.Leikin S. 1985. Thermal fluctuations and capacitance of bilayer lipid membranes in electric field. Biologicheskie Membrani 2, 820–831. [Google Scholar]
Associated Data
This section collects any data citations, data availability statements, or supplementary materials included in this article.
Supplementary Materials
Data Availability Statement
Key experimental data and protocols are all provided in the figures and tables within the manuscript and electronic supplementary material. Original images and axon binary files used to produce these figures are available from the authors on request.