Abstract
Cyto-architectural diversity of brain structures emphasizes need for analytical tools for discriminative investigation of distinctive neural structures. Glycogen is the major energy reserve in the brain. There is speculation that brain utilization of this fuel source may affect detection of hypoglycemia. To evaluate sex-specific regulation of glycogen mass and mobilization in the glucose-sensory ventromedial hypothalamic nucleus (VMN), current research coupled UHPLC-electrospray ionization mass spectrometric (LC/MS-ESI) analysis capabilities with novel derivatization protocols for high-sensitivity measurement of glucose and glycogen in small-volume neural tissue samples. This work also sought to demonstrate utility of pairing this approach with optimized Western blot methods for measurement of glycogen metabolic enzyme protein expression. Here, high-resolution micropunch dissection tools for discriminative isolation of VMN tissue were used in conjunction with newly developed glycogen analytical methods and an experimental treatment paradigm for intra-cranial hindbrain-targeted administration of estrogen receptor-alpha (ERα) or -beta (ERβ) receptor antagonists to address the hypothesis that estradiol activates one or both hindbrain ER populations to exert sex-specific regulatory effects on VMN glycogen mass and hypoglycemia-associated mobilization. Outcomes validate a novel multi-analytical platform for investigation of in vivo sex-dimorphic regulation of glycogen metabolism in precisely-defined brain elements under conditions of energy balance versus imbalance. This combinatory approach will facilitate ongoing efforts to elucidate effects of acute versus chronic hypoglycemia on glycogen metabolism in characterized brain glucose-sensory loci and determine effects local glycogen mass and/or mobilization adaptions on sensory monitoring and signaling of recurring hypoglycemia in each sex.
Keywords: ventromedial hypothalamic nucleus, 1-phenyl 3-methyl 5-pyrazolone, western blot, estrogen receptor, insulin-induced hypoglycemia, glycogen
1. Introduction
Glucose is the primary metabolic substrate for energy production in the brain, where it is utilized at a rate that is highly disproportionate to organ weight. Insulin-induced hypoglycemia (IIH) is an unrelenting complication of requisite strict glycemic control in type I diabetes mellitus [1, 2]. Hypoglycemia-associated neuro-glucopenia poses a significant risk of neural dysfunction and injury as glucose supply to neurons is inadequate to maintain vital, high energy-demand functions. The brain gluco-regulatory network is continuously appraised of cell energy status by specialized metabolic sensors positioned in the brain and periphery, and responds to those cues by activating coordinated contra-regulatory autonomic, neuroendocrine, and behavioral functions. The ventromedial hypothalamic nucleus (VMN) integrates nutrient, endocrine, and neurochemical signals of metabolic state to shape contra-regulatory responses to IIH [3, 4]. VMN detection of neuro-energetic shortage is obligatory for optimal counter-regulatory hormone and gluconeogenic responses to IIH [5]. Requisite rigorous glycemic control in type I diabetes mellitus patients results in regular iatrogenic hypoglycemia, which often leads to the pathophysiological mal-adaptation hypoglycemia-associated autonomic failure (HAAF), which manifests as diminished hypoglycemic awareness and defective glucose counter-regulation [1, 2]. Animal models for recurrent IIH designed to replicate insulin delivery route, frequency of administration, and duration of action in the clinical setting demonstrate blunted neuron genomic activation in metabolic brain loci, results that infer neural habituation to hypoglycemia [6, 7]. The molecular and cellular mechanisms that underlie this debilitating collapse of counter-regulatory defenses against hypoglycemic brain injury remain unclear.
There is increasing focus on the possibility that hypoglycemia may elicit adaptive adjustments in brain neuron energy metabolism, such as increased reliance upon alternative substrate fuels that may, in turn, impede detection and/or signaling of sequential neuro-glucopenia episodes. Brain astrocytes maintain a critical depot of stored energy for neuron oxidative respiration [8]. Astrocytes acquire glucose from the circulation, and either store this molecule as the polymer glycogen or convert it to the oxidizable substrate L-lactate for trafficking to neurons [9]. This energy reservoir sustains nerve cell function and survival during bio-energetic stress as pharmacological augmentation of brain glycogen mass prolongs brain electrical activity during hypoglycemia and prevents nerve cell death [10]. Brain glycogen adaptation to repetitive IIH is postulated to contribute to HAAF as acute hypoglycemic diminution of regional/whole brain glycogen [11, 12] is abolished during chronic exposure [13]. Despite an obvious need to investigate glycogen metabolism within neural structures that function to detect neuro-glucopenia, including the VMN, at relevant time points before, during, and after recovery from hypoglycemia, quantitative analytical methods of requisite sensitivity for accurate, precise measurement of glycogen and its energy substrate metabolite L-lactate in these distinctive locations are not available. Current research sought to develop high-sensitivity analytical tools for quantification of glycogen at high neuroanatomical resolution, namely within small-volume micro-dissected brain tissue samples. Brain tissue glycogen analysis typically involves initial enzymatic digestion of glycogen to liberate free glucose, which is analyzed to produce an estimate of glycogen [14, 15]. Colorimetric [16], amperometric [17], or liquid chromatographic/electrochemical detection methods [18, 19] have been employed to measure brain glucose content. Original analytical methodology described here for brain glycogen measurement is based upon HPLC-electrospray ionization mass spectrometric (LC-ESI-MS) analysis capabilities coupled with novel derivatization protocols. An expanded goal of this work was to demonstrate the significant utility of pairing this approach with optimized Western blot methods for measurement of glycogen metabolic enzyme protein expression in equivalent small sample sizes.
Sex differences in glucose counter-regulatory habituation to recurring IIH are documented in the clinical and experimental literature, as males, but not females exhibit exacerbated patterns of hypoglycemia and blunted counter-regulatory hormone secretion during recurring IIH [20]. We reported that systemic reinstatement of physiological levels of the ovarian steroid hormone estradiol in ovariectomized (OVX) female rats prevents recurring IIH-associated intensification of hypoglycemia and attenuation of brain neuron genomic activation [21]. Estradiol control of eu- and hypoglycemic patterns of astrocyte glycogen phosphorylase enzyme protein expression in key hypothalamic gluco-regulatory loci in vivo, including the VMN, requires catecholamine signaling from the dorsomedial hindbrain, where the estradiol-sensitive nucleus of the solitary tract, the primary visceral sensory nucleus in the brain, resides [22]. Here, high-resolution micropunch dissection tools for discriminative isolation of VMN tissue were used in conjunction with newly developed glycogen analytical methods and an experimental treatment paradigm for intra-cranial hindbrain-targeted administration of estrogen receptor-alpha (ERα) or -beta (ERβ) receptor antagonists to address the hypothesis that estradiol activates one or both hindbrain ER populations to exert sex-specific regulatory effects on glycogen mass and mobilization metabolism during hypoglycemia.
2. Materials and methods
2.1. Development and Characterization of LC-ESI-MS Glycogen Analysis Methodology
2.1.1. Reagents and supplies
Sodium hydroxide, 1-phenyl 3-methyl 5-pyrazolone (PMP), D-(+)-glucose-13C6 (≥99.0%), bovine liver glycogen, amyloglucosidase (Aspergillus niger), glacial acetic acid, and Tris hydrochloride were purchased from MilliporeSigma (Burlington, MA). Sodium acetate trihydrate, LC-MS grade methanol, and National C5000–1W 2mL clear glass ID Surestop vials was obtained from Thermo FisherScientific (Waltham, MA). Hipersolv chromanorm-acetonitrile was purchased from VWR Intl. (Atlanta, GA). Ammonium acetate was purchased from J.T. Baker-Avantor (Radnor, PA). High-purity formic acid and chloroform HPLC grade were obtained from VWR Intl. (Radnor, PA). Sodium bicarbonate was purchased from Spectrum Chemicals Mfg. Corp. (New Brunswick, NJ). Small volume (350μL) flat bottom borosilicate glass inserts (6 × 31 mm; AQ Brand) were obtained from Microsolv Technology Corp. (Leland, NC).
2.1.2. Pre-column derivatization of D-(+)-Gglucose with PMP
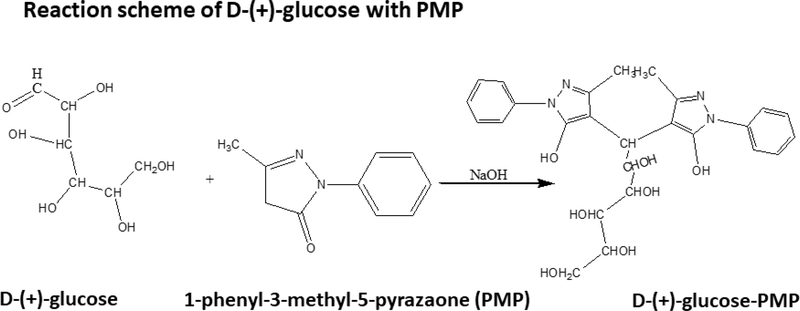
Accurately weighed 10.0 mg D-(+)-Glucose was dissolved in 1.0 mL water; after vigorous shaking, a 100 μL aliquot was added to 0.5 M methanolic PMP (100 μL) and 0.3 M sodium hydroxide (100 μL), then heated to 70° C (30 min.), followed by cooling to room temperature [23, 24]. After centrifugation at 5000 rpm (2 min.), excess sodium hydroxide was neutralized with 400 μL 0.2 M formic acid. Samples were shaken, extracted with 500 μL chloroform, vacuum-concentrated (30 min; 45° C) for removal of chloroform and formic acid, transferred to fresh tubes, frozen at −80°C (30 min.), and lyophilized. The lyophilization product was diluted to 1.0 mL with 10 mM ammonium acetate, bath-sonicated (30 sec.), and centrifuged. Supernatant aliquots (250 μL) were transferred to 350 μL inserts, which were placed into 2 mL Surestop vials in an autosampler tray. D-(+)-Glucose-PMP derivative was measured by LC-MS at m/z 510.2. The reaction scheme is presented in Figure 1. A calibration curve ranging from 62.5 to 1000 μg D-(+)-Glucose-PMP/mL was developed.
Figure 1.
Glucose reacts with 1-phenyl-3-methyl-5-pyrazolone in mild alkaline conditions, forms glucose-PMP derivative. This derivative can be detected in negative mode at m/z 510.2.
2.1.3. Hydrolysis of glycogen and derivatization of released glucose
After preparation of a stock solution of glycogen in water (2 mg/mL), diluted stock aliquots (20 μL) containing 0.625 or 40.0 μg glycogen were transferred to tubes containing 0.1M sodium acetate, pH 5.0 (10μL) and 0.5 mg/ml amyloglucosidase (10μL) [Fuller et al]. Contents were vortexed (30 sec.), centrifuged, and incubated at 37° C (2 hr). Hydrolysis reactions were terminated by heating to 100° C (5 min). Tubes were cooled to room temperature, centrifuged at 5000 rpm (2 min), wrapped with perforated aluminum foil, frozen at −80° C (30 min), and lyophilized overnight at −55° C. Lyophilized samples were treated with 100μL 0.5M methanolic PMP and 100μL 0.3M sodium hydroxide, then processed according to sequential steps described above. PMP derivative of released glucose was diluted to 1 mL with 10 mM ammonium acetate.
2.1.4. Chromatography conditions for D-(+)-Glucose-PMP
An assembled chromatography system [UHPLC Vanquish binary pump (prod. no. VFP10A01/121345), Vanquish auto-sampler (prod. no. VFA10A02/121345), and temperature-controlled Vanquish UHPLC+ column compartment (prod. no. VHC10A02/121345)] was coupled to an ISQ EC mass spectrometer (prod. no. ISQECLC/121345) (ThermoFisherScientific, Waltham, MA). Two chromatographic [Acclaim TM 120 C18 (4.6 mm ID × 100 mm L, 5μm, 120Å; prod. no. 059147, ThermoFisherSci.) and Shodex™ Asahipak™ NH2P-4 3E (3.0 mm ID × 250 mm L); no. M17T0005, Midland Scientific, Inc., La Vista, NE] columns were used to optimize mass spectrometric parameters for detection of D-(+)-Glucose-PMP. Column and autosampler temperatures were 35° C and 15° C, respectively. The auto-sampler needle was washed with 10% (v/v) methanol (10 sec). ThermoScientific™ Dionex™ Chromeleon™ 7 Chromatography Data System software (prod. no. 7200.0300/121345) was used for mass spectrometric analysis.
2.1.5. Mass spectrometric conditions for D-(+)-Glucose-PMP
Analysis of D-(+)-Glucose-PMP was performed in negative ionization mode. D-(+)-Glucose-PMP ion chromatograms were extracted from Total Ion Current (TIC) at m/z 510.2 to generate area-under-the-curve data. Parameters for sheath gas pressure (SGP; 25 psig), auxiliary gas pressure (AGP; 4.6 psig), sweep gas pressure (SWGP; 0.5 psig), vaporizer temperature (VT; 150° C), ion transfer tube temperature (ITT; 150° C), source voltage (−2000V), foreline pressure (1.76 Torr; auto-set by instrument- and variable), source gas (nitrogen; Genius NM32LA 110V, 10–6520; Peak Scientific, Inchinnan, Scotland), and mass peak area detection algorithm (ICIS/Genesis) were maintained at optimum. The mass scan range was between 170 and 700.
2.1.6. Assessment of D-(+)-Glucose-PMP chromatographic performance: C18 column
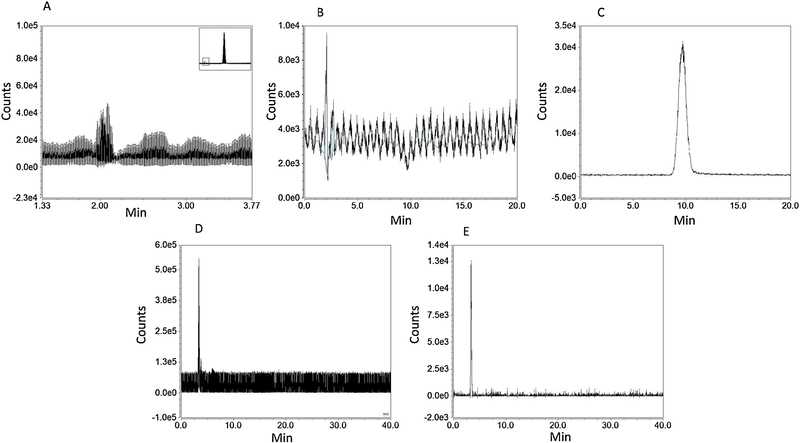
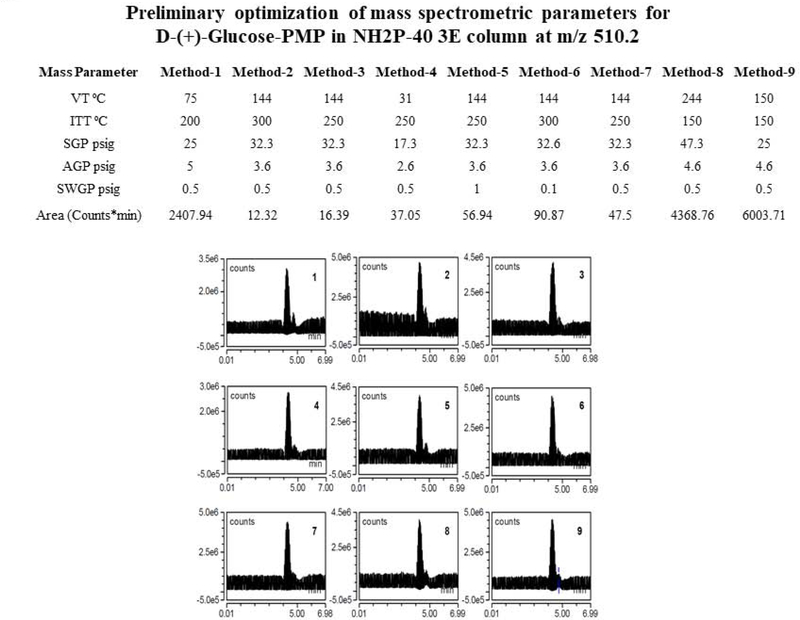
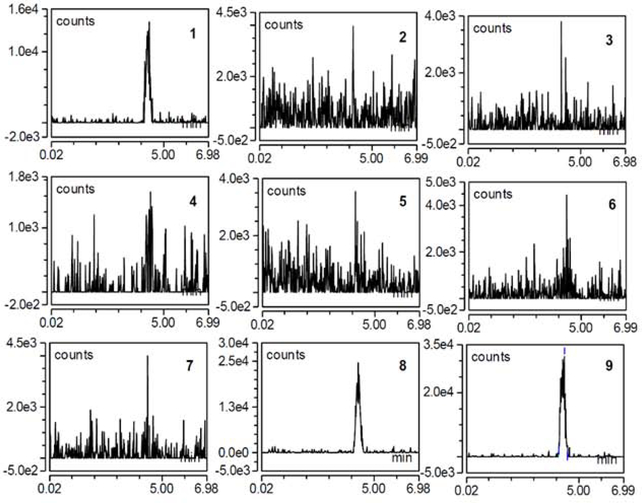
Acetonitrile: 10 mM ammonium acetate (25:75, v/v) was run as mobile phase, at a 0.5 mL/min flow rate, over a 20 min. run interval. Column compartment and auto-sampler temperatures were set at 40° C and 15° C, espectively. Mass spectrometry source settings were set as follows: VT=282° C, ITT=300° C, SGP=49.9psig, AGP=5.7 psig, SWGP=0.5psig. M/z scans, e.g. 173–176, 505–515, in negative mode and positive mode were run with source voltage −2000V and 3000V, respectively. Chromatograms showing intended peaks occurred only in negative mode. Post-injection recording of 10 μL 12.48 ug D-(+)-Glucose-PMP/mL acetonitrile:10 mM ammonium acetate (25:75, v/v) was carried out for 20 min [Figure 1, Panels A–C]. Shodex™ Asahipak™ NH2P-40 3E column: Acetonitrile:10 mM ammonium acetate (75:25, v/v) was run as mobile phase at column compartment and auto-sampler temperatures of 35° C and 15° C, respectively. Source settings were as follows: VT=70° C, ITT=200° C, SGP=25psig, AGP=5psig, SWGP=0.5psig, and source voltage −2000V and 3000V, respectively. Post-injection recording of 10μL of 50μg D-(+)-Glucose-PMP/mL was performed over a 40 min interval; results were obtained only in negative scan mode [Figure 2, Panels D and E]. After attaining a two-fold improvement of D-(+)-Glucose-PMP detection using the Shodex™ Asahipak™ NH2P-40 3E column, various gas and temperature parameters were manipulated in an effort to further enhance detection [Figure 2], while sample injection volume, flow rate and mobile phase composition were kept constant. TIC and extracted chromatograms obtained at m/z 510.2 are depicted in Figures 3 and 4, respectively. Preliminary optimization revealed that VT=150° C, ITT=150° C, SGP=25psig, AGP=4.6psig, SWGP=0.5psig produced greatest peak area for D-(+)-Glucose-PMP at 510.2.
Figure 2. Optimization of Chromatography Conditions for D-(+)-Glucose-PMP.
A) Representative total ion current (TIC) chromatogram of D-(+)-Glucose-PMP 12.48μg/mL in C18 column, Inj. Volume: 10μL, showing very low chromatographic sensitivity at retention time 2.1 min compared to PMP alone (large PMP peak shown in box at upper right-hand corner) at 10 min. B) Extracted D-(+)-Glucose-PMP showed very low chromatographic area at 2.1 min and poor resolution. C) Extracted PMP has very high chromatographic area at retention time 10 min and can be detected easily over D-(+)-Glucose-PMP in C18 column, indicating unsuitability of this column for identification of D-(+)-Glucose-PMP. D) TIC chromatogram of D-(+)-Glucose-PMP 50μg/mL in NH2P-40 3E column, Inj. Vol: 10μL, shows D-(+)-Glucose-PMP detection with distinguishing chromatographic peak at retention time 3 min in NH2P-40 3 E column. E) Extracted chromatogram of D-(+)-Glucose-PMP in NH2P-40 3E column at m/z 510.2 shows sele.ctive D-(+)-Glucose-PMP at retention time 3.5 min.
Figure 3. TIC Chromatogram of D-(+)-Glucose-PMP 50μg/mL, Inj.Vol: 10μL.
Effects of vaporizer temperature (VT), ion transfer tube temperature (ITT), sheath gas pressure (SGP), aux gas pressure (AGP), and sweep gas pressure (SWGP), described in Methods 1–9, are shown in corresponding TIC D-(+)-Glucose-PMP chromatograms 1–9.
Figure 4. Preliminary Optimization of Mass Spectrometric Parameters for D-(+)-Glucose-PMP in NH2P-40 3E column at m/z 510.2.
Extracted chromatograms 1–9 of D-(+)-Glucose-PMP 50μg/mL, Inj.Vol: 10μL. Mass spectrometric parameters of Method 9 show highest D-(+)-Glucose-PMP peak area in NH2P-40 3E column using Method 9.
2.1.7. Optimization of mass spectrometry parameters for D-(+)-Glucose-PMP using Shodex™ Asahipak™ NH2P-40 3E
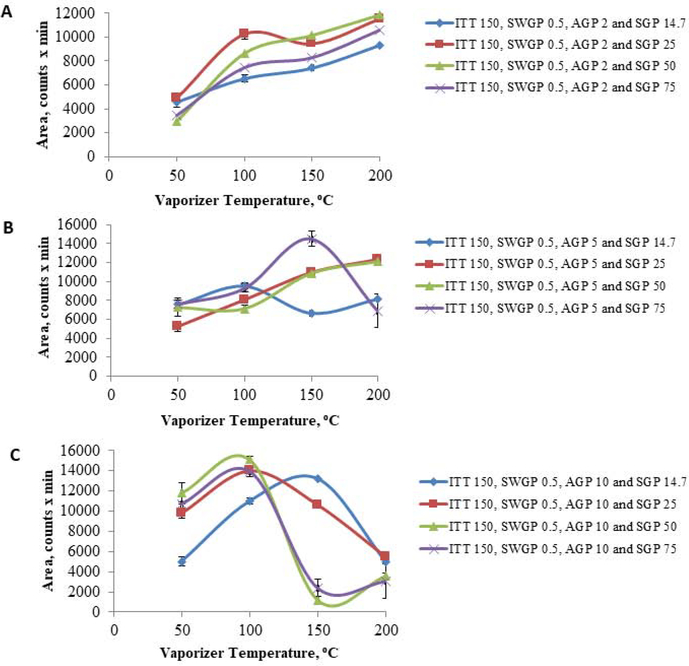
Various combinations of the AGP, SGP, ITT, and VT at constant SWGP and ITT were evaluated to determine maximal area at constant SWGP=0.5 psig and ITT=150°C. The response parameter was peak area with respect to a linear increase in VT at various levels of AGP and SGP [Figure 5].
Figure 5. Optimization of SGP and AGP Parameters for D-(+)-Glucose-PMP.
A) At AGP 2, SGP 50 psig yielded highest peak area at vaporizing temperature (VT) 200°C compared to 14.7, 25, or 75 SGP, respectively. SGP 50 psig caused a poor response at VT 50°C. Most chromatograms showed split peaks. B) At AGP 5, a distinct chromatographic peak without splits were observed at SGP 25 psig, VT 150°C, though peak area was medium when compared to SGP 75 psig and 14.7 psig. C) At AGP 10, SGP 50 and 75 psig, peak area degrades at ITT and 150°C VT; most data had split peaks and were not selected for further analyses.
2.1.8. Impact of D-(+)-Glucose-PMP sample volume on TIC background
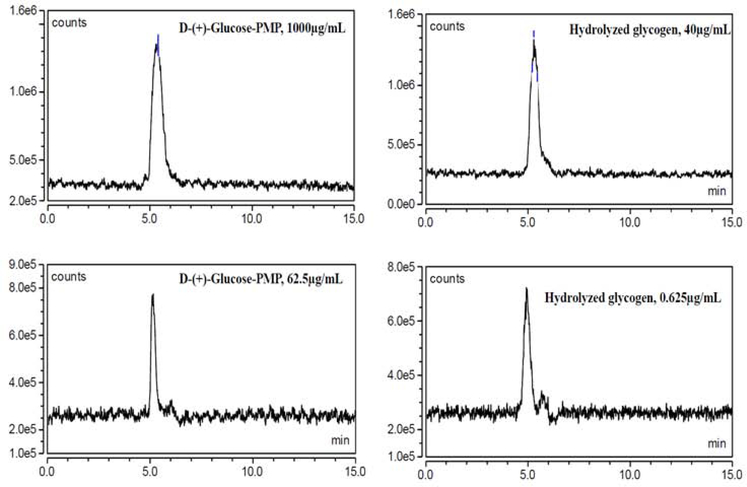
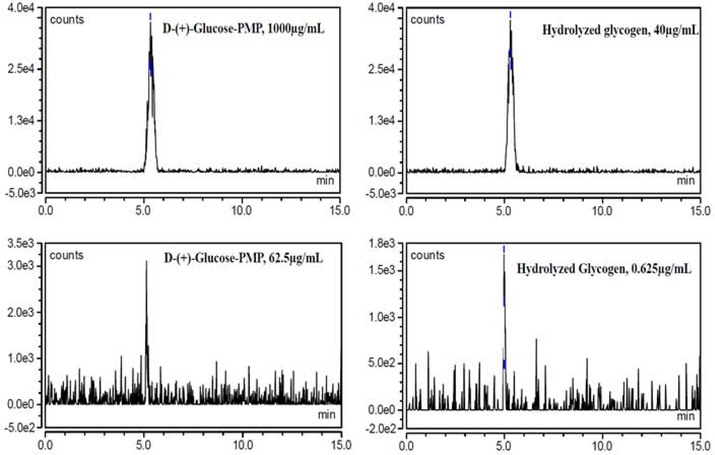
Reduction of sample injection volume from 10μL to 2μL resulted in a clean TIC chromatogram without background. Mass method parameters were set at AGP=4.6 psig, SGP=25 psig, SWGP=0.5 psig, VT=150°C, and ITT=150°C, respectively. D-(+)-Glucose-PMP (2μL; 1000μg/mL or 62.5μg/mL) and hydrolyzed glycogen diluted with 10mM ammonium acetate (2μL; 40μg/mL or 0.625μg/mL) were injected separately. A flow rate of 0.25mL/min, mobile phase 75:25v/v, acetonitrile: 10mM ammonium acetate, and Shodex™ Asahipak™ NH2P-40 3E column were used. Column and autosampler temperatures were 35° C and 15° C, respectively. TIC and extracted chromatograms are shown in Figures 6 and 7, respectively.
Figure 6. TIC Chromatogram, Inj. Vol: 2μL.
AGP 4.6 psig, SGP 25 psig, SWGP 0.5 psig, VT 150°C, and ITT 150°C were selected for the analysis of D-(+)-Glucose-PMP. Representative chromatograms here show lack of D-(+)-Glucose-PMP background from standard (at left) or hydrolyzed glycogen (at right) when inj. vol. less than or equal to 2μL.
Figure 7. Extracted chromatograms at m/z 510.2, Inj. Vol: 2μL.
Extracted chromatograms show peaks with highest and least D-(+)-Glucose-PMP area from standard (at left) and hydrolyzed glycogen (at right) with retention time 5 min. Different concentrations were selected to generate a linear equation for glucose and glycogen.
2.1.9. Internal standard (IS) for D-(+)-Glucose-PMP did not produce a response
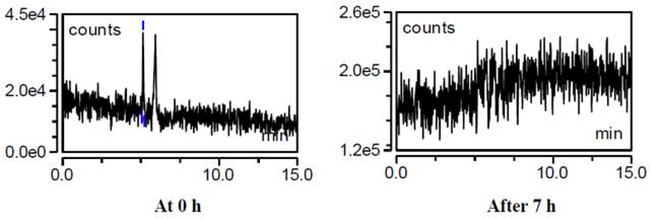
The D-(+)-Glucose-13C6 failed to yield a reproducible response, and degraded after 7hr of residence in autosampler at 15°C, and was measured at [M-H] m/z 515.2 [Figure 8]. A high IS concentration, e.g. 4mg/mL, was required to elicit a minimal response at AGP=4.6 psig, SGP=25 psig, SWGP=0.5 psig, VT=150°C, and ITT=150°C.
Figure 8. Internal standard D-(+)-Glucose-PMP (13C6) lacks stability [M-H], m/z 515.2.
Mass spectrometric parameters of AGP 4.6 psig, SGP 25 psig, SWGP 0.5 psig, VT 150°C, and ITT 150°C selected for the analysis of internal standard (IS) 13C6-D-(+)-Glucose-PMP. A high IS concentration of 4mg/mL was selected, but failed to show a good response at 0 h and was destabilized after 7 h.
2.2. Application of Combinatory Microdissection/High-Sensitivity Glycogen and Protein Analytical Techniquesfor Assessment of Hindbrain ER Regulation of VMN Glycogen Metabolism during IIH in Male versus Female Rats
2.2.1. Experimental design
On day 1, adult male and female Sprague-Dawley rats (2–3 months of age) were implanted under stereotaxic surgery with a PE-20 cannula aimed at the caudal fourth ventricle (CV4) [coordinates: 0.0 mm from midline; −13.3 mm posterior to bregma, 6.6 mm ventral to skull surface] under ketamine/xylazine anesthesia (0.1 mL/100 g bw, 90 mg ketamine: 10 mg xylazine/mL; Henry Schein Inc., Melville, NY). Females were bilaterally OVX at the same time. On day 7, female rats were anesthetized with isoflurane for subcutaneous implantation of a 17β-estradiol-3-benzoate – filled silastic capsule (i.d. 0.062 in./o.d. 0.125 in.; 10 mm/100 g bw; 30 ug/mL safflower oil) to replicate plasma metestrus-level estradiol concentrations [25]. At 08.45 hr on Day 10, groups of rats of each sex were injected into the CV4 with the vehicle dimethyl sulfoxide (DMSO, 200 nL; groups 1 (n=6 males, n=6 females) and 2 (n=6 males, n=6 females); the ERα antagonist 1,3-Bis(4-hydroxyphenyl)-4-methyl-5-[4-(2-piperidinylethoxy)phenol]-1H-pyrazole dihydrochloride (MPP) [10 uM/200 nL; Tocris/Bio-Techne Corp., Minneapolis, MN; group 3 (n=6 males, n=6 females)], or the ERβ antagonist 4-[2-phenyl-5,7-bis(trifluoromethyl)pyrazolo[1,5-a]pyrimidin-3-yl]phenol (PHTPP) [10 uM/200 nL; Tocris; group 4 (n=6 males, n=6 females)] [26]. At 9:00 hr on Day 10, rats in group 1 were injected sc with vehicle (V; sterile diluent; Eli Lilly & Co., Indianapolis, IN), while groups 2–4 were received an injection of neutral protamine Hagedorn insulin (INS; 10 U/kg bw; Eli Lilly). At one hour post-injection, e.g. 10:00 hr, animals were sacrificed by microwave fixation (1.45 sec exposure; In Vivo Microwave Fixation System, 5kW; Stoelting Co., Wood Dale, IL). Brains were stored at −80°C.
2.2.2. VMN microdissection for tissue glycogen and protein measurements
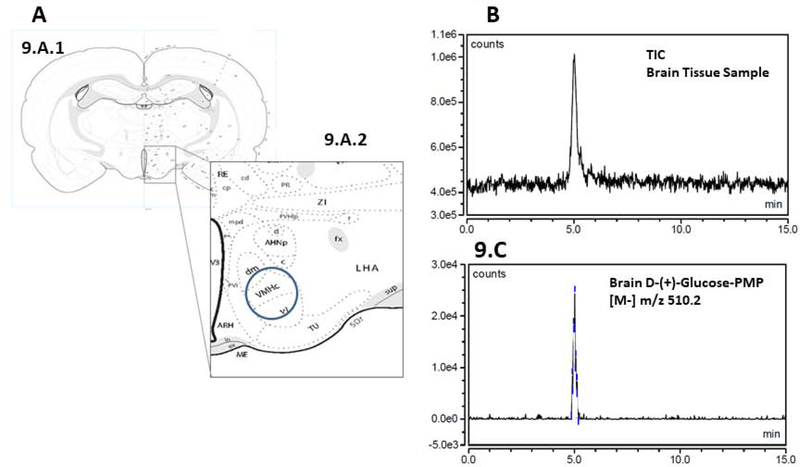
From each hypothalamus, two consecutive 150 μm-thick frozen sections were cut through the VMN between −2.40 and −2.70 mm posterior to bregma. VMN tissue was bilaterally microdissected from both tissue sections using a hollow calibrated punch tool [Stoelting Co.] [Figure 9, Panel A], as described [27], and collected in 02 M Tris buffer, pH 7.2 for LC/MS-ESI analysis, followed by collection between −2.70 and −3.30 mm of six 100 μm-thick sections into lysis buffer [2.0% sodium dodecyl sulfate, 0.05 M dithiothreitol, 10.0% glycerol, 1.0 mM EDTA, 60.0 mM Tris-HCl, pH 7.2] for immunoblotting.
Figure 9. LC-ESI-MS analysis of derivatized VMN tissue glucose.
A coronal section through the brain at the level of the VMN is illustrated in Panel 8.A.1; hypothalamic area containing the VMN is enclosed within the rectangular box. That same area is enlarged in Panel 8.A.2 to depict the positioning of the hollow punch tool for selective harvesting of VMN tissue. Panels 8.B and 8.C show representative Negative Mode TIC and extracted chromatograms, respectively, of microdissected VMN tissue D-(+)-Glucose-PMP. Abbreviations: V3: third ventricle; ARH; arcuate hypothalamic nucleus; VMHc,dm,vl: central, dorsomedial, and ventrolateral parts of the ventromedial hypothalamic nucleus; AHNp,c,a: posterior, central, and anterior parts of the anterior hypothalamic nucleus; mpd, pv: medial parvicellular part (dorsal zone), periventricular parts of the PVH; PVi: intermediate periventricular hypothalamic nucleus; LHA: lateral hypothalamic area; ZI: zona incerta; fx: fornix; MEin: median eminence, internal lamina; MEex: median eminence, external lamina; TU: tuberal nucleus.
2.2.3. VMN glycogen quantification
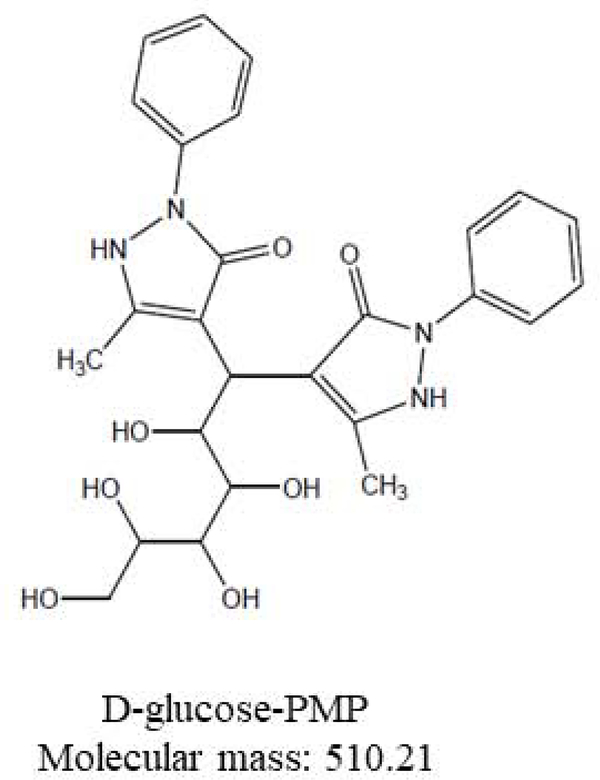
Supernatant aliquots (20 μL) were hydrolyzed by incubation (2 hr) with 0.5 mg/ml amyloglucosidase (10 μL) and 0.1M sodium acetate (10 μL), heated to 100°C (5 min) then cooled to room temperature. Hydrolyzed and non-hydrolyzed sample aliquots (20 μL) were combined with 100 μL 0.5M methanolic PMP and 100μL 0.3M sodium hydroxide, heated to 70° C (30 min), then freeze-dried ahead of storage at −80° C. Derivatized samples were first acidified with 0.75% formic acid (400 μL), then extracted with chloroform prior to vacuum-concentration, frozen at −80°C, and lyophilized. Samples were diluted to 1.0 mL with 10 mM ammonium acetate, bath-sonicated for 30 sec., centrifuged, and supernatant aliquots (250 μL) were transferred to 350 μL inserts for placement into 2.0 mL Surestop vials. Tissue glycogen concentrations, as calculated by subtracting from hydrolysis-derived total glucose concentrations, were determined using a calibration curve. TIC chromatograms of VMN tissue samples analyzed in negative mode were extracted using m/z value of D-(+)-Glucose-PMP at 510.2 [Figure 9, Panel B]; derivatized compound structure is shown in Figure 10. Tissue glycogen concentrations, as calculated by subtracting from hydrolysis-derived total glucose concentrations, were determined using a calibration curve, where y=25.031×−2.5466, over a range of 0.625 – 40 ug/mL, R2 = 0.9962, and expressed as ng/mg. Values were analyzed between the two sexes by two-way analysis of variance and Student Newman Kuels test. Differences of p<0.05 were considered significant. Methodological accuracy was calculated as percent relative error, i.e. ((measured value-exact value)/exact value) × 100) of 22%. Intra- and inter-day analytical precision was expressed as relative standard deviations of chromatographic area of < 5 % and 14%, respectively. Detection and quantitation limits were determined based on standard deviation of the y-intercept of the regression line to be 21.65 ng/μL (42.45 μM) and 65.63 ng/μL (128.64 μM), respectively.
Figure 10.
D-(+)-glucose-PMP. Molecular mass: 510.21.
2.2.4. Western blot analysis of VMN glycogen synthase (GS) and glycogen phosphorylase (GP) protein expression
Tissue punches collected for immunoblotting were heat-denaturated at 95°C. Within each treatment group, lysate aliquots from each subject were combined to create three individual sample pools for each protein of interest prior to separation in Bio-Rad Stain Free 10–12% acrylamide gels (Bio-Rad, Hercules, CA). Gels were activated (1 min.) by UV light in a BioRad ChemiDoc TM Touch Imaging System ahead of overnight transblotting (4–5°C) to 0.45-μm PVDF-Plus membranes (ThermoFisherScientific, Waltham, MA) [28]. Membranes were incubated with rabbit primary polyclonal antisera against GS (1:2,000; 3893S; Cell Signaling Technology, Danvers, MA) or GP-muscle type (GPmm; 1:2000; NBP2–16689; Novus Biologicals, LLC, Centennial, CO), followed by goat anti-rabbit secondary antibodies (1:5,000; NEF812001EA; PerkinElmer, Waltham, MA) and Supersignal West Femto maximum sensitivity chemiluminescent substrate (34096; ThermoFisherSci.). Membrane buffer washes and antibody incubations were carried out by Freedom Rocker™ Blotlbot® automation (Next Advance, Inc., Troy NY). Chemiluminescence band optical density (O.D.) values obtained in the ChemiDoc MP system were normalized to total in-lane protein with Imagelab software (Image Lab™ 6.0.0; Bio-Rad). Precision plus protein molecular weight dual color standards (161–0374; Bio-Rad) were included in each Western blot analysis. Mean normalized Western blot protein O.D. values were evaluated within each sex by one-way analysis of variance and Student Newman Keuls test. Differences of p<0.05 were considered significant.
3. Results
Total ion current (TIC) chromatograms of D-(+)-Glucose-PMP after C18 column separation [Figure 2, Panel A], did not feature a distinct peak, but instead multiple peaks along the chromatographic run. Desired analyte resolution was achieved using a hydrophilic interaction liquid chromatography (HILIC) (Asahipak NH2P-40 3E) column. Glucose was substantially separated on the latter column into a single peak within a defined set of mass spectrometric parameters, including ITT =150 °C (Figure 2, Panels D and E), while C18 column separation resolved PMP, but not the glucose derivative effectively (Panel 2C).
Methods 1–9 produced respective chromatograms shown in Panels 1–9, Figure 3, after manipulation of various gas and temperature settings. Method 9 was selected for quantitation of glucose in biological matrices due to magnitude of the D-(+)-Glucose-PMP peak. Extracted chromatograms in Figure 4 show that Methods 2–7 cause derivative degradation (Panels 2–7). Based upon method 1, 8, and 9, ITT was fixed at 150 °C, SWGP was held at 0.5 psig, and VT was changed from 50 °C to 200 °C. Figure 5 illustrates effects of distinctive VT on AGP and SGP parameters, where peak splits occurred despite ample chromatograph area. Ultimately, ITT=150 °C, VT=150 °C, SWGP=0.5 psig, AGP=4.6 psig or 5 psig, and SGP=25 psig were established to obtain desired chromatographic resolution. TIC and extracted chromatograms for standard and hydrolyzed glucose are shown in Figures 6 and 7, respectively, indicating that proposed methods were selective for glucose derivative resolution with excellent peak properties. Data in Figure 8 indicate that loss of 13C6-glucose stability after 7 hr precludes its use as internal standard. Validation of applicability of developed LC-ESI-MS methodology for glucose quantification in micro-dissected brain tissue is illustrated in TIC and extracted chromatograms correspondingly presented in Figure 9, Panel B. Figure 10 shows the molecular mass of D-(+)-Glucose-PMP resolved in extracted chromatograms.
Data presented in Table 1 show that IIH significantly increased VMN glycogen levels in male rats, but decreased tissue content in females [F(7,27) = 36.97; p < 0.0001; gender effects: F(1,27) = 143.62, p < 0.0001; treatment effects: F(3,27) = 16.23, p < 0.0001; gender*treatment effects: F(3,27) = 7.15, p = 0.002]. PHTPP pretreatment caused greater glycogen accumulation compared to vehicle-pretreated hypoglycemic males, suggesting that hindbrain ERβ signaling mitigates IIH stimulation of local glycogen content. In females, PHTPP reversed hypoglycemic inhibition of VMN glycogen amassment, indicating that ERβ inhibits VMN glycogen in both sexes. Outcomes reveal that glycogen concentrations in the VMN, a critical glucose-sensory structure in the brain, change in opposite directions in male versus female rats during acute hypoglycemia, and that the glycogen decline in the latter sex is driven by hindbrain ERβ signaling.
Table 1.
Effects of Hindbrain Estrogen Receptor Antagonist Administration on Ventromedial Hypothalamic Nucleus Glycogen Content in Male Versus Female Rats
| Treatment Groups |
||||
|---|---|---|---|---|
| V/V b | V/INS c | MPP/INS d | PHTPP/INS e | |
| Male a | 3.88 ± 1.86 f | 9.60 ± 0.70 g | 5.75 ± 1.90 | 16.85 ± 2.37 g,h |
| Female a | 38.12 ± 5.13 i | 25.18 ± 0.57 g,i | 19.75 ± 3.67 g,h,i | 48.38 ± 1.04 g,h,i |
n=6 animals /treatment group
intra-caudal fourth ventricle (CV4) vehicle (V) pretreatment before subcutaneous (sc) vehicle (V) injection
intra-CV4 pretreatment before sc 10.0 U neutral protamine Hagedorn insulin (INS) /kg body weight injection
intra-CV4 1,3-Bis(4-hydroxyphenyl)-4-methyl-5-[4-(2-piperidinylethoxy)phenol]-1H-pyrazole dihydro-chloride [10 uM/200 uL] pretreatment before sc INS injection
intra-CV4 4-[2-phenyl-5,7-bis(trifluoromethyl)pyrazolo[1,5-a]pyrimidin-3-yl]phenol [10 uM/200 uL] pretreatment before sc INS injection
ng/mg
p<0.05 compared to V/V group of same sex
p<0.05 compared to V/INS group of same sex
p<0.05, compared to identical treatment group of opposite sex
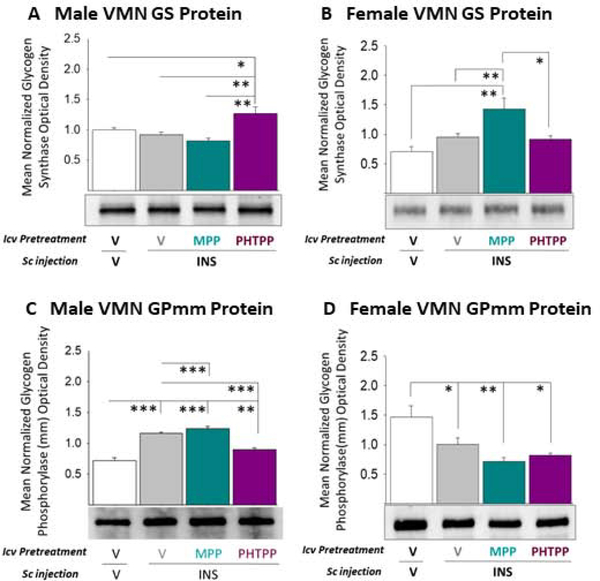
As shown in Panel A, Figure 11, IIH did not alter VMN GS protein expression profiles in male (at left) or females (at right) rats. PHTPP pretreatment increased tissue GS levels in hypoglycemic males [F(3,8) = 8.93; p = 0.002], whereas MPP augmented GS in females [F(3,8) = 7.67; p = 0.002]. These data imply that ERβ signaling opposes GS expression in males, but that ERα inhibits this profile in females. VMN GS protein refractoriness to IIH, despite inhibitory hindbrain ER input, implies stabilization of this profile by independent stimulatory cues. IIH caused divergent alterations in VMN GPmm expression in male (Figure 10, Panel B, at left) [F(3,8) = 42.25; p < 0.0001] versus female rats (Figure 10, Panel B, at right) [F(3,8) = 7.68; p = 0.009]. MPP or PHTPP pretreatment respectively further increased or normalized GP expression in males. Hypoglycemic suppression of VMN GP profiles in females was not modified by either drug pretreatment. VMN GP up-regulation during hypoglycemia is apparently mediated by hindbrain ERβ, whereas reduced expression of this protein in females does not involve hindbrain ERs. Taken together, results demonstrate hindbrain ER involvement in sex-specific adjustments in VMN glycogen metabolism during acute hypoglycemia.
Figure 11. Effects of Caudal Fourth Ventricular (CV4) Administration of the ERα Antagonist 1,3-Bis(4-hydroxyphenyl)-4-methyl-5-[4-(2-piperidinylethoxy)phenol]-1H-pyrazole dihydrochloride (MPP) or ERβ Antagonist 4-[2-phenyl-5,7-bis(trifluoromethyl)pyrazolo[1,5-a]pyrimidin-3-yl]phenol (PHTPP) Ventromedial Hypothalamic Nucleus (VMN) Glycogen Metabolic Enzyme Protein Expression during Insulin-Induced Hypoglycemia (IIH) in Female Versus Male Rats.
Micropunch-dissected VMN tissue was obtained from groups of male and estradiol – implanted ovariectomized female rats pretreated by CV4 administration of MPP, PHTPP, or vehicle prior to sc insulin (INS) injection for Western blot analysis of glycogen synthase (GS) [Panel A, male; Panel B, female] or glycogen phosphorylase-muscle type (GPmm) [Panel C, male; Panel D, female]. Data depict mean normalized protein optical density (O.D.) values ± S.E.M. for vehicle-pretreated animals injected sc with vehicle- (white bars; n=6) or INS (gray bars; n=6) or INS-injected rats pretreated with MPP (cyan bars; n=6) or PHTPP (purple gray bars; n=6). *p<0.05; **p<0.01; **p<0.001.
4. Summary
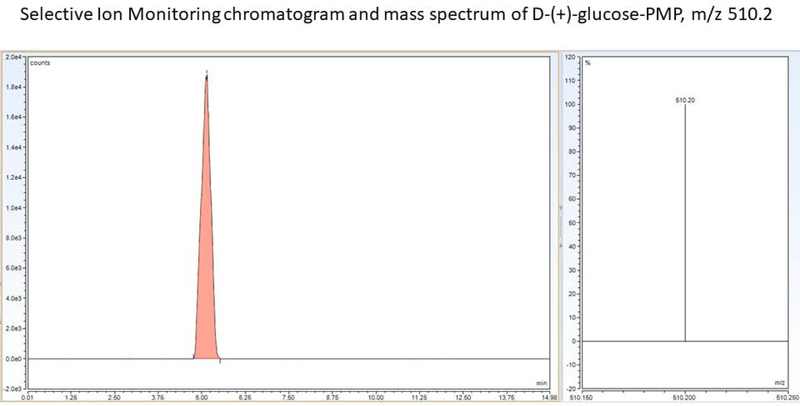
LC-ESI-MS methodology described here has utility for accurate analysis of glycogen in microdissected brain tissue samples, as specificity was confirmed by selective ion monitoring at m/z 510.2 [Figure 12]. This technique features lower sample injection volume and lesser VT and ITT compared to other methods. Retention time of Glucose-PMP is significantly less than previous reported. Additional advantages include reduced time of analysis, decreased glucose-PMP retention time, absence of matrix effects on chromatogram peaks, lower vaporizer and ion tube transfer temperatures due to maintenance of peak symmetry, analyte resolution time of less than 5 min, elimination of column effluent diversion and post- column wash with acetonitrile, and lower organic solvent consumption owing to lesser flow rate.
Figure 12.
Glucose-PMP selective ion monitoring mass chromatogram and mass spectrum.
5. Conclusions
The complex neurochemical and functional heterogeneity of structural components of the brain, including those that comprise the neural gluco-regulatory network, was a compelling impetus for development here of quantitative analytical tools for measurement of glucose and glycogen in small-volume neural tissue samples. LC-ESI-MS methodology described here provides requisite quantitative analytical sensitivity for high neuroanatomical resolution analysis of brain glucose and glycogen. Use of this method here, in conjunction with minute-scale brain tissue dissection and optimized protein analytical techniques validates a novel multi-analytical platform for investigation of in vivo sex-dimorphic regulation of glycogen metabolism in precisely-defined brain elements under conditions of energy balance versus imbalance. This combinatory approach will facilitate ongoing research by our laboratory to understand effects of acute versus chronic IIH on glycogen metabolism in characterized brain glucose-sensory structures, and to clarify the impact of adaptive changes in local glycogen mass and/or mobilization on sensory monitoring and signaling of recurrent hypoglycemia in each sex.
Highlights.
The brain ventromedial hypothalamic nucleus (VMN) detects and corrects hypoglycemia.
VMN glycogen mass and metabolism were assessed by UHPLC-ESI-MS and Western blot.
Sex-specific hypoglycemia effects on these parameters involve estrogen hindbrain action.
Results validate a in vivo multi-analytical platform for small-volume brain samples.
Acknowledgments
This research is funded by NIH DK 109382
Abbreviations
- AGP
aux gas pressure
- ERα
estrogen receptor-alpha
- ERβ
estrogen receptor-beta
- GS
glycogen synthase
- GP
glycogen phosphorylase
- HAAF
hypoglycemia-associated autonomic failure
- IIH
insulin-induced hypoglycemia
- INS
insulin
- ITT
ion transfer tube temperature
- LC-ESI-MS
HPLC-electrospray ionization mass spectrometry
- OVX
ovariectomized
- MPP
1,3-Bis(4-hydroxyphenyl)-4-methyl-5-[4-(2-piperidinylethoxy)phenol]-1H-pyrazole dihydrochloride
- PHTPP
4-[2-phenyl-5,7-bis(trifluoromethyl)pyrazolo[1,5-a]pyrimidin-3-yl]phenol
- PMP
1-phenyl 3-methyl 5-pyrazolone
- SGP
sheath gas pressure
- SWGP
sweep gas pressure
- VT
vaporizer temperature
- TIC
total ion current
- VMN
ventromedial hypothalamic nucleus
Footnotes
‘Declarations of interest: none’.
Conflict of Interest Statement
The authors declare that they do not have any conflicts of interest.
Publisher's Disclaimer: This is a PDF file of an unedited manuscript that has been accepted for publication. As a service to our customers we are providing this early version of the manuscript. The manuscript will undergo copyediting, typesetting, and review of the resulting proof before it is published in its final form. Please note that during the production process errors may be discovered which could affect the content, and all legal disclaimers that apply to the journal pertain.
References
- 1.Cryer PE, Hypoglycemia-associated autonomic failure in diabetes, Handb. Clin Neurol. 117 (2013) 295–307. [DOI] [PubMed] [Google Scholar]
- 2.Cryer PE, Glycemic goals in diabetes: trade-off between glycemic control and iatrogenic hypoglycemia, Diabetes 63 (2014) 2188–2195. [DOI] [PubMed] [Google Scholar]
- 3.Watts AG, Donovan CM, Sweet talk in the brain: glucosensing, neural networks, and hypoglycemic counterregulation, Front. Neuroendocrinol. 31 (2010) 32–43. [DOI] [PMC free article] [PubMed] [Google Scholar]
- 4.Donovan CM, G Watts A, Peripheral and central glucose sensing in hypoglycemic detection. Physiology 29 (2014) 314–324. [DOI] [PMC free article] [PubMed] [Google Scholar]
- 5.A Borg M, V Tamborlane W, I Shulman G, S Sherwin R, Local lactate perfusion of the ventromedial hypothalamus suppresses hypoglycemic counterregulation, Diabetes 52 (2003) 663–666. [DOI] [PubMed] [Google Scholar]
- 6.Paranjape SA, Briski KP, Recurrent insulin-induced hypoglycemia causes site-specific patterns of habituation or amplification of CNS neuronal genomic activation, Neuroscience 130 (2005) 957–970. [DOI] [PubMed] [Google Scholar]
- 7.Kale AY, Paranjape SA, Briski KP KP, I.c.v. administration of the nonsteroidal glucocorticoid receptor antagonist, CP4–72555, prevents exacerbated hypoglycemia during repeated insulin administration, Neuroscience 140 (2006) 555–565 [DOI] [PubMed] [Google Scholar]
- 8.Stobart JL, Anderson CM, Multifunctional role of astrocytes as gatekeepers of neuronal energy supply, Cell. Neurosci. 7 (2013) 1–21. [DOI] [PMC free article] [PubMed] [Google Scholar]
- 9.Laming PR, Kimelberg H, Robinson S, Salm A, Hawrylak N, Muller C, Roots B, Ng K, Neuronal-glial interactions and behavior, Neurosci. Biobehav. Rev. 24 (2000) 295–340. [DOI] [PubMed] [Google Scholar]
- 10.Suh SW, Bergher JP, Anderson CM, Treadway JL, Fosgerau K, Swanson RA, Astrocyte glycogen sustains neuronal activity during hypoglycemia: studies with the glycogen phosphorylase inhibitor CP-316,819 ([R-R*,S*]-5-chloro-N-[2-hydroxy-3-(methoxymethylamino)-3-oxo-1-(phenylmethyl)-propyl]-1H-indole-2-carboxamide), J. Pharmacol. Exp. Ther. 321 (2007) 45–50. [DOI] [PubMed] [Google Scholar]
- 11.Choi IY, Seaquist ER, Gruetter R, Effect of hypoglycemia on brain glycogen metabolism in vivo, J. Neurosci. Res. 72 (2003) 25–32. [DOI] [PMC free article] [PubMed] [Google Scholar]
- 12.Herzog RI, Chan O, Yu S, Dziura J, McNay EW, Sherwin RS, Effect of acute and recurring hypoglycemia on changes in brain glycogen concentration, Endocrinology (2008) 1499–1504. [DOI] [PMC free article] [PubMed] [Google Scholar]
- 13.Lei H, Gruetter R, Effect of chronic hypoglycemia on glucose concentration and glycogen content in rat brain: a localized 13C NMR study, J. Neurochem. 99 (2006) 260–268. [DOI] [PMC free article] [PubMed] [Google Scholar]
- 14.Roehrig KL, Allred JB, Direct enzymatic procedure for the determination of liver glycogen, Anal. Biochem. 58 (1974) 414–421. [DOI] [PubMed] [Google Scholar]
- 15.Chan TM, Exton JH, A rapid method for the determination of glycogen content and radioactivity in small quantities of tissue or isolated hepatocytes, Anal. Biochem. 71 (1976) 96–105. [DOI] [PubMed] [Google Scholar]
- 16.Jiang Y, Zhao H, Lin Y, Zhu N, Ma Y, Mao L, Colorimetric detection of glucose in rat brain using gold nanoparticlesm, Angewandte Chemie 122 (2010) 4910–4914. [DOI] [PubMed] [Google Scholar]
- 17.Zhang FF, Wan Q, Wang XL, Sun ZD, Zhu ZQ, Xian YZ, Jin LT, Yamamoto K, Amperometric sensor based on ferrocene-doped silica nanoparticles as an electron transfer mediator for the determination of glucose in rat brain coupled to in vivo microdialysis, J. Electroanal. Chem. 571 (2004) 133–138. [Google Scholar]
- 18.Shi G, Lu J, Xu F, Zhou H, Jin L, Jin J, Liquid chromatography-electrochemical detector for the determination of glucose in rat brain combined with in vivo microdialysis, Anal. chimica acta 413 (2000) 131–136. [Google Scholar]
- 19.Zhang W, Cao X, Xie Y, Ai S, Jin L, Jin J, Simultaneous determination of the monoamine neurotransmitters and glucose in rat brain by microdialysis sampling coupled with liquid chromatography-dual electrochemical detector, J. Chromatography B 785 (2003) 327–336. [DOI] [PubMed] [Google Scholar]
- 20.Davis SN, Shavers C, Costa F, Gender-related differences in counterregulatory responses to antecedent hypoglycemia in normal humans, J. Clin. Endocrinol. Metab. 85 (2000) 2148–2157 [DOI] [PubMed] [Google Scholar]
- 21.Nedungadi TP, Goleman WL, Paranjape SA, Kale AY, Briski KP, Effects of estradiol on glycemic and CNS neuronal activational responses to recurrent insulin-induced hypoglycemia in the ovariectomized female rat, Neuroendocrinology 84 (2006) 235–243. [DOI] [PubMed] [Google Scholar]
- 22.Tamrakar P, Briski KP, Estradiol regulates hypothalamic astrocyte adenosine 5’-monophosphate-activated protein kinase activation by hypoglycemia: role of hindbrain catecholamine signaling. Brain Res. Bull. 110 (2015) 47–53. [DOI] [PubMed] [Google Scholar]
- 23.Honda S, Akao E, Suzuki S, Okuda M, Kakehi K, Nakamura J, High-performance liquid chromatography of reducing carbohydrates as strongly ultraviolet-absorbing and electrochemically sensitive 1-phenyl-3-methyl5-pyrazolone derivatives, Anal. Biochem. 180 (1989) 351–357. [DOI] [PubMed] [Google Scholar]
- 24.Bai W, Fang X, Zhao W, Huang S, Zhang H, Qian M, Determination of oligosaccharides and monosaccharides in Hakka rice wine by precolumn derivation high-performance liquid chromatography, J. Food Drug Anal. 23 (2015) 645–651. [DOI] [PMC free article] [PubMed] [Google Scholar]
- 25.Briski KP, Marshall ES, Sylvester PW, Effects of estradiol on glucoprivic transactivation of catecholaminergic neurons in the female rat caudal brainstem, Neuroendocrinology 73 (2001) 369–377. [DOI] [PubMed] [Google Scholar]
- 26.Mahmood ASMH, Uddin MM, Mandal SK, Ibrahim MMH, Alhamami HN, K.P. Briski , Sex differences in forebrain estrogen receptor regulation of hypoglycemic patterns of counter-regulatory hormone secretion and ventromedial hypothalamic nucleus gluco-regulatory neurotransmitter and astrocyte glycogen metabolic enzyme expression, Neuropeptides 72 (2018) 65–74. [DOI] [PMC free article] [PubMed] [Google Scholar]
- 27.Singh SR, Briski KP, Caudal hindbrain glucoprivation enhances GABA release in discrete septopreoptic structures in the steroid-primed ovariectomized rat brain: Role of mu opioid receptors, Neuroendocrinology 80 (2004) 201–209. [DOI] [PubMed] [Google Scholar]
- 28.Shakya M, Shrestha PK, Briski KP, Hindbrain 5’-monophosphate-activated protein kinase mediates short-term food deprivation inhibition of the gonadotropin-releasing hormone-luteinizing hormone axis: role of nitric oxide, Neuroscience 383 (2018) 46–59. [DOI] [PMC free article] [PubMed] [Google Scholar]


