

SUMMARY
Metabolism has been shown to control peripheral immunity, but little is known about its role in central nervous system (CNS) inflammation. Through a combination of proteomic, metabolomic, transcriptomic and perturbation studies, we found that sphingolipid metabolism in astrocytes triggers the interaction of the C2 domain in cytosolic phospholipase A2 (cPLA2) with the CARD domain in mitochondrial antiviral signaling protein (MAVS), boosting NF-κB-driven transcriptional programs that promote CNS inflammation in experimental autoimmune encephalomyelitis (EAE) and potentially multiple sclerosis. cPLA2 recruitment to MAVS also disrupts MAVS-hexokinase 2 (HK2) interactions, decreasing HK enzymatic activity and the production of lactate involved in the metabolic support of neurons. Miglustat, a drug used to treat Gaucher and Niemann–Pick disease, suppresses astrocyte pathogenic activities and ameliorates EAE. Collectively, these findings define a novel immunometabolic mechanism that drives pro-inflammatory astrocyte activities, outline a new role for MAVS in CNS inflammation and identify candidate targets for therapeutic intervention.
BRIEF STATEMENT
By exploring the immunometabolic pathways that drive pro-inflammatory astrocyte activities sphingolipid metabolism is identified as a promising therapeutic target in CNS inflammation
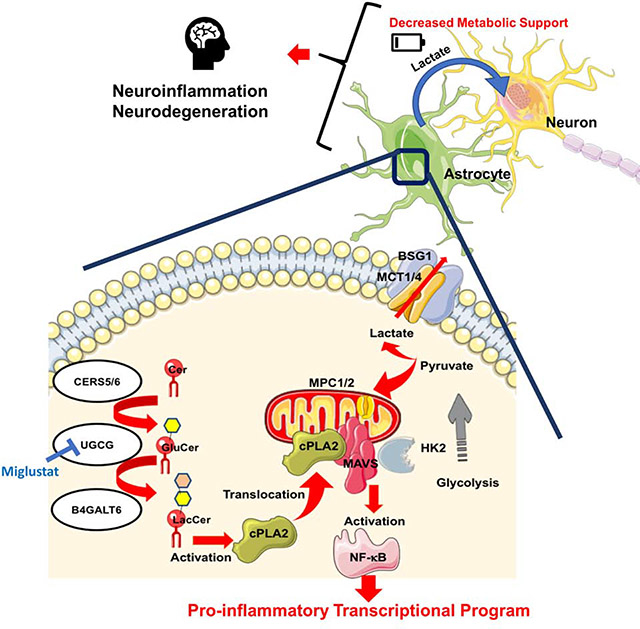
Graphical Abstract
Sphingolipid metabolism induces MAVS activation by cPLA2 in astrocytes, leading to the activation of NF-κB-controlled pro-inflammatory programs and the concomitant suppression of HK2-driven lactate generation to support neuron metabolism. Miglustat, an inhibitor of UGCG, interferes with cPLA2-driven MAVS activation, suppressing pro-inflammatory cytokine production and restoring lactate generation in astrocytes.
INTRODUCTION
The development of the immune response is linked to profound metabolic adaptations that support the energetic and biomolecular needs of immune cells (Buck et al., 2017; Hotamisligil, 2017). Conversely, metabolism generates molecules that act in an autocrine and paracrine manner to modulate inflammation (Cervenka et al., 2017; Serhan, 2014). Indeed, metabolic pathways have been shown to modulate the immune response in autoimmunity, cancer and infections, contributing to disease pathogenesis but also providing targets for therapeutic intervention (Du et al., 2018; Geiger et al., 2016; Kornberg et al., 2018; Mascanfroni et al., 2015; Mills et al., 2018). Most of these studies, however, have been focused on the role of metabolism in the control of peripheral immunity. We recently found that the sphingolipid lactosylceramide (LacCer) promotes inflammation and neurodegeneration in the murine model of multiple sclerosis (MS) experimental autoimmune encephalomyelitis (EAE) (Mayo et al., 2014). However, little is known about the role of sphingolipid metabolism and other metabolic pathways in astrocytes on the control of inflammation and neurodegeneration during MS and EAE.
Astrocytes are CNS resident cells that perform important functions during development and homeostasis, such as axon guidance, synapse formation, and the metabolic support of neurons via the release of lactate (Chung et al., 2013; Molofsky et al., 2014; Pellerin and Magistretti, 1994). Astrocytes can also promote CNS inflammation and neurodegeneration through multiple mechanisms which include neurotoxicity, the modulation of microglial responses and the recruitment of inflammatory cells into the CNS (Liddelow et al., 2017; Mayo et al., 2014; Rothhammer et al., 2016; Wheeler et al., 2019). Accordingly, astrocytes have been associated to the pathogenesis of MS and other neurologic diseases (Liddelow and Barres, 2017; Sofroniew and Vinters, 2010; Wheeler and Quintana, 2018). In particular, astrocytes are considered important contributors to the pathogenesis of secondary progressive MS (SPMS), a disease phase which involves inflammation driven by CNS resident cells and for which limited therapeutic options are available (Baecher-Allan et al., 2018; Thompson et al., 2018b).
Here we describe a novel cPLA2-MAVS interaction that controls metabolic and transcriptional programs in astrocytes, promoting CNS inflammation and interfering with the metabolic support of neurons. These findings define an immunometabolic mechanism that controls astrocyte pathogenic activities and provides novel targets for therapeutic intervention in MS and other neurologic disorders.
RESULTS
The LacCer biosynthetic pathway in astrocytes promotes NOD EAE progression
Following immunization with MOG35–55, non-obese diabetic (NOD) mice develop an acute neurologic attack followed by a progressive form of EAE that resembles several aspects of SPMS, including the progressive and irreversible accumulation of neurologic disability driven by astrocytes (Mayo et al., 2014; Simmons et al., 2013). LacCer produced by the enzyme B4GALT6 promotes astrocyte pathogenic activities thought to contribute to CNS pathology in NOD EAE and MS (Mayo et al., 2014), but little is known about the role of other sphingolipid metabolism enzymes or the mechanisms involved. To address these points we analyzed the expression of members of the LacCer biosynthetic pathway (Figure 1A) during the progressive phase of NOD EAE. Cers3 was not analyzed because of its reported low expression in the CNS (Mullen et al., 2012). We detected increased B4galt6 and Cers6 expression in astrocytes during the progressive phase (Figure 1B). Similarly, we detected increased B4GALT6 and CERS6 expression in CNS MS lesion samples, but not in normal appearing white matter (NAWM) or control samples (Figure 1C). Interestingly, the expression of UGCG and CERS5 is upregulated in MS lesions (Figures 1A,C).
Figure 1: The LacCer biosynthetic pathway in astrocytes promotes NOD EAE progression.

(A) LacCer biosynthetic pathway. (B) Expression of sphingolipid metabolism-related genes in astrocytes during the progressive phase of NOD EAE. (n=5, N=2, unpaired T test to Naive) (C) Expression of sphingolipid metabolism-related genes in MS Lesions (n = 10) and MS NAWM (n = 5), or brain tissue from healthy individuals (n=6). (unpaired T test, compared to all) (D) EAE development in NOD mice treated with lentiviral constructs expressing shRNAs targeting B4galt4, Ugcg, Cers1, Cers2, Cers4, Cers5, Cers6 or control in astrocytes 37 and 44 days after EAE induction. (n=8, N=2, Regression slope T test, compared to shControl) (E-H) CNS samples were harvested 51 days after EAE induction from NOD EAE mice treated with lentivirus-delivered shRNAs as shown in Figure 1. (unpaired T test compared to shControl) (E) number of CNS-infiltrating inflammatory monocytes. (F) Axonal loss and demyelination in spinal cord. (G) Whole genome expression in astrocytes from control and knockdown mice. (n = 3 for each group) (H) mRNA expression determined by qPCR in astrocytes. (I-L) B4galt6, Ugcg, Cers2, Cers5 and Cers6 were knocked down in murine astrocytes in culture, which were activated with TNFα and IFNγ. (unpaired T test compared to shControl). mRNA expression was determined by qPCR in the astrocytes (I). Astrocyte-conditioned medium was tested using in vitro monocyte migration (J) and neurotoxicity assays (K). Alternatively, after washing astrocytes were co-cultured with microglia, and gene expression in microglia was determined by qPCR (L). Migrating monocytes and neuronal death in the shControl-treated group were set as 100%.
To study the role of the LacCer biosynthetic pathway in CNS inflammation, we knocked down B4galt6, Ugcg, Cers5 and Cers6 in astrocytes using lentivirus-driven cell-specific shRNA expression as we have previously done (Figure S1A) (Mayo et al., 2014; Rothhammer et al., 2018; Wheeler et al., 2019). B4galt6 and Ugcg knockdown arrested NOD EAE progression, reducing axonal loss and demyelination (Figures 1D–G). Cers5 and Cers6 knockdown ameliorated EAE to a lower extent, suggesting redundancy in the ability of these enzymes to drive astrocyte pro-inflammatory programs (Figures 1D–G). However, the knockdown of Cers1, Cers2 or Cers4 in astrocytes did not affect EAE progression.
EAE amelioration by the knockdown of B4galt6, Ugcg, Cers5 and Cers6 was linked to increased expression of anti-inflammatory (e.g. Il10, Il27 and Socs2) and neurotrophic factors in astrocytes (Bdnf) (Figures 1G,H), and the decreased expression of pro-inflammatory (Ccl2 and Nos2) factors and inhibitors of axonal growth (e.g. Sema3a and Rgma) (Anderson et al., 2016). Of note, we did not detect changes in the T-cell response (Figure S1B).
Further support for a role of sphingolipid metabolism in the control of astrocyte pathogenic activities was provided by the use of in vitro systems. The knockdown of B4galt6, Ugcg, Cers5 or Cers6 inhibited the recruitment of inflammatory monocytes by astrocyte conditioned medium in a trans-well system and decreased astrocyte neurotoxic activity in vitro, while they reduced the expression of Ccl2 and Nos2 known to contribute to these pathogenic processes in EAE and MS (Figures 1I–K) (Liddelow et al., 2017; Wheeler et al., 2019; Wheeler and Quintana, 2018). In addition, the knockdown of B4galt6, Ugcg, Cers5 and Cers6 interfered with the induction of pro-inflammatory gene expression in microglia in co-culture studies (Figure 1L). Taken together, these data demonstrate that sphingolipid metabolism drives astrocyte activities that promote CNS inflammation and neurodegeneration.
LacCer boosts NF-κB driven inflammation via cPLA2 activation
LacCer is reported to interact with cytosolic phospholipase A2 (cPLA2, encoded by PLA2G4A), a calcium-dependent phospholipase with important roles in health and disease (Leslie, 2015; Nakamura et al., 2013). Indeed, LacCer boosted the enzymatic activity of recombinant cPLA2 in vitro (Figure 2A). Moreover, we detected increased Pla2g4a expression in MS lesion samples and during the progressive phase of NOD EAE (Figure 2B).
Figure 2: LacCer boosts NF-κB driven inflammation via cPLA2 activation.

(A) Effect of LacCer on the enzymatic activity of recombinant human cPLA2 in a cell-free assay. (unpaired T test, compared to control) (B) Pla2g4a expression in astrocytes 51 days after NOD EAE induction, and PLA2G4A expression in CNS samples from MS patients and controls (The same set of samples as Figure 1C. (unpaired T test compared to Naïve or Control) (C) EAE development in NOD mice treated 39 and 47 days after EAE induction with lentiviral constructs expressing control or Pla2g4a targeting shRNAs in astrocytes. (n=7, N=2, Regression slope T test, compared to shControl) (D-G) CNS samples were harvested 51 days after EAE induction from mice treated with lentivirus-delivered shRNAs shown in Figure 2C. (unpaired T test, compared to shControl) (D) Axonal loss and demyelination in spinal cord. (E) the number CNS-infiltrating inflammatory monocytes. (F) mRNA expression in astrocytes determined by qPCR. (G) Whole genome expression in astrocytes from control or Pla2g4a knockdown mice (n=3) (H,I) Astrocyte conditioned medium was prepared for test in in vitro monocyte migration (unpaired T test compared to activated shControl group) (H) and neurotoxicity assays (I). Migrating monocytes and neuronal death in the resting shControl-treated group were set as 100%. (J) Pla2g4a was knocked down in astrocytes, which were then activated, and mRNA expression was determined by qPCR in microglia co-cultured with the astrocytes. (unpaired T test, compared to shControl) (K) The effect of LacCer on cPLA2 enzymatic activity in astrocytes. (unpaired T test, compared to all) (L) mRNA expression determined by qPCR in activated astrocytes in the presence of cPLA2i. (unpaired T test, compared to all) (M) mRNA expression determined by qPCR in human astrocytes activated in the presence of LacCer, cPLA2i or both. (unpaired T test, compared to all) (N) Effect of cPLA2 inhibition on NF-κB activation in astrocytes. The nucleus p65 level is analyzed by western blot. (unpaired T test, compared to all) (O) Effect of cPLA2 inhibition determined by ChIP assay on NF-κB recruitment to responsive elements in Ccl2, Csf2 and Nos2 promoters. (unpaired T test, compared to all)
To evaluate its role in CNS inflammation, we knocked down Pla2g4a in astrocytes during the progressive phase of NOD EAE (Figure S1C). The knockdown of Pla2g4a in astrocytes suppressed NOD EAE progression, decreasing demyelination, axonal loss and the recruitment of inflammatory monocytes to the CNS, but did not affect the T-cell response (Figures 2C–E and S1D). Pla2g4a knockdown decreased the expression of pro-inflammatory molecules during EAE (Figures 2F,G). Moreover, Pla2g4a knockdown suppressed astrocyte functions associated to their disease promoting activities in EAE and MS, such as the recruitment of inflammatory monocytes, neurotoxicity and the activation of microglia in vitro (Figures 2H–J).
LacCer boosts NF-κB activation and NF-κB driven pro-inflammatory gene expression in astrocytes (Mayo et al., 2014). Murine astrocyte activation in vitro with TNFα and IFNγ (TNFα/IFNγ) increased cPLA2 activity, which was further upregulated by LacCer (Figure 2K). cPLA2 inhibition abrogated the boost in the expression of pro-inflammatory genes, and also in its own expression, induced by LacCer in activated murine and human astrocytes (Figures 2L,M).
In agreement with a role for cPLA2 in the control of NF-κB driven pro-inflammatory transcriptional programs in astrocytes, cPLA2 inhibition reduced the nuclear translocation of NF-κB and its recruitment to the promoters of Ccl2, Csf2 and Nos2, genes associated to monocyte recruitment, neurotoxicity and microglia activation (Liddelow et al., 2017; Wheeler and Quintana, 2018) (Figures 2N,O). Thus, LacCer-cPLA2 signaling drives NF-κB dependent pro-inflammatory transcriptional programs in astrocytes.
LacCer-induced cPLA2-MAVS signaling drives proinflammatory transcriptional programs
cPLA2 is recruited to mitochondria following activation (Zhu et al., 2006). The mitochondrial antiviral signaling protein (MAVS) promotes NF-κB activation in the context of viral infections (Seth et al., 2005). Based on the recruitment of activated cPLA2 to mitochondria and the role of MAVS in NF-κB activation, we hypothesized that LacCer-activated cPLA2 promotes NF-κB activation in astrocytes via MAVS.
Infection-triggered protein-protein interactions induce MAVS oligomerization and downstream signaling leading to NF-κB activation (Galluzzi et al., 2012); reactive oxidative species (ROS) were also recently reported to activate MAVS (Buskiewicz et al., 2016). In vitro treatment of murine astrocytes with LacCer induced MAVS oligomerization and increased ROS levels (Figures 3A,B and S2A). cPLA2 pharmacological inhibition suppressed ROS production, but had a milder effect in decreasing MAVS oligomerization (Figures 3A,B and S2A). Of note, the product of cPLA2 enzymatic activity arachidonic acid (AA) did not induce MAVS aggregation (Figure S2A). In support for a role of cPLA2 in MAVS activation, cPLA2 and MAVS co-localized in mitochondria following astrocyte treatment with LacCer in vitro (Figure 3C), and co-localized in astrocytes during the progressive phase of NOD EAE (Figures S2B,C). Indeed, we detected a physical interaction between cPLA2 and MAVS in co-precipitation studies performed in primary astrocytes activated in the presence of LacCer (Figure 3D). Collectively, these findings suggest that MAVS is activated by its interaction with cPLA2.
Figure 3: LacCer-induced cPLA2-MAVS signaling drives NF-κB dependent pro-inflammatory programs.

(A) Effect of LacCer and cPLA2 inhibition on MAVS oligomerization, analyzed by SDD-AGE and western blot. (unpaired T test, compared to all, intensity normalized to vehicle Naïve condition) (B) ROS levels in activated murine and data are shown relative to ROS levels in resting astrocytes. (unpaired T test, compared to all) (C) LacCer induces cPLA2 recruitment to mitochondria and co-localization with MAVS. Astrocytes were treated with 10 μM LacCer or vehicle for 4 hours then stained and analyzed by confocal microscopy. Bar plots depict the ratio of total cPLA2 co-localization with mitochondria, the ratio of total MAVS co-localization with mitochondria, and the ratio of cPLA2-MAVS co-localization in mitochondria. (n≥25 cells per group, unpaired T test, compared to vehicle) (D) MAVS-cPLA2 interaction in astrocyte is analyzed by CoIP assay with MAVS-specific antibody and western blot. (unpaired T test, compared to all, intensity normalized to vehicle naive condition) (E,F) Domain binding analysis for cPLA2-MAVS interaction. Full-length human cPLA2 together with flag-tagged human MAVS (Full length, W56A mutant, G67A/W68A/V69A mutant (AAA), M2–6L mutant or M2 isoform) (E); or human cPLA2 (full-length, phospholipid binding domain deficient or C2 domain deficient) together with full-length flag-tagged human MAVS (F) were co-expressed in HEK293 cells, protein complexes were pulled down with anti-Flag antibodies and analyzed by western blot. (G) The effect of cPLA2 overexpression in trigger MAVS oligomerization. cPLA2 (full-length and C2 domain only) and MAVS were co-expressed in HEK293 cells, mitochondria were isolated 24 hours later and analyzed by SDD-AGE and western blot. (H) The effect of cPLA2 overexpression in triggering MAVS-mediated NF-κB activation, analyzed by luciferase assay. (unpaired T test, compared to all) (I) Effect of MAVS on NF-κB activation in WT and Mavs knockout astrocytes. The level of nucleus p65 level is analyzed by western blot. (unpaired T test, compared to corresponding condition between WT and MAVS−/− astrocytes) (J) mRNA expression determined by qPCR in activated WT and MAVS−/− astrocytes. (unpaired T test, compared to corresponding condition between WT and MAVS−/− astrocytes) (K) Recruitment of NF-κB to Ccl2, Csf2 and Nos2 promoters in murine WT and MAVS−/− astrocytes in culture determined by ChIP assay as in Figure 2O. (unpaired T test, compared to all) (L) EAE development in NOD mice treated with lentiviral constructs expressing shRNAs targeting Mavs or control in astrocytes 37 and 43 days after EAE induction. (n≥7, N=3, Regression slope T test, compared to shControl). (M,N) CNS samples were harvested 50 days after EAE induction from mice treated with lentivirus-delivered shRNAs shown in Figure 3L. (unpaired T test, compared to shControl) (M) The number of CNS-infiltrating inflammatory monocytes. (N) Inflammatory genes expression in astrocytes from control and Mavs knockdown mice was detected by nCounter analysis system (n=4). (O, P) Astrocyte-conditioned medium was prepared from activated WT or MAVS−/− astrocytes for test in in vitro monocyte migration. (O, unpaired T test, compared to all) and neurotoxicity assays (P, unpaired T test, compared to all). Migrating monocytes and neuronal death in the resting shControl-treated group were set as 100%.
MAVS CARD domain mediates protein interactions involved in MAVS activation in response to viruses (Seth et al., 2005); the W56A and G67A/W68A/V69A (AAA) mutations in the CARD domain interfere with MAVS oligomerization and signaling (Xu et al., 2014). To further characterize the cPLA2-MAVS interaction, we used an overexpression system in HEK293 cells. We found that the cPLA2-MAVS interaction was abrogated by deletion of the CARD domain and the W56A mutation but not by the AAA mutation (Figure 3E).
N-terminally truncated isoforms of MAVS are generated under physiologic conditions as a result of the initiation of protein translation not only from the N-terminal methionine, but also from other methionine residues in the protein (Qi et al., 2017). Since the CARD domain is located at MAVS N-terminus, we tested the interaction of cPLA2 with a stabilized MAVS mutant (M2–6L MAVS) in which the first methionine start codon is preserved, but other methionine residues have been replaced by leucine (M142L, M303L, M358L, M367L, M449L) (Figure 3E). This M2–6L MAVS mutant only drives the expression of a full-length MAVS isoform, preserving the CARD domain. In support for a role of the CARD domain in mediating physical interactions with cPLA2, the M2–6L MAVS mutant showed increased binding with cPLA2 than WT MAVS (Figure 3E).
The C2 domain of cPLA2 binds phospholipids in a Ca2+-dependent manner (Leslie, 2015) (Figure 3F). The C2 domain also binds LacCer in a Ca2+-independent manner through electrostatic interactions (Nakamura et al., 2013). The deletion of the entire phospholipid biding domain or the C2 domain (dPL or dC2 constructs, respectively) suppressed the cPLA2-MAVS interaction (Figure 3F). However, the co-precipitation of cPLA2 with MAVS was not abrogated by cPLA2 mutations that impair Ca2+ (D43N), phospholipid or membrane binding (S111P, I399A/L400A/L552A, R485H), catalytic activity (R485H, D549A) or phosphorylation (S505A, S505E) (Casas et al., 2006; Das et al., 2003; Dessen et al., 1999; Reed et al., 2011) (Figures S2D–F). Of note, the S111P, I399A/L400A/L552A and R485H mutations did not interfere with LacCer binding to cPLA2 (Figure S2G), nor with the ability of cPLA2 to induce MAVS oligomerization (Figure S2H). Taken together, these findings suggest that the cPLA2-MAVS interaction is not directly controlled by Ca2+ or cPLA2 enzymatic activity. Indeed, we found that the C2 domain alone, which lacks enzymatic activity, can interact with MAVS (Figure S2E). Moreover, C2 domain overexpression triggered MAVS oligomerization and NF-κB activation (Figures 3G,H). Collectively, these findings show that the C2 and the CARD domains in cPLA2 and MAVS, respectively, mediate physical interactions leading to MAVS activation.
MAVS signaling promotes NF-κB activation (Galluzzi et al., 2012). Our finding of cPLA2 C2 domain-triggered MAVS signaling (Figures 3G,H) led us to study the role of cPLA2-MAVS in the control of NF-κB activation by LacCer in astrocytes. MAVS deficiency abrogated the LacCer-induced boost in NF-κB nuclear translocation, the recruitment of NF-κB to its target genes and the expression of Nos2, Ccl2 and Csf2 in astrocytes in culture (Figures 3I–K).
We then used lentivirus-delivered shRNAs to investigate the role of MAVS in astrocytes during NOD EAE progressive phase. Mavs knockdown arrested NOD EAE progression and reduced the accumulation of pro-inflammatory monocytes in the CNS; no effects of Mavs knockdown were detected on the T-cell response (Figures 3L,M and S1E,F). The transcriptional analysis of astrocytes in NOD EAE mice following Mavs knock down revealed decreased expression of NF-κB driven pro-inflammatory genes linked to astrocyte pathogenic activities, such as Ccl2 involved in the recruitment of pro-inflammatory monocytes (Figures 3N and S3). In addition, Mavs knockdown in astrocytes also increased the expression of Il33, recently reported to ameliorate EAE (Figure 3N) (Russi et al., 2018). In agreement with these in vivo findings, MAVS-deficient astrocytes showed decreased ability to recruit monocytes in chemotactic assays, as well as reduced neurotoxic activity in vitro (Figures 3O,P).
To evaluate the clinical relevance of cPLA2-MAVS signaling in astrocytes, we analyzed healthy control and MS brain samples by immunofluorescence. We detected co-localization of cPLA2 and the mitochondria marker Tom20 in GFAP+ astrocytes located in MS lesions and adjacent NAWM, but not in those located in NAWM distant from lesions (Figure 4A). Moreover, we detected cPLA2-MAVS co-localization in GFAP+ astrocytes located in NAWM near lesions, and occasionally within lesions (Figure 4B,C). In summary, these data suggest that sphingolipid metabolism activates NF-κB via a cPLA2-MAVS signaling axis that promotes astrocyte pathogenic activities in EAE and MS.
Figure 4: cPLA2-MAVS co-localize in astrocytes in MS.

(A) Immunostaining analysis of the co-localization (white arrowheads) of cPLA2 and mitochondria marker Tom20 in GFAP+ astrocytes in MS tissue. GFAP+ astrocytes in lesion, NAWM near lesion (20–50 μm from lesion) and NAWM far from lesion (>500 μm) (B) Immunostaining analysis of the co-localization (white arrowheads) of cPLA2 and MAVS in MS or HC tissue GFAP+ astrocytes. (C) Quantification of cPLA2+MAVS+ co-localization signal in GFAP+ and GFAP− fields. (n = 30–54 cells per condition, unpaired T test, compared to all) HC = healthy control, WM = white matter, GM = gray matter, NAWM = normally appearing white matter, NAGM = normally appearing gray matter.
cPLA2-MAVS signaling modulates astrocyte metabolism
Lactate produced by the metabolism of glucose is released by astrocytes to support the metabolic needs of neurons (Machler et al., 2016; Pellerin and Magistretti, 1994) (Figure 5A). Pro-inflammatory stimuli affect astrocyte metabolism (Motori et al., 2013) and cPLA2 is reported to control the metabolism of platelets (Slatter et al., 2016). Thus, we analyzed the role of LacCer-cPLA2 signaling on astrocyte metabolism. The activation of murine astrocytes in culture with TNFα/IFNγ decreased lactate release (Figure 5B); this decrease was prevented by an inhibitor of cPLA2 activation.
Figure 5: cPLA2-MAVS signaling modulates astrocyte metabolism.

(A) Level change of glucose metabolism in activated astrocytes measured by metabolomic profiling. Green color indicates metabolites decreased by cPLA2i treatment, red color indicates increased metabolites, black color indicates metabolites for which no data were collected. (B, C) Effect of cPLA2 (cPLA2i) or MPCs (UK-5099) inhibition in astrocyte on lactate release (B, unpaired T test, compared to activated vehicle condition, normalized to naive vehicle condition) and pyruvate level in mitochondria (C, unpaired T test, compared to activated vehicle condition, normalized to naive vehicle condition). (D,E) Metabolomic profiling analysis of activated astrocytes in the presence of cPLA2i. (D) Effect of cPLA2 inhibition on saturated and unsaturated fatty acids level in activated astrocyte, shown relative to their levels on resting astrocytes. Each dot indicates a different fatty acid. (unpaired T test, compared to activated vehicle condition) (E) Metabolite categories altered by cPLA2i treatment. (F) Effect of methylglyoxal supply on lactate release by activated astrocytes. (unpaired T test, compared to activated control condition) (G) Effect of cPLA2 or MPCs inhibition in mitochondrial function of astrocyte analyzed by Mito Stress test assay. (unpaired T test, compared to all) (H,I) Effect of gene targeted siRNA knockdown in mitochondrial function of LacCer loaded astrocytes analyzed by Mito Stress test assay (H, unpaired T test, compared to all) and lactate release by astrocytes (I, unpaired T test, compared to naive siControl condition). (J) Effect of LacCer loading or cytokines stimulation on the interaction of MAVS with HK2 and cPLA2 in astrocyte, evaluated by pull-down assay and western blot. (K) Mitochondrial HK enzymatic activity in activated astrocytes. (unpaired T test, compared to vehicle condition) (L) MAVS binding domain analysis. Flag-tagged human MAVS (Full length, M2–6L, M2, AAA or W56A) was over-expressed in HEK293 cell and 24 hours later MAVS protein complexes were pulled down and analyzed by western blot. (M) Human cPLA2 (cPLA2-GFP or C2 domain-GFP respectively) were over-expressed in HEK293 cell and 24 hours later MAVS protein complexes were pulled down and analyzed by western blot. (N) Effect of cPLA2 or cPLA2 C2 domain overexpression in HEK293 cells on mitochondrial HK enzymatic activity, lactate release and mitochondrial pyruvate levels. (unpaired T test, compared to Control condition) (O) Effect of 2-DG treatment on lactate release and mitochondrial levels of pyruvate in astrocyte. (unpaired T test) (P) Lactate release by Bsg knockdown or control astrocytes. (unpaired T test) (Q) EAE development in C57BL/6 or NOD mice that received lentiviral constructs to knockdown Bsg in astrocytes at the time points indicated by the arrows. (n≥7, N = 2, Regression slope T test). (R) Axonal loss and demyelination in spinal cords from NOD EAE mice. (unpaired T test)
Glucose is metabolized via glycolysis into pyruvate, which can be either converted into lactate and then released to support neuron metabolism, or imported into the mitochondria through mitochondrial pyruvate carriers (MPCs) to fuel cellular respiration (Bouzier-Sore and Pellerin, 2013) (Figure 5A). Resting astrocytes rely on alternative sources to fuel the mitochondrial tricarboxylic cycle, maximizing lactate production (Weber and Barros, 2015). MPC inhibition with UK-5099 abrogated the decrease in lactate release triggered by TNFα/IFNγ (Figure 5B). In addition, cPLA2 and MPC inhibition abrogated the increase in mitochondrial pyruvate content induced by TNFα/IFNγ (Figure 5C). These findings suggest that inflammatory stimuli boost the mitochondrial oxidation of pyruvate through a cPLA2-dependent mechanism, decreasing the production of lactate and, consequently, the metabolic support of neurons.
To further investigate the effects on astrocyte metabolism of LacCer-cPLA2 signaling we performed unbiased metabolomic analyses. cPLA2 inhibition suppressed the accumulation of saturated fatty acids reported to support astrocyte pro-inflammatory activities (Gupta et al., 2012), and increased the cellular levels of methylglyoxal, which can be used as a substrate for lactate production (Allaman et al., 2015) (Figures 5A,D,E and S4A–C). Indeed, supplementation with exogenous methylglyoxal reverted the decrease in astrocyte lactate release triggered by TNFα/IFNγ activation (Figure 5F). Thus, cPLA2 controls additional metabolic pathways involved in lactate production.
Based on the mitochondrial recruitment of cPLA2 and its interaction with MAVS, we studied the roles of cPLA2 and MAVS in mitochondrial function. Astrocyte activation by TNFα/IFNγ increased maximal mitochondrial respiration and mitochondrial ATP production; this increase was inhibited by cPLA2 or MCP inhibition, and also by MAVS deficiency (Figures 5G and S4D). Moreover, MAVS deficiency suppressed the increase in mitochondrial pyruvate levels, and the concomitant decrease in lactate released by astrocytes triggered by TNFα/IFNγ (Figures S4E,F). In addition, LacCer treatment enhanced mitochondrial function in astrocytes as indicated by an increase in maximal mitochondrial respiration and mitochondrial ATP production (Figure 5H); the knockdown of cPLA2 or MAVS by siRNA abrogated this enhancement. Lactate release was decreased in LacCer-treated astrocytes in a cPLA2- and MAVS-dependent manner as revealed in knockdown experiments (Figure 5I and S1G). Of note, this effect of LacCer on lactate release by astrocytes was not mediated by IRF1 or RelA (Figure 5I). Collectively, these findings suggest that pro-inflammatory stimuli induce LacCer-driven changes in astrocyte metabolism via cPLA2-MAVS, which increase the mitochondrial oxidation of pyruvate at the expense of decreased lactate generation and release.
Hexokinase 2 (HK2) drives glycolysis, promoting the degradation of glucose to lactate at the expense of decreased mitochondrial oxidation of pyruvate (Mathupala et al., 2009; Wolf et al., 2011). MAVS was recently shown to interact with HK2, increasing HK2 enzymatic activity, and consequently increasing glycolysis and lactate production (Zhang et al., 2019). Indeed, we detected the co-localization of MAVS and HK2 in mouse astrocytes in culture (Figure S4H). Interestingly, MAVS activation by microbial stimuli is reported to disrupt the MAVS-HK2 interaction, resulting in decreased HK2 activity and lactate production (Zhang et al., 2019). Thus, we investigated the effect of inflammation-driven cPLA2-MAVS signaling on MAVS interaction with HK2.
In co-precipitation studies we found that MAVS interacts with HK2 in resting astrocytes (Figure 5J), suggesting that cPLA2 may compete with HK2 for its interaction with MAVS. Indeed, the activation of cPLA2 in primary astrocytes or its overexpression in HEK293 cells led to the displacement of HK2 from its interaction with MAVS, concomitant with a decrease in HK enzymatic activity and the formation of cPLA2-MAVS interactions (Figures 5J,K). In co-precipitation studies using MAVS mutants we determined that the HK2-MAVS interaction involves MAVS CARD domain (Figure 5L), the same region involved in cPLA2-MAVS interaction (Figure 3E), suggesting that the cPLA2 C2 domain may displace HK2 from its interaction with MAVS. Indeed, overexpression of cPLA2 or its C2 domain disrupted the HK2-MAVS interaction (Figure 5M), resulting in decreased HK activity and lactate secretion, concomitant with increased mitochondrial pyruvate levels (Figure 5N). Moreover, the inhibition of HK enzymatic activity with 2-deoxy-D-glucose (2-DG), or the knockdown of HK2 expression with siRNA (Figures S1H,J), resembled the effects of cPLA2-MAVS activation, decreasing astrocyte lactate release while increasing mitochondrial pyruvate (Figures 5O and S4I).
To evaluate the relevance for CNS pathology of the LacCer-driven decrease in astrocyte lactate release mediated by cPLA2-MAVS signaling, we knocked down the expression of basigin (encoded by Bsg) (Figure S1H,I), which controls the plasma membrane localization and activity of the monocarboxylate transporters (MCTs) that export lactate to the extracellular space (Perez-Escuredo et al., 2016). The knockdown of Bsg in astrocytes in vitro decreased lactate, in agreement with the reported role of MCTs in this process (Figure 5P). Bsg knockdown in astrocytes in vivo impaired EAE recovery in both B6 and NOD mice and increased axonal loss and demyelination (Figures 5Q,R and S1D), suggesting that the reduced lactate release triggered by cPLA2-MAVS signaling in astrocytes contributes to CNS pathology. Taken together, these findings suggest that LacCer-driven cPLA2-MAVS signaling controls astrocyte metabolism and its ability to support neurons during CNS inflammation.
Miglustat ameliorates chronic progressive NOD EAE
Miglustat, a drug approved for the treatment of Type I Gaucher disease and Niemann-Pick disease type C (Venier and Igdoura, 2012), inhibits the synthesis of glucosylceramide (GlcCer) used by B4GALT6 to synthesize LacCer (Figure 1A). Miglustat has significant effects within the CNS (Jeyakumar et al., 2005; Platt et al., 1997; Venier and Igdoura, 2012). Based on its ability to limit B4GALT6 substrate availability and LacCer synthesis, we hypothesized that Miglustat may arrest astrocyte activities that promote CNS pathology.
To investigate the potential of Miglustat for the therapeutic modulation of astrocyte function, we evaluated the effects of Miglustat on the progressive phase of NOD EAE. Miglustat administration by gavage (600 mg/kg) resulted in its accumulation in the CNS (Figure 6A), and suppressed NOD EAE progression as indicated by a reduction in clinical scores, axonal loss, demyelination and the recruitment of pro-inflammatory monocytes to the CNS (Figures 6B–E and S1I). Miglustat administration concomitant with Mavs knockdown in astrocytes did not show additional therapeutic effects on NOD EAE (Figure S5A), suggesting that Miglustat therapeutic effects involve the suppression of cPLA2-MAVS signaling in astrocytes. Indeed, the amelioration of NOD EAE by Miglustat was linked to the decreased expression in astrocytes of pro-inflammatory genes and Pla2g4 (cPLA2) (Figure 6D).
Figure 6. Miglustat ameliorates chronic progressive NOD EAE.

(A) Miglustat levels in the CNS after oral administration of 600 mg/kg Miglustat. (unpaired T test) (B) EAE development in NOD mice treated with Miglustat (600 mg/kg administered orally before initiation of progressive phase, n≥6, N=3, Regression slope T test). (C-G) CNS samples were harvested 41 days after EAE induction from mice treated with Miglustat or vehicle as shown in Figure 6b. The number of CNS-infiltrating inflammatory monocytes (C, unpaired T test). Whole genome expression in astrocytes isolated from Miglustat treated NOD EAE mice (D; n = 6). Axonal loss and demyelination in spinal cord (E, unpaired T test). Immunoflourescence analysis of C3+GFAP+ astrocytes. Bar plots depict the number of C3+GFAP+ astrocyte within the observation field (F, unpaired T test, compared to EAE condition). Immunofluorescence analysis of NF-κB activation among MAVS+cPLA2+GFAP+ astrocytes (G, unpaired T test, compared to EAE condition). Bar plots depict the number of MAVS+cPLA2+acetyl-p65+GFAP+ astrocyte within the observation field. (H) mRNA expression determined by qPCR in activated human and mouse astrocytes in the presence of Miglustat. Data are shown relative to resting astrocytes. (unpaired T test) (I) Human and mouse astrocyte conditioned medium were analyzed using in vitro monocyte migration and neurotoxicity assays. Migrating monocytes and neuronal death in the resting vehicle-treated group were set as 100%. (unpaired T test) (J) mRNA expression in polarized microglia was determined by qPCR. Microglia was co-cultured with activated astrocytes. (unpaired T test) (K) Lactate release from activated astrocytes in the presence of Miglustat. (unpaired T test, compared to activated vehicle condition) (L) Effect of Miglustat treatment on cPLA2 enzymatic activity in astrocytes, evaluated by cPLA2 activity assay. (unpaired T test, compared to all)
A population of neurotoxic astrocytes expressing complement C3 induced by TNFα, IL-1α and C1q has been recently identified in multiple neurologic diseases (Liddelow et al., 2017); NF-κB is thought to drive the transcriptional program of these and other astrocyte populations that promote CNS pathology (Liddelow and Barres, 2017). By immunochemistry staining of CNS samples taken during NOD EAE progressive phase, we detected cPLA2 and MAVS co-localization in 9.1% of C3+GFAP+ and in 33.1% of C3−GFAP+ astrocytes, respectively (Figure S5B). Miglustat treatment decreased the number of C3+GFAP+ astrocytes, and also of astrocytes depicting cPLA2 and MAVS co-localization concomitant with NF-κB activation (termed cPLA2+MAVS+p65+GFAP+ astrocytes (Figures 6F,G).
In support of a direct inhibitory effect on astrocyte activities thought to contribute to EAE and MS pathogenesis, Miglustat suppressed the expression of Pla2g4 and pro-inflammatory genes in murine and human astrocytes activated in vitro (Figure 6H), reducing astrocyte neurotoxic activity, as well as their ability to recruit monocytes in chemotaxis assays and activate microglia (Figures 6I,J). Miglustat also abrogated the decrease in lactate release and the increase in cPLA2 enzymatic activity induced by astrocyte activation with TNFα/IFNγ (Figures 6K,L). Conversely, LacCer boosted the expression of genes associated to neurotoxic GFAP+C3+ astrocytes induced in vitro by activation with TNFα, IL-1α and C1q (Figure S5C). Taken together, these findings suggest that cPLA2-MAVS signaling is associated not only to C3+GFAP+ neurotoxic astrocytes, but also to other disease-promoting astrocyte populations. Moreover, these findings identify Miglustat as a candidate for the therapeutic manipulation of cPLA2-MAVS signaling.
DISCUSSION
The cross-talk between immune and metabolic pathways has been identified as an important contributor to the pathogenesis of neurologic diseases which are not usually considered metabolic disorders. Indeed, it was recently reported that TREM2 controls the metabolic status and pathogenic activities of microglia in Alzheimer’s disease (Ulland et al., 2017). Here we describe a novel cPLA2-MAVS signaling axis activated by products of sphingolipid metabolism that controls pro-inflammatory and metabolic programs in astrocytes through the regulation of NF-κB and HK2 activity, respectively.
Abnormalities in sphingolipid metabolism have been described in MS (Cumings and Goodwin, 1968; Vidaurre et al., 2014; Wheeler et al., 2008). In addition, antibodies to sphingolipids are detected in SPMS patients and correlate with markers of disease progression such as brain atrophy, a feature of MS thought to be driven by CNS-resident cells such as astrocytes and microglia (Bakshi et al., 2016; Farez et al., 2009; Kanter et al., 2006). Indeed, sphingolipid metabolism and its products promote inflammation through multiple mechanisms (Maceyka and Spiegel, 2014). CerS2 and CerS6, for example, drive neutrophil pro-inflammatory activities in EAE (Barthelmes et al., 2015; Eberle et al., 2015). Moreover, the sphingolipid metabolite sphingosine-1-phosphate controls the T-cell response and is a therapeutic target in MS (Blaho et al., 2015; Liu et al., 2010; Mandala et al., 2002; Matloubian et al., 2004; Pappu et al., 2007). Our findings identify sphingolipid metabolism as a driver of astrocyte pathogenic activities, and also as a potential target to limit the CNS-restricted inflammatory response thought to drive disease pathogenesis in SPMS (Baecher-Allan et al., 2018; Thompson et al., 2018a). Hence, Miglustat and other drugs developed to modulate sphingolipid metabolism in lysosomal storage disorders (Platt, 2014) constitute candidate agents to be repurposed for SPMS treatment.
MAVS plays a central role in the immune response to viral infections (Galluzzi et al., 2012; Seth et al., 2005). Our work identifies a novel mechanism by which increased cPLA2 activation by sphingolipid metabolism activates MAVS in astrocytes. We found that cPLA2 interacts with MAVS to trigger its oligomerization and downstream signaling; this cPLA2-MAVS interaction is independent of cPLA2 enzymatic activity. However, the activation of cPLA2 enzymatic activity by LacCer increases cPLA2 expression, increasing the intracellular levels of cPLA2 available to interact and activate MAVS. In addition, cPLA2 enzymatic activity increases the levels of ROS, which can also promote MAVS activation (Buskiewicz et al., 2016). MAVS signaling promotes the expression of NF-κB driven transcriptional programs associated to astrocyte pathogenic activities in EAE and MS; NF-κB activation can be further amplified by cPLA2 via MAVS-independent mechanisms (Morgan and Liu, 2011). Considering the deleterious effects of viral infections reported to contribute to MS onset and pathogenesis (Ascherio et al., 2012), our findings suggest that the activation of MAVS in astrocytes by CNS-targeting viruses contributes to MS pathology. Together with recent reports on the regulation of astrocytes and microglia by metabolites produced by commensal bacteria (Erny et al., 2015; Rothhammer et al., 2018; Rothhammer et al., 2016; Sampson et al., 2016), these findings suggest that complex interactions between commensal microorganisms, pathogens and their metabolites modulate pro-inflammatory activities in CNS-resident cells. Moreover, since sphingolipid metabolism and cPLA2 have been linked to multiple neurologic disorders in which astrocytes contribute to disease pathogenesis (Maceyka and Spiegel, 2014; Platt, 2014; Sanchez-Mejia et al., 2008; Stephenson et al., 1999), cPLA2-MAVS signaling may be a common driver of astrocyte pathogenic activities, synergizing with signaling pathways associated to specific astrocyte populations and neurologic disorders to amplify CNS pathology (Liddelow and Barres, 2017; Liddelow et al., 2017).
We found that cPLA2-MAVS signaling controls astrocyte metabolism and lactate release involved in the metabolic support of neurons. These metabolic effects of cPLA2-MAVS signaling involved the displacement of HK2 from its interaction with MAVS, resulting in decreased HK2 activity, glycolysis and lactate generation, concomitant with the reduced mitochondrial oxidation of pyruvate. Lactate released by astrocytes limits neuronal death under stress (Choi et al., 2012). In addition, lactate has been recently shown to act as a natural suppressor of MAVS activation (Zhang et al., 2019). Thus, the decreased release of lactate may synergize with neurotoxic activities of astrocytes and microglia to amplify inflammation and neurodegeneration. Collectively, these findings identify a mechanism by which sphingolipid metabolism and glycolysis converge in MAVS signaling to control astrocyte responses relevant to the pathogenesis of MS and, potentially, other neurologic diseases. These metabolic processes may provide novel targets for the therapeutic modulation of MAVS signaling.
In summary, we identified a novel cPLA2-MAVS signaling pathway that controls the transcriptional and metabolic response of astrocytes in the context of inflammation. These findings define mechanisms of disease pathogenesis and may guide novel therapeutic approaches for the modulation of astrocyte pathogenic activities in neurologic disorders.
STAR METHODS
LEAD CONTACT AND MATERIALS AVAILABILITY
Further information and requests for resources and reagents should be directed to and will be fulfilled by the Lead Contact, Francisco J. Quintana (fquintana@bwh.harvard.edu). All plasmids generated in this study are available from the Lead Contact with a completed Materials Transfer Agreement.
Experimental Model and Subject Details
Animals
Experimental animals were kept in a specific pathogen-free facility at the Hale Building for Transformative Medicine at Brigham and Women’s Hospital, fed ad libitum on a 14/10-hour light/dark cycle and checked daily by veterinary staff, and all in vivo experiments were carried out in accordance with the Institutional Animal Care and Use Committee (IACUC) guidelines reviewed and approved under the IACUC guidelines at Brigham and Women’s Hospital. Adult C57BL/6J (#000664, The Jackson Laboratory), NOD/ShiLtJ (#001976, The Jackson Laboratory) and Mavstm1Zjc (#008634, The Jackson Laboratory) mice were obtained from the Jackson Laboratory and all mice were at least doubly housed. 8–10 week-old mice were used for EAE induction and EAE mice at progressive phase were used for stereotactic injection. C57BL/6J and Mavstm1Zjc postnatal pups were breed in facility and both male and female pups were sacrificed between P0-P3 for harvesting and culturing astrocytes and sex ratio of litters was assumed to be balanced and confirmation experiment was not performed.
MS tissues
Human brain tissue for qPCR assay was obtained from 13 donors with clinically diagnosed and neuropathologically confirmed MS and non-MS, used and reported for the first time in the published research and the sex of donors was not disclosed (Alvarez et al., 2011). Autopsy samples were immediately frozen in liquid nitrogen. White matter MS tissue samples were selected on the basis of post-mortem MRI and lesions were classified according to revised 2010 McDonald’s criteria (Polman et al., 2011). non-MS controls were selected from three cases without neurological disease. Control tissues were taken from the subcortical white matter, corpus callosum and cortex. All patients and controls, or their next of kin, had given informed consent for autopsy and use of their brain tissue for research purposes. Ethical approval was given before autopsy (CHUM ethical approval: SL05.022 and SL05.023 and BH07.001). Paraffin-embedded brain sections for immunofluorescent staining was obtained from patients diagnosed with clinical and neuropathological MS diagnosis according to the revised 2010 McDonald’s criteria (Polman et al., 2011). Tissue samples were collected from healthy donors (3 male and 1 female) and MS patients (1 male and 3 female) with full ethical approval (BH07.001) and informed consent as approved by the local ethics committee. Autopsy samples were preserved and lesions classified using Luxol Fast Blue/Haematoxylin & Eosin staining as described (Kuhlmann et al., 2017; Podjaski et al., 2015).
Human primary astrocytes
Human fetal astrocytes and were isolated from human CNS tissue (cerebral hemispheres) from fetuses at 17–23 weeks of gestation obtained from the Laboratory of Developmental Biology (Eunice Kennedy Shriver National Institute of Child Health and Human Development, project number: 5R24HD000836) following Canadian Institutes of Health Research–approved guidelines. The sex of used human astrocyte is unidentified. astrocyte cultures were obtained by dissociation of the fetal CNS with 0.05% trypsin (#25200–072, Thermo Fisher Scientific) and 50 μg/ml DNase I (#10104159001, Roche) followed by mechanical dissociation. After washing, the cell suspension was plated at a concentration of 3–5X 10⁶ cells/ml on poly-l-lysine (#P4707, Sigma-Aldrich) precoated 75 cm2 flasks in DMEM supplemented with 10% FCS (#SH3007303, Fisher Scientific) and penicillin/streptomycin. To obtain pure astrocytes, the mixed CNS cell culture (containing astrocyte, microglia and neuron) was passaged upon confluency, starting at 2 weeks post-isolation, using 0.25% trypsin-EDTA (#25200–072, Thermo Fisher Scientific). Human fetal astrocytes were used between passages 2 and 4 and cultures, which corresponds to a time frame of 2 weeks to 3 months postisolation, and the purity, which is >90%, was determined by immunostaining using anti-glial fibrillary acidic protein (GFAP) rabbit mAb (#05269784001, Roche, 1:100) followed by goat anti-rabbit IgG conjugated with Texas Red (#T-2767, Thermo Fisher Scientific, 1:100).
EAE induction and treatment
EAE was induced in 8–10 week old female mice by subcutaneous immunization with 150 μg MOG35–55 peptide (#110582, Genemed Synthesis) emulsified in 200 μL of complete Freund’s adjuvant per mouse, followed by administration of 100 μL PBS containing 200 ng pertussis toxin (#180, List biological Laboratories) on days 0 and 2 as described (Farez et al., 2009). Complete Freund’s adjuvant was prepared by mixing non-viable desiccated M.Tuberculosis H-37Ra (#231141, BD Bioscience) with Incomplete Freund’s adjuvant (#263910, BD Bioscience) in the concentration of 5 mg/mL. Mice were monitored and scored daily thereafter. Clinical signs of EAE were assessed as follows: 0, no signs of disease; 1, loss of tone in the tail; 2, hind limb paresis; 3, hind limb paralysis; 4, tetraplegia; 5, moribund (Dang et al., 2015). For testing the effects of Miglustat (#HY-17020A, MedChemExpress) on EAE, drug was orally administrated daily in the dose of 600 mg/kg to mice started at day 23 after EAE induction (before EAE progressive phase).
Method Details
Isolation of cells from adult mouse CNS
Mononuclear cells, including astrocytes, monocytes, and microglia, were isolated from the CNS as previously described (Mayo et al., 2014; Rothhammer et al., 2017; Rothhammer et al., 2016). Briefly, mice were perfused with 1X PBS and the isolated brain was homogenized with a razor blade, digested in 0.66 mg/mL Papain (#P4762, Sigma-Aldrich) -contained HBSS solution for 15 mins at 37C and then incubated another 15 mins after equal volume of DMEM medium supplied with Collagenase D (#11088858001, Roche) and DNase I (#90083, Thermo Fisher Scientific) in the concentration of 0.66 mg/mL and 8 U/mL respectively is added. The digested CNS homogenize was filtered through a 70 μm cell strainer and centrifuged at 1400 rpm at 4C for 5 minutes followed by suspension of the pellet in 30% Percoll TM (#17–5445-01, GE Healthcare) in 1X PBS. The suspension was centrifuged at 1600 rpm at room temperature for 24 minutes with slow acceleration and deceleration settings for separation of myelin and cells. Isolated CNS cells were washed with 1X PBS and stained with fluorochrome-conjugated antibody to FITC anti-CD11b (Cat#11–0112-85, eBioscience), APC anti-CD45 (Cat#17–0451-83, eBioscience), PerCP anti-Ly-6C (Cat#128028, Biolegend), PE anti-mouse CD45R/B220 (Cat# 553089, BD Biosciences ), PE anti-CD140a (Cat#12–1401-81, eBioscience), PE anti-CD105 (Cat#12–1051-82, eBioscience), PE anti-O4 (Cat#FAB1326P, R&D), PE anti-Ly-6G (Cat#127608, BioLegend) and PE anti-mouse TER-119 (Cat#116207, BioLegend). The dilution rate for antibody staining is 1:100 in 1X PBS. Microglia were sorted as CD11b+ cells with low CD45 expression and low LY6C (CD11b+CD45lowLy6Clow), inflammatory monocytes were considered as CD45hiCD11b+Ly6Chi. Astrocytes were sorted as CD11blowCD45low Ly6ClowCD105lowCD140alowCD11blowO4lowTer119low after the exclusion of erythrocyte, lymphocytes, microglia, oligodendrocytes, and monocytes. a FACSAria IIU (BD Biosciences) was used for cell sorting. Single fluorochrome stained and unstained beads (Cat#01–2222-41, Invitrogen) were applied for compensation setting.
Flow cytometry for T cell
Single CNS cell suspensions were stimulated by using 500 ng/mL PMA (phorbol 12-myristate 13-acetate) (#P1585, Sigma-Aldrich), 500 ng/mL ionomycin (#I9657, Sigma-Aldrich), and GolgiSTOP (#554724, BD Biosciences, 1:1000) in RPMI 1640 medium (#11875119, Life Technologies) containing 10% FBS (#10438026, Gibco), penicillin/streptomycin (#15140122, Gibco, 1:100) for 4 hours at 37C in a 5% CO2 incubator. Following stimulation, T cells were washed with 1X PBS, centrifuged, and incubated with antibodies against surface markers, using a live/dead cell marker for 15 minutes on ice. After 2 times 1X PBS wash, cells were fixed and stained with antibody against intracellular target protein with an intracellular antibody labeling kit (#00–5523, eBioscience). Antibodies used were: BV421 anti-CD3 (#100227, BioLegend, 1:100), BV605 anti-CD4 (#100547, BioLegend, 1:50), 405 Aqua LIVE/DEAD cell stain kit (#L34966, Thermo Fisher Scientific, 1:400), FITC anti-IFNγ (#505806, BioLegend, 1:100), PE anti-IL-17a (#12–7177-81, eBioscience, 1:100), APC anti-IL-10 (#505010, BioLegend, 1:100), PerCP-Cy5.5 anti-FoxP3 (#45–5773-82, eBioscience, 1:100). Single fluorochrome stained and unstained beads (Cat#01–2222-41, Invitrogen) were applied for compensation setting. Alive CD3+/CD4+ cells were gated for data collection including at least 5000 cells. FACS was performed on an LSRFortessa (BD Biosciences). As outlined in the individual figures, Th1 cells were defined as CD3+CD4+IFN-γ+IL-17−IL-10−Foxp3−, Th17 cells as CD3+CD4+IFN-γ−IL-17+IL-10−Foxp3−, Treg cells as CD3+CD4+IFN-γ−IL-17−Foxp3+.
RNA-sequencing
Mice were sacrificed at day 52 after EAE induction for astrocyte isolation. Astrocytes were lysed, and RNA was isolated using the RNeasy Mini kit (#74106, QIAGEN) with on-column DNase I digestion (#79254, QIAGEN). RNA was suspended in 10 μL of nuclease free water for sequence using the 3’ Digital Gene Expression (Soumillon et al., 2014) by the Broad Technology Labs and the Broad Genomics Platform. Processed RNA-Seq data was filtered, removing genes with low read counts. Read counts were normalized using TMM normalization and CPM (counts per million) were calculated to create a matrix of normalized expression values.
RNA-Seq Data Processing
RNA-Seq data was analyzed using DESeq2 (Love et al., 2014). Gene expression with 0 counts and low expression were removed before differential analysis. Low expressed were filtered out by DESeq’s independent filtering, which removes genes in the lowest 40% quantile of mean normalized counts. Heatmaps were generated with Gene-E program, and the z-scores were calculated for each gene-row using the mean expression of biological replicates. Data are row-centered, log2-transformed and saturated at levels –1.0 and +1.0 for visualization satisfying a false discovery rate FDR<0.1. Each condition contains at least 3 mice.
nCounter gene expression
Total RNA was hybridized with reporter and capture probes in custom-made astrocyte-targeted nCounter Gene Expression code set (Rothhammer et al., 2017) according to manufacturer’s instructions (NanoString Technologies). Data were analyzed using nSolver Analysis software and Heatmaps were generated with Gene-E program, and the z-scores were calculated for each gene-row using the mean expression of biological replicates.
Ingenuity pathway analysis
To determine significantly regulated pathways, differentially metabolites level changes passed FDR < 0.1 were uploaded and analyzed using Ingenuity® Pathway Analysis (IPA) tool. P-values of canonical signaling pathways were calculated using Fischer’s Exact Test. The NF-κB network diagram was generated using IPA.
qPCR
RNA was extracted with RNeasy Mini kit (#74106, QIAGEN) and cDNA was prepared by using the High-Capacity cDNA Reverse Transcription Kit (#4368813, Life Technologies), both according to the manufacturer’s protocol. Gene expression was measured by qPCR with Taqman Fast Universal PCR Master Mix (#4367846, Life Technologies). Data were analyzed by the ddCt method by normalizing the expression of each gene to Actb for mouse and ACTB for human and then to the control group. All probes are listed below.
Mouse: B4galt6 Mm00480052_g1,Ugcg Mm01351301_m1,Cers1 Mm03024093_mH, Cers2 Mm00504090_g1, Cers4 Mm00482657_g1, Cers5 Mm00510992_m1, Cers6 Mm01270927_m1, Ccl2 Mm00441242_m1, Csf2 Mm01290062 m1, Nos2 Mm00440502_m1, Pla2g4a Mm01284324_m1, Mavs Mm00523170_m1, Bsg Mm01144228_g1, Hk2 Mm00443385_m1, Irf1 Mm01288580_m1, Rela Mm00501346_m1, Tnf Mm00443258_m1, Il1b Mm00434228_m1, Il6 Mm00446190_m1, Il12a Mm00434169_m1, Actb Mm02619580_g1, H2-t23 Mm00439246_g1, Iigp1 Mm00649928_s1, Fkbp5 Mm00487406_m1, Serping1 Mm00437835_m1, Gbp2 Mm00494576_g1, Psmb8 Mm00440207_m1, Fbin5 Mm00488601_m1, Srgn Mm01169070_m1, Ggta1 Mm01333302_m1, Ugt1a1 Mm02603337_m1, Amigo2 Mm00662105_s1. Human: B4GALT6 Hs00999574_m1, UGCG Hs00916612_m1, CERS1 Hs04195319_s1, CERS2 Hs00371958_g1, CERS4 Hs00226114_m1, CERS5 Hs00332291_m1, CERS6 Hs00826756_m1, CCL2 Hs00234140_m1, CSF2 Hs00929873_m1, NOS2 Hs01075529_m1, PLA2G4A Hs00996912_m1, TNF Hs00174128_m1, ACTB Hs01060665_g1.
In vivo knockdown with shRNA lentivirus
shRNA sequences against B4galt6, Ugcg, Cers1, Cers2, Cers4, Cers5, Cers6, Pla2g4a, Mavs, Bsg and a non-targeting control shRNA were cloned into pLenti-GFAP-EGFP-mir30-shRNA, a gift from Guang-Xian Zhang (Yan et al., 2012), using the following validated shRNA sequence against B4galt6 (TRCN0000077101, 5 ′ - CGATGGACTGAACAATTTATT-3’), Ugcg (TRCN0000093766, 5′- GCCATTGATGTATGTAAGAAA-3’), Cers1 (TRCN0000098026, 5′ -GCCTGACATTCCGTACTACTT-3 ‘ ) or Cers2 (TRCN0000173246, 5’-CCAGCTGGAGATTCACGTATT-3’), Cers4 (TRCN0000337888, 5 ′ -TACCTGCTGGAGGGTTGTAAG-3 ‘ ), Cers5 (TRCN0000174596, 5 ′ -GCATGTGGAGATTCACTTATT-3 ‘ ), Cers6 (TRCN0000428797, 5 ′ -TCAACGCTGGTTTCGACAAAG-3 ‘ ), Pla2g4a (TRCN0000097277, 5 ′ -GCACAGCTACATTCCCTGTAT-3), Mavs (TRCN0000124772, 5 ′ -GCAACCAGACTGGACCAAATA-3) and Bsg (TRCN0000054862, 5 ′ -CCTGGTGTTGGTTACCATCAT-3’). For cloning gene-targeted shRNA vector, a ~ 300 bp DNA fragment contains mir30-shRNA backbone with target gene shRNA sequence and restrict enzyme cutting sites was synthesized (GENEWIZ, PstI-NotI-mir30-shRNA-EcoRI-SalI). The mir30-shRNA cassette of DNA fragment was cloned into NotI-SalI (#R3189 and, #R3138 New England Biolabs) sites of pLenti-GFAP-EGFP-mir30-shRNA. Lentivirus particles were generated by transfecting 5,000,000 HEK-293FT cells (#R70007, Invitrogen) with FuGENE HD Transfection Reagent (#E2311, Promega) mixture containing 3 μg of pLenti-GFAP-EGFP-mir30-shRNA vector and 9 μg of ViraPower Packaging mix (helper plasmids pLP1, pLP2 and pLP/VSV-G; #K497500, Thermo Fisher Scientific) according to manufacturer’s protocol. The culture medium was refreshed 24 hours after transfection and the cells were incubated for additional 2–3 days till the supernatants were collected. Following, the supernatant filtered through a 0.45-μm PVDF filter (#SLHVM33RS, Millipore), mixed with Lenti-X concentrator (#631231, Clontech) in 3 to 1 volume ratio and incubated overnight at 4C. Finally, the virus particle was spun down at 1500X g for 45 mins at 4C and resuspended in 100th of original volume using 1X PBS. The viral titer was determined using the Lenti-X qRT-PCR titration kit (#LV900, Applied Biological Materials) with Fast SYBR Green Master Mix (#4385612, Thermo Fisher Scientific) followed the manual.
Lentiviruse particles were delivered via intracerebroventricular (ICV) injection to EAE mice at progressive stage (at 10 days after EAE induction for C57BL/6J mice and at 37 and 44 days after EAE induction for NOD/ShiLtJ). Basically, mice were anesthetized with 1% – 3% isoflurane mixed with oxygen at indicated time points, positioned in a Kopf Stereotaxic Alignment System (+/− 1.0 (lateral), −0.44 (posterior), −2.2 (ventral) relative to Bregma; #1900, Kopf) and slowly injected 10 μL of 107 IU of lentivirus to both sides respectively using a 25 μL Hamilton syringe (#20787, Sigma-Aldrich). The injection system was retracted slowly, skin incisions closed carefully by surgical sutures, mice allowed to wake up in a pre-warmed cage and checked twice daily thereafter, 1 mg/kg of buprenorphine SR (#1Z-74000–192703, ZooPharm) was delivered intraperitoneally 2 hours after injection. For knockdown in NOD EAE mice, mice were permitted to recover for 7 days before second times ICV injection of lentivirus. Knockdown efficiency of target gene in astrocyte in vivo was determined by qPCR assay and the astrocyte were isolated from EAE mice 3 days after ICV injection.
Primary astrocyte cultures
Cerebral cortices from neonatal mice (1–3 days) were dissected, carefully stripped of their meninges, pooled 6 brains in 7 mL of 0.25% trypsin-EDTA (#25200–072, Thermo Fisher Scientific), homogenized by repeatedly pipetting, incubated at 37C for 15 mins, and dispersed to single-cell level by passing through a cell strainer (70 μm). The cell suspension was then cultured at 37C in humidified 5% CO2 on poly-L-Lysine (#P4707, Sigma-Aldrich) precoated 75 cm2 cell culture flasks. Medium was replaced every 3–5 days. The cells reached confluence after 7–10 days. Microglia were removed by shaking the glia culture at 225 rpm at 37C for at least 3 hours and washing extensively with 1X PBS, the remaining attached cells were astrocyte in a purity greater than 85 % evaluated previously (Rothhammer et al., 2017). Following, astrocytes were detached by mild trypsinization with Trypsin-EDTA (0.05%) at 37C and plated as required for the specific experiments. The complete astrocyte culture medium is DMEM/F12 medium (#10565018, Gibco) supplied with 10% FBS and 100 unit/mL penicillin/streptomycin.
In vitro knockdown with shRNA lentivirus
0.5X 10⁶ astrocyte was seeded to each well of 12-wells plate precoated with Poly-L-lysine and cultured for 48 hours before infection. 107 UI/mL Gene-targeted shRNA lentivirus and 10 μg/mL polybrene (#TR-1003-G, Sigma-Aldrich) in 2 mL astrocyte complete medium was added to infect primary astrocyte cultures, and then the cell were centrifuged in 600g at 25 °C for 0.5–1 hour. Culture medium was refreshed the next day and the cells were cultured for 48 hours before stimulation or co-culture step.
In vitro knockdown with siRNA
Smart pools of ON-TARGETplus siRNA of the corresponding genes (Pla2g4a: #L-063167–01-0005, Mavs: #L-053767–00-0005, Bsg: #L-042995–00-0005, Hk2: #L-051128–00-0005, Irf1: #L-046743–01-0005, RelA: #L-040776–00-0005, Dharmacon) were mixed with INTERFERin (#409, Polyplus transfection) in Opti-MEM (#51985–034, Gibco) and incubated at room temperature for 10 mins, which was added to primary astrocytes in complete medium following manufactureŕs instructions. After 48h incubation, downstream analysis and cytokine stimulation were performed. Knockdown efficiency was confirmed by qPCR. The working concentration of siRNA is 1 nM for all experiments.
Mouse astrocyte stimulation
For qPCR and metabolic profiling, Primary mouse astrocyte cultures were pretreated with vehicle, 10 μM LacCer (Cat. #1507, Matreya), 500 nM cPLA2i (Pyrrophenone, #sc-296161, Santa Cruz Biotechnology), 100 μM Miglustat (#72599–27-0, BOC Sciences) or in combination for 30 minutes, and then stimulated with 10 ng/ml TNFα (#410-MT-010, R&D Systems) and 100 ng/ml IFNγ (#485-MI-100, R&D Systems) for 18 hours. Unless otherwise indicated, RNA was isolated 18 hours after start of cytokines stimulation. In vitro lentivirus infected astrocytes were stimulated as mentioned and the GFP+ astrocytes were sorted for further qPCR.
For western blot to detect nuclear p65, 1,000,000 primary mouse astrocytes were seeded per well of 6-well plate and 2 days after pretreated with vehicle, 10 μM LacCer, 500 nM cPLA2i or in combination for 30 mins and stimulated with 10 ng/ml TNFα (#410-MT-010, R&D Systems) and 100 ng/ml IFNγ (#485-MI-100, R&D Systems) for 1 hour, and then cells were harvested for cell fraction isolation and western blot analysis.
For MAVS oligomerization analysis, 1,000,000 Astrocytes seeded in each well of 6-well plate were pretreated with vehicle, 10 μM LacCer (Cat. #1507, Matreya), 1 μM cPLA2i (Pyrrophenone, #sc-296161, Santa Cruz Biotechnology), or both for 30 mins, stimulated with TNFα/IFNγ for 18 hours and harvested for mitochondria isolation with Mitochondria Isolation Kit (#ab110170, abcam) following the manufacturer’s manual. Proteinase and phosphatase inhibitor mixture (#78440, Thermo Fisher) was supplied for all lysis buffers in the kit.
For in vitro astrocyte polarization studies, 200,000 primary mouse astrocytes were seeded in each well of 24-well plate and cultured in serum-free base medium containing 50% neurobasal medium (#21103049, Thermo Fisher Scientific), 50% DMEM (#11965118, Thermo Fisher Scientific), penicillin/streptomycin (#15140122, Gibco, 1:100), 1 mM sodium pyruvate (# 11360070, Gibco), 2 mM glutamine (#25030081, Gibco), 1× SATO and 5 μg/ml N-acetyl cysteine (#A7250, Sigma-Aldrich) and 5 ng/ml HBEGF (#E4643, Sigma-Aldrich) for 7 days, prior to the stimulation of astrocyte with 3 ng/ml Il-1α (#I3901, Sigma-Aldrich), 30 ng/ml TNF (#8902SF, Cell Signaling Technology) and 400 ng/ml C1q (#MBS143105, MyBioSource) for 24 hours as previous described (Liddelow et al., 2017). 100X SATO stock solution was prepared by adding 800 mg of transferrin (#T-1147, Sigma-Aldrich), 800 mg of BSA (#A8806, Sigma-Aldrich), 128 mg of putrescine (#P5780, Sigma-Aldrich), 50 mg of progesterone (#P8783, Sigma-Aldrich) and 320 μg of sodium selenite (#S5261, Sigma-Aldrich) to 80 mL of neurobasal medium.
Human astrocyte stimulation
Human cells were plated at 20,000 cells/mL into 12 well plates. Once cells were 80% confluent, they were treated under the indicated conditions, pretreated with vehicle, 10 μM LacCer (Cat. #1507, Matreya), 500 nM cPLA2i (Pyrrophenone, #sc-296161, Santa Cruz Biotechnology), 100 μM Miglustat (#72599–27-0, BOC Sciences) or in combination for 1 hour, and then stimulated with 10 ng/ml TNFα (#210-TA-020, R&D Systems) and 100 ng/ml IFNγ (#285-IF-100, R&D Systems) for 24 hours. The cells were harvest for RNA isolation and qPCR and the stimulation medium was collected as human astrocyte-conditioned medium for migration and neurotoxicity assay.
Generation of Astrocyte-Conditioned Medium
500,000 Mouse were seeded to each well of 12-wells plate precoated with Poly-L-lysine and cultured for 48 hours before target-gene knockdown or inhibitor treatment. Astrocyte cultures were infected with shRNA-carried lentivirus 3 days before or pretreated with 100 μM Miglustat (#72599–27-0, BOC Science) for 1 hour and then stimulated with 10 ng/ml TNFα (Mouse #410−ΜΤ−010 or Human #210-TA-020, R&D systems) and 100 ng/ml IFNγ (Mouse #485−ΜI−100 or Human #285-IF-100, R&D systems) for 24 hours, extensively washed with 1X PBS, and supplemented with fresh astrocyte complete medium. Forty-eight hours later, supernatants were spun down and kept for migration and neurotoxicity assays at −80 °C.
Monocyte Migration Assay
Splenic monocytes were purified from female C57BL/6J mice by CD11b Microbeads (#130–049-601, Miltenyi) following the manufacturer’s manul. 100,000 monocytes were seeded in the upper chamber of a 24-well cell culture insert, with a 5-μm pore size (#3421, Thermo Fisher Scientific), containing 300 μL of astrocyte-conditioned medium (as detailed earlier) in the bottom chamber. After 3 hours incubation at 37C in 5% CO2 supplied incubator, 50 μL of 70 mM EDTA (#E177–100ML, Amresco) in 1X PBS was added to bottom chamber and the plate was transferred to a 37C incubator with 80 rpm shaking for 15 mins. Then, the transwells were transferred to a new 24-well plate that filled with 600 μL of Accutase solution (#A6964, Sigma-Aldrich) in each well, kept the plate at 37C with 80 rpm shaking for another 15 mins. Following, medium and Accutase solution were pooled and the cells were harvested and resuspended in 200 μL of 1X PBS for quantification by FACS.
Neurotoxicity Assay
10,000 of N2A neuronal cells (#CCL-131, ATCC) were plated in each well of 96-well plates and preactivated with 100 ng/mL mouse IFN-γ (#485-MI-100,; R&D Systems) for 24 h. Thereafter, medium was replaced, after extensive washing with 1X PBS, with 200 μL of astrocyte-conditioned medium to each well. Additional 24 hours incubation after the supernatant was harvested for cytotoxicity evaluation by measuring LDH release with CytoTox 96 nonradioactive cytotoxicity assay kit (#G1780, Promega), followed the protocol suggested by the manufacturer.
Microglia Polarization Assays
200,000 primary mouse astrocytes were seeded for each well of 24-well plate and treated as for conditional medium preparation. Thereafter, activation medium was removed and primed astrocytes were washed extensively with 1X PBS. Monocytes isolated with CD11b Microbead (#130–049-601, Miltenyi) were from spleens of naive female C57BL/6J mice and co-cultured with primed astrocytes with 1:1 ratio. After 24 hours, monocytes were re-isolated and RNA was extracted, transcribed, and subjected to qPCR analysis.
Subcellular fractionation and immunoblot analysis
Subcellular fractions were isolated using Cell Fractionation kit (#9038S, Cell Signaling Technology) followed the manufacturer’s manual. 10 μg of nuclear fractions were loaded to each well of Bolt 4–12% Bis-Tris Plus Gels (# NW04125BOX, Thermo Fisher Scientifics) for SDS-PAGE and transferred onto 0.45 μm PVDF membranes (#IPVH15150, Millipore). As primary antibodies anti-Histone H3 rabbit polyclonal Ab (#07–690, Sigma-Aldrich, 1:2000), anti-Lamin B1 Rabbit mAb (HRP Conjugate) (#15068S, Cell Signaling Technology, 1:5000), anti-NF-κB p65 rabbit mAb (#8242S, Cell Signaling Technology, 1:1000), anti-Bsg rabbit mAb (#MA5–32534, Thermo Fisher Scientific, 1:1000) and anti-Hk2 rabbit mAb (#2867, Cell signaling Technology, 1:1000) were used, followed by goat anti-rabbit IgG HRP linked Ab (#7074S, Cell Signaling Technology, 1:2000). Blots were developed using the SuperSignal West Femto Maximum sensitivity Substrate Solution (#34095, Thermo Fisher Scientific) or KwikQuant Ultra Digital-ECL Substrate Solution (#R1002, Kindle Biosciences). CL-XPosure Film (#34090, Thermo Fisher scientific) or KiwiQuant® imager (#D1001, Kindle Biosciences) were used for signal detection. Data quantification was done using Fiji software (Schindelin et al., 2012).
In silico promoter analysis
The ~2000 bp upstream of M. musculus Ccl2-201, Csf2-201 and Nos2-201 genomic sequences were extract from Ensembl and analyzed on JASPAR for p65 binding site passed 85% of relative profile score threshold (Sandelin et al., 2004; Yates et al., 2016).
Chromatin immunoprecipitation (ChIP)
1,000,000 Astrocytes were plated in each well of 6-well plate. After 48 hours culture, cells were pretreated with tested materials (vehicle, 10 μM LacCer (Cat. #1507, Matreya) or 500 nM cPLA2i (Pyrrophenone, #sc-296161, Santa Cruz Biotechnology)) for 30 mins, stimulated for 2 hours with 10 ng/ml TNFα (#410-MT-010, R&D Systems) and 100 ng/ml IFNγ (#485-MI-100, R&D Systems) and then harvested for ChIP assay. Cells were cross-linked with 1% formaldehyde (#F8775, Sigma-Aldrich) diluted in complete astrocyte medium at 37C for 15 mins, washed with 1X PBS and lysed with 350 μl lysis buffer (1% SDS (#L3771, Sigma-Aldrich), 10 mM EDTA (#E177–100ML, Amresco), 50 mM Tris-HCl (#15568025, Invitrogen), pH = 8.0) containing 1× phosphatase and protease inhibitor cocktail (#78441, Thermo Fisher Scientific). Chromatin was sheared by sonication at the setting, 10 sec ON/ 20 Sec OFF for 40 mins in the cold room with sonicator () and 100 μL chromatin lysates were mixed with 200 μL of protein-DNA complex pull-down beads solution and 200 μL of ChIP incubation buffer (1% Triton X-100 (#X100, Sigma-Aldrich), 2 mM EDTA, 150 mM NaCl (#S7653, Sigma-Aldrich), 20 mM Tris-HCl, pH 8.0), leaving the mixture on a rotter at 4C overnight. The beads were extensively washed 3 times with RIPA buffer (#89900, Thermo Fisher Scientific) and 2 times with TE buffer (#12090015, Invitrogen) at 4C, resuspended in 100 μL reverse cross-link buffer (1% SDS, 0.1 M NaHCO3 (#S5761, Sigma-Aldrich)), and then heated at 65 °C for 8 h to reverse the cross-linking. DNA fragments were purified with a NucleoSpin® Gel and PCR Clean-up kit (#740609.250, Macherey-Nagel) and analyzed using the Fast SYBR Green master mix (#4385612, Thermo Fisher Scientific) both followed the manufacturer’s manuals. 20 μL of each qPCR mixture contains 2 μL of purified DNA extract, 0.4 μL of 10 μM paired detection primer, 10 μL of master mix and 7.6 μL of nuclease-free water. For preparation of protein-DNA complex pull-down beads solution for one sample, 5 μL of anti-p65 antibody (#8242, Cell Signaling Technology) or control IgG antibody (#3900S, Cell Signaling Technology) was prebound to 3.5 μL of protein A- and 3.5 μL of protein G-Dynabeads magnetic beads (#10001D and #10003D, Thermo Fisher Scientific) on a rotter at 4C for 6 hours and the beads were washed three times with 0.5% BSA 1X PBS, finally resuspended in 200 μL of ChIP incubation buffer. For ChIP data analysis, the fold enrichment method was applied. The following primer pairs were used: Ccl2_NFκB binding site 1: forward 5’-CCAAATTCCAACCCACAGTT-3’, reverse 5’- AGTGAGAGTTGGCTGGTG-3’, Ccl2_NFκB binding site 2: forward 5’- CATTCCAGTTGGCTCACTCA-3’ and reverse 5’- CTGGAACAGGACCCAGGTAG-3’, Ccl2_NFκB binding site 3: 5’- GGCTAAATCCAGAACAATTTGG-3’and reverse 5’-TCAGAAATTTGCCTGCCTCT-3’, Csf2_NFκB binding site 1: forward 5’-AAGGAGAGGCTAGCCAGAGG-3’ and reverse 5’- GCTATACATGGGGCCAGTGA-3’, Csf2_NFκB binding site 2: forward 5’- ATCTCAGAAGGTGGCTGGAA-3’ and reverse 5’CCTCTGGCTAGCCTCTCCTT-3’, Nos2_NFκB binding site 1: forward 5’CACAGACTAGGAGTGTCCATCA-3’ and reverse 5’-GCAGCAGCCATCAGGTATTT-3’, Nos2_NFκB binding site 2: forward 5’-ACCATGCGAAGATGAGTGGA-3’ and reverse 5’-AGCCAGGAACACTACACAGAA-3’, Nos2_NFκB binding site 3: forward 5’-TGAGTCTTGTGTTGGGGACA-3’ and reverse 5’-TTCAACTGGCAGACCCTTCT-3’.
Semi-Denaturing Detergent-Agarose Gel Electrophoresis (SDD-AGE)
Mitochondria samples were suspended in 4 × sample buffer (2 × TAE (#24710030, Thermo Fisher Scientific); 20 % glycerol (#G5516, Sigma-Aldrich); 4 % (w/v) SDS and 0.01% (w/v) bromophenol blue (#B0126, Sigma-Aldrich)), left standing at room temperature for 15 mins before analyzed by SDD-AGE and western blot performed as described (Halfmann and Lindquist, 2008). Briefly, mitochondria samples were loaded to 1.7% of high-strength agarose gel (#50152, Lonza) immersed in 0.5% SDS 1X TAE buffer and the DNA electrophoresis was performed at 100V for 45 mins in cold room, followed by protein transfer to 0.2 μm supported nitrocellulose membranes (#10600120, Amersham) with capillary transfer method and western blot with anti-MAVS rabbit mAb (#4983, Cell Signaling Technology, 1:1000) and goat anti-rabbit IgG HRP linked Ab (#7074S, Cell Signaling Technology, 1:2000).
Immunofluorescent labeling and imaging
18 mm round cover glasses were coated with 100 μg/mL poly-L-lysine (#P4707, Sigma-Aldrich) and 50 μg/mL laminin (#L2020, Sigma-Aldrich) in 1X PBS consecutively and seeded with 50,000 astrocytes. After vehicle or 10 μM LacCer treatment for 4 hours, astrocytes were stained with 50 nM MitoTracker™ Red CMXRos (#M7512, Thermo Fisher Scientific) in complete astrocyte medium at 37C for 15 mins, washed with medium, fixed with 3.7% formaldehyde diluted in medium at 37C for 15 mins and then washed with 1X PBS extensively. Following, cells were incubated in 1X PBS containing 0.25% Triton X-100 (#X100, Sigma-Aldrich) at room temperature for 10 mins for cell membrane permeabilization and then in 1X PBS containing 0.1% Triton X-100 and 10% donkey serum (#D9663, Sigma-Aldrich) at R.T. for 30 mins. Anti-cPLA2 (4–4B-3C) mouse mAb (#sc-454, Santa Cruze Biotechnology, 1:50), anti-MAVS rabbit mAb (#4983, Cell Signaling Technology, 1:100), anti-MAVS mouse mAb (#sc-365333, Santa Cruz Biotechnology, 1:50) and anti-HK2 rabbit mAb (#ab228819, abcam, 1:50) were used as first antibody staining at R.T. for 1 hour in the dark and secondary antibody staining with donkey anti-mouse IgG conjugated with FITC (#715–095-150, Jackson ImmunoResearch, 1:200) and donkey anti-rabbit IgG conjugated with Alexa 647 (#ab150075, abcam, 1:200) were applied at R.T. for 1 hour. Between steps, there are 3 times wash with 1X PBS containing 0.1% Triton X-100. Slides were mounted with DAPI Fluoromount-G (#0100–20, SouthernBiotech) and images obtained with 40X objective and LSM 710 AxioObserver.Z1 (Zeiss). Fiji ImageJ was used for processing image, analysis of co-localization with coloc2 function (Schindelin et al., 2012).
Co-immunoprecipitation (Co-IP)
1,000,000 primary mouse astrocytes seeded in each well of 6-well plate were pre-treated with vehicle or 10 μM LacCer (Cat. #1507, Matreya) for 30 min before activation with 10 ng/ml TNFα (#410-MT-010, R&D Systems) and 100 ng/ml IFNγ (#485-MI-100, R&D Systems). 18 hours later, cells were harvested, lysed with 500 μL RIPA buffer (#89900, Thermo Fisher Scientific) supplied with phosphatase and protease inhibitor cocktail (#78441, Thermo Fisher Scientific), pulled down with anti-MAVS rabbit mAb (#4983, Cell Signaling Technology, 1:1000) and analyzed by western blot. 200 μg of total cell lysate was incubated with 5 μL of IP antibody, 5 μL of protein A Dynabeads and 5 μL of protein G Dynabeads (#10001D, #10003D, Thermo Fisher Scientific) in 500 μL of RIPA buffer containing protease and phosphatase inhibitor mixture overnight. Beads were washed with RIPA buffer 3 times, resuspended in 50 μL of 2X LDS sample buffer (#NP0007, Invitrogen), incubate at 50C for 15 mins, and analyzed by western blot. For HEK293 cell overexpression CoIP experiment, the procedures were the same as for primary mouse astrocyte except the pull-down antibody applied depending on experiments design, either anti-flag mouse mAb (#F1804, Sigma-Aldrich), anti-flag rabbit polyclonal Ab (#F7425, Sigma-Aldrich) or anti-MAVS rabbit mAb (#24930S, Cell Signaling Technology) were used. For western blot analysis, the listed antibodies were applied; For primary astrocyte CoIP experiment, anti-MAVS mouse mAb (#sc-365333, Santa Cruz Biotechnology, 1:200), anti-cPLA2 (4–4B-3C) mouse Ab (#sc-454, Santa Cruz, 1:200), and Anti-HK2 rabbit mAb (#2867, Cell Signaling Technology, 1:1000) were applied. For HEK293 overexpression CoIP experiments, anti-MAVS rabbit mAB (#24930S, Cell Signaling Technology, 1:1000), anti-cPLA2 rabbit mAB (#2832S, Cell Signaling Technology, 1:1000), anti-GFP rabbit polyclonal Ab (#ab290, abcam, 1:1000 ), anti-MAVS mouse mAb (#sc-365333, Santa Cruz Biotechnology, 1:200), anti-cPLA2 (4–4B-3C) mouse Ab (#sc-454, Santa Cruz, 1:200) and anti-HK2 (B8) mouse mAb (#sc-374091, Santa Cruz Biotechnology, 1:200) were applied. Anti-mouse IgG HRP-linked Ab (#7076S, Cell Signaling Technology, 1:2000) and anti-rabbit IgG HRP-linked Ab (#7074S Cell Signaling Technology, 1:2000) were used as secondary antibody in general.
Mutagenesis and Cloning
To generate expression plasmids for mutant or truncated overexpression plasmids, human PLA2G4A-His tag overexpression plasmid (#MG51714-CH, Sino Biological) and human MAVS-flag overexpression plasmid (#45905, Addgene) were used as templates. The mutagenesis was performed with Q5® Site-Directed Mutagenesis Kit (#E0554S, New England Biolabs) as suggested by the manufacturer with minor change in PCR cycle for 18 cycles. The primers for mutagenesis were designed with NEBaseChanger webtool (New England Biolabs) and the sequence and their primer melting temperature (Tm) value for elongation step are listed below. For mutant PLA2G4A; S111P (Fw: TACTGTATCTcctATGAAGGTGG, Rev: AATGTTGCTGTCCCTAGAG; Tm = 59 ), I399A/L400A (Fw: TGCCTTTTCCgcagcaTTCAACAGAGTTTTGGGCGTTTCTGG, Rev: CTGCCCCAGACACCCATT; Tm = 64), L552A (Fw: GGACAGTGGGgcaACATTTAACC, Rev: ACTACATGAATCTTTTTACTTTTG; Tm = 56), R485H (Fw: CAGAGAAGGAcatGCTGGGAAGG, Rev: GTATTGAATAAAGCTGAATCACTCAC; Tm = 63), D549A (Fw: TCATGTAGTGgccAGTGGGCTCA, Rev: ATCTTTTTACTTTTGACATCCAGAGG; Tm = 64), S505A (Fw: TTATCCACTGgctCCTTTGAGTG, Rev: GATGTATTGAGATTCAAGCCC; Tm = 62), S505E (Fw: TTATCCACTGgaaCCTTTGAGTGAC, Rev: GATGTATTGAGATTCAAGC; Tm = 56). For Mutant MAVS; G67A/W68A/V69A (Fw: agcaACAAGACATTTCAATAATGACATAAAC, Rev: gctgcGCTGTCAGGGGTTGTAGA; Tm = 72). W56A (Fw: GGACACCCTCgctCATCTCTTCAATACCC, Rev: CGGTTCCCTGAGAGTGTG; Tm = 62). For truncated PLA2G4A cloning, PLA2G4A overexpression plasmid (#MG51714-CH, Sino Biological) was applied as PCR template mixed with primer pair listed below and Hot Start Taq 2X Master Mix (#M0496, New England Biolabs). The PCR reaction was proceeded as manual described. Briefly, PLA2G4A overexpression plasmid and PCR products were digested with HindIII (#R3104, New England Biolabs) and NotI (#R3189, New England Biolabs) mixture and target DNA fragments were separated with gel electrophoresis and purified with NucleoSpin® Gel and PCR Clean-up kit (#740609.250, Macherey-Nagel). Following, ligation of digested overexpression backbone plasmid and PCR products were performed with T4 DNA Ligase (#M0202, New England Biolabs). The primer design and specificity check were performed with Primer3 and primer-blast (Untergasser et al., 2012; Ye et al., 2012). delete C2 domain (dC2, 140–749 a.a) (Fw: CCCAAGCTTATGTCATGCCCAGACCTACGATT, Rev: ATAAGAATGCGGCCGCTTAGTGATGGTGGTGATGAT); delete phospholipid binding domain (dPL, 179–749 a.a.) (Fw : CCCAAGCTTATGGAAGGATTGCATTCTGCA, Rev : ATAAGAATGCGGCCGCTTAGTGATGGTGGTGATGAT ).
Plasmids
PLA2G4A-eGFP, PLA2G4A(D43N)-eGFP and PLA2G4A(1–215 a.a.)-GFP expression plasmids are gift from Dr. Javier Casas Requena and Dr. Joseph V. Bonventre (Casas et al., 2006; Movahedi Naini et al., 2015). The MAVS M2–6L mutant and M2 isoform expression plasmids were kindly provided by Dr. Fajian Hou (Qi et al., 2017).
Transfection
FuGENE HD Transfection Reagent (#E2311, Promega) was used to deliver overexpression plasmids and mixed with DNA in a 3:1 ratio (transfection reagent (v, μL): plasmid (w, μg)), followed the manufacturer’s manual. For CoIP, 1,000,000 of HEK293 cells were seeded in one well of 6-well plate and the day after transfected with mixture containing 1 μg of MAVS overexpression plasmid, 2 μg of PLA2G4A overexpression plasmid alone or both together (Molecular ratio (cPLA2: MAVS) = 1:1). For MAVS aggregation test, 5,000,000 of HEK293 cells were seeded in a 10-cm plate and transfected with mixture containing 4 μg of PLA2G4A overexpression plasmid and 2 μg of MAVS overexpression plasmid (Molecular ratio (cPLA2: MAVS) = 1:1) or 16 μg of PLA2G4A overexpression plasmid and 2 μg of MAVS overexpression plasmid (Molecular ratio (cPLA2: MAVS) = 4:1) next day. For measurement of lactate release, mitochondrial hexokinase activity and pyruvate level, 5,000,000 of HEK293 cells were seeded in a 10-cm plate and transfected with mixture containing 4 μg of PLA2G4A overexpression plasmid. For Luciferase assay, 20,000 of HEK293 cells were seeded in 96-well plate and next day transfected with 50 ng NF-κB reporter plasmid (#E8491, Promega), 20 ng MAVS overexpression plasmid, 160 ng PLA2G4A overexpression plasmid and 1 ng pRL Renilla luciferase control plasmid (# E2241, Promega).
Luciferase assay
24 hours after transfection, cells were kept in −80 freezer before assay. Dual-Luciferase® Reporter Assay System (#E1910, Promega) is used for this assay and the procedures was proceeded as manufacturer instruction and the signal was detect on Infinite M1000 PRO Microplate Reader (Tecan). The NFκB response activity was normalized to Renilla luciferase activity first and then compared to control group for data analysis.
ROS measurement
10,000 astrocytes were seeded in each well of 96-well black plate and rested for 2 days in complete medium, following activated with 10 ng/ml TNFα (#410-MT-010, R&D Systems) and 100 ng/ml IFNγ (#485-MI-100, R&D Systems) for 24 hours in the presence of vehicle, 10 μM LacCer (Cat. #1507, Matreya), 1 μM cPLA2i (Pyrrophenone, #sc-296161, Santa Cruz Biotechnology)) or in combination. The protocol is modified from published article (Sheng et al., 2013), analyzed using the cellular reactive oxygen species detection assay kit (#ab113851, abcam) as suggested by the manufacturer and the signal was detect on Infinite M1000 PRO Microplate Reader (Tecan). The fluorescent signal was normalized to cell number estimated using CyQUANT cell proliferation assay kit (#C7026, Invitrogen) first and then compared to control group for data analysis.
Lactate release measurement
2 day after seeding on 48-well plate, 200,000 astrocytes were cultured in 1mM glucose DMEM medium (#A1443001, Gibco) supplied 100 unit/mL penicillin/streptomycin without FBS at least 48 hours. Thereafter, medium was removed, cells washed with 1X PBS, pretreated with indicated molecules (10 μM LacCer (Cat. #1507, Matreya), 500 nM cPLA2i (#sc-296161, Santa Cruz Biotechnology), 0.5 μM UK-5099 (#4186, Tocris Bioscience) or 100 μM Miglustat (#72599–27-0, BOC Science)) for 30 mins or (methylglyoxal (#M0252, Sigma-Aldrich) or 5 mM 2-DG (2-Deoxy-D-glucose, #D6134, Sigma-Aldrich) for 24 hours, and stimulated with 10 ng/ml TNFα (#410-MT-010, R&D Systems) and 100 ng/ml IFNγ (#485-MI-100, R&D Systems) for 1 hours in 1mM glucose DMEM medium, the medium was collected for filtration with Amicon ultracel 10k (#UFC501096, Millipore) under 12,000g centrifuge at 4C for 30 mins. Lactate in flow-through medium was quantified using the L-lactate assay kit (#A-108, Biomedical Research Service & Clinical Application) and GloMax microplate reader (Promega) as suggested by the manufacturer. The absorption signal was normalized to cell number estimated using CyQUANT cell proliferation assay kit (#C7026, Invitrogen) first and then compared to control group for data analysis. cPLA2-overexpressed HEK-293 cells was starved and its 1 hour cultured conditional medium was harvested and processed as abovementioned procedures for lactate level measurement.
Measurement of mitochondrial hexokinase enzymatic activity and pyruvate level
Mitochondria sample was isolated with Mitochondria Isolation Kit (#ab110170, abcam) following the manufacturer’s manual and quantified its protein concentration with Pierce BCA protein assay kit (#23225, Thermo Fisher Scientific). 40 μg of mitochondria was applied for measurement of HK activity and pyruvate level using hexokinase colorimetric assay kit (#K789, BioVision) and EnzyChrom pyruvate assay kit (#EPYR-100, BioAssay Systems), respectively, followed the procedures suggested by the manufacturers. The signal was detected on GloMax microplate reader (Promega).
Oxygen consumption
Respiration was measured by using the XFe24 or XFe96 analyzers (Agilent Technologies). 70,000 or 30,000 cells per well were seeded in 24-well or 96-well plates, respectively, and then starved for 48 hours, stimulated for 12 hours with 10 ng/ml TNFα (#410-MT-010, R&D Systems) and 100 ng/ml IFNγ (#485-MI-100, R&D Systems) after 30 mins pretreatment of 500 nM cPLA2i (#sc-296161, Santa Cruz Biotechnology) or 0.5 μM UK-5099 (#4186, Tocris Bioscience), and then started Mito Stress assay with Seahorse XF Cell Mito Stress Test Kit (#103015–100, Agilent Technologies) followed the manufacturers’ manual. The oxygen consumption rate (OCR) was then quantified after sequential addition of 2 μM Oligomycin, 1 μM FCCP and 5 μM Rotenone/Antimycin A. Before Mito Stress assay, 1mM glucose DMEM supplied 100 unit/mL of penicillin/streptomycin was used and the assay medium (10 mM Glucose, 1 mM pyruvate and 2 mM glutamine) was used during the assay. The OCR rate was normalized to cell number estimated using CyQUANT cell proliferation assay kit (#C7026, Invitrogen).
Cell-free and in vitro cPLA2 activity assay
2 μg/mL human recombinant cPLA2 protein (#6659-PL-010, R&D systems) was mixed with substrates containing 10 μM LacCer (Cat. #1507, Matreya) or vehicle and the fluorescence signal was read after 10 minutes room temperature incubation. For in vitro cPLA2 enzymatic activity assay, 5,000,000 cells were seeded on a 10-cm dish and kept rested for 2 days, pretreated with 10 μM LacCer or 10 μM LacCer + 500 nM cPLA2i (#sc-296161, Santa Cruz Biotechnology) for 30 mins, stimulated for 1 hour with 10 ng/ml TNFα (#410-MT-010, R&D Systems) and 100 ng/ml IFNγ (#485-MI-100, R&D Systems). After stimulation, the astrocytes were lysed with 250 μL of RIPA buffer supplied with protease and phosphatase inhibitor mix, treated with 5 μM iPLA2 inhibitor (Bromoenol Lactone, #B1552, Sigma) at 25°C for 15 minutes, and then mix 50 μL of cell lysate and 50 μL of substrate mixture supplied in EnzChek™ Phospholipase A2 Assay Kit (#E10217, Thermo Fisher Scientific) for detecting cPLA2 activity. After 10 mins incubation at R.T., the fluorescence signal was read by Infinite M1000 PRO Microplate Reader (Tecan) and the procedures are as suggested by the manufacturer.
Immunofluorescence analysis of human samples
4μm thick paraffin embedded brain sections were deparaffinised, washed in PBS and treated with heat-induced antigen retrieval in citrate buffer pH = 6. When necessary endogenous avidin/biotin was blocked using an avidin-biotin blocking kit (#004303, Thermo Fisher Scientific), and non-specific binding was further blocked with 10% goat serum (#G9023, Sigma-Aldrich). A combination of anti-cPLA2 mouse mAb (#sc-454 Santa Cruz, 1:100) and anti-MAVS rabbit polyclonal Ab (#ab189109, abcam, 1:100), anti-cPLA2 mouse mAb and anti-Tom20 rabbit polyclonal Ab (#sc-11415, Santa Cruz Biotechnology, 1:200) was incubated in blocking buffer with 0.1% Triton-X100 overnight at 4°C. The next day slides were washed with 1% PBS-Triton-X100 and, in case of MAVS and cPLA2, detected with AF635 conjugated goat anti-mouse IgG antibody (#A31574, Life Technologies, 1:250) and biotinylated anti-rabbit goat immunoglobulins (#E0432, Agilent/Dako, 1:500). Sections were washed and incubated with AF488 conjugated streptavidin (#016–540-084, Jackson ImmunoResearch, 1:250) or AF635 conjugated streptavidin (#S-32364, Life Technologies, 1:250) 40 minutes at room temperature. In case of Tom20, endogenous peroxidase was blocked using 0.3% H2O2 for 15 min, the sections were washed and incubated with respectively goat anti-rabbit IgG poly-HRP (#32260, Invitrogen) or goat anti-mouse IgG poly-HRP (#32230, Invitrogen ) for 1 hour at room temperature. The signal was developed with Tyramide-AF488 (#B40953, Invitrogen). After extensive washing, all sections were incubated with 10% mouse serum (#M5905, Sigma-Aldrich) for 15 min, followed by incubation with Cy3 conjugated mouse anti-human GFAP (#C9205, Sigma-Aldrich, 1:50) in blocking buffer for 1 hour at room temperature. Sections were washed again, counter stained with 4’,6-diamidino-2-phenylindole (DAPI, #1.24653, Sigma-Aldrich) and mounted in Mowiol (#81381, Sigma-Aldrich). Primary antibodies were omitted to control for non-specific binding. Images (z-stacks) were acquired using a Leica SP5 confocal microscope with Leica LAS AF software and processed using Fiji and LAS X. All settings were kept the same.
Immunofluorescence analysis of NOD EAE samples
Mice were intracardially perfused with ice cold 1X PBS followed by ice cold 4% PFA. Brains were harvested, post-fixed in 4% PFA overnight at 4°C, followed by dehydration in 30% sucrose for 2 days at 4°C. Brains were then frozen in OCT (#4583, Sakura) and 30 μm sections were obtained by cryostat on SuperFrost Plus slides (#22–037-246, Fisher Scientific). A hydrophobic barrier was drawn (#H-4000, Vector Laboratories) and sections were washed 3 times for 5 minutes with 0.1% Triton X-100 in PBS (PBS-T). Sections were blocked with 5% donkey serum (#D9663, Sigma-Aldrich) in 0.1% PBS-T at RT for 30 minutes. Sections were then incubated with primary antibodies diluted in blocking buffer overnight at 4C. Following primary antibody incubation, sections were washed 3 times with 0.1% PBS-T and incubated with secondary antibodies diluted in blocking buffer for 2 hours at RT. Following secondary incubation, sections were washed 3 times with 0.1% PBS-T, dried, and coverslips were mounted using Fluoromount-G without DAPI (#00–4958-02, Thermo Fisher Scientific). Primary antibodies used in this study were: anti-GFAP mouse mAb (#MAB360, Millipore, 1:500), anti-COX4-I1 goat polyclonal Ab (#AF5814, R&D Systems, 1:100), anti-NF-κB p65 (acetyl-Lys310) rabbit polyclonal Ab (#SAB4502616, Sigma-Aldrich, 1:100), anti-mouse c3d goat polyclonal antibody (#AF2655, R&D Systems, 1:100), anti-MAVS rabbit mAb (#4983, Cell Signaling, 1:100), and anti-cPLA2 mouse mAB (#sc-454, Santa Cruz Biotechnology, 1:100). Secondary antibodies used in this study were: AF647 conjugated anti-mouse IgG donkey Ab (#ab150107, Abcam), AF488 conjugated anti-rabbit IgG goat Ab, (#A11008, Thermo Fisher Scientific), AF647 anti-rabbit IgG donkey fab fragment (#711–607-003, Jackson Immunoresearch, 2 mg/mL stock), Rhodamine anti-mouse IgG donkey fab fragment (#715–297-003, Jackson ImmunoResearch, 2 mg/mL stock), AF488 conjugated anti-goat IgG donkey antibody (#A11055, Thermo Fisher Scientific), AF405 conjugated anti-mouse IgG goat antibody (#A31553, Thermo Fisher Scientific) and AF405 conjugated anti-rabbit IgG goat antibody (#A31556, Thermo Fisher Scientific) all at 1:500 working dilution. Dual labeling using mouse and rabbit primary antibodies was accomplished by incubating with a single primary antibody on Day 1, staining with the anti-mouse Fab fragment on Day 2, washing 6 times with PBS-T, followed by incubation with the remainder of primary and secondary antibodies as described above.
Metabolic Profiling
Astrocyte cultures were washed with cold 1X PBS and then lysed with 80% of HPLC grade methanol (#34860, Sigma-Aldrich) inosine-15N4, thymine-d4 and glycocholate-d4 internal standards (#NLM-4264, #DLM-1089 and #DLM-2742, Cambridge Isotope Laboratories) for polar metabolites measurement or HPLC grade isopropanol (#34863, Sigma-Aldrich) containing 1,2-didodecanoyl-sn-glycero-3-phosphocholine as an internal standard (#850325, Avanti Polar Lipids) for lipid metabolites measurement, 300 μL solvent for each 700,000 cells. The positive and negative ion mode analysis for both polar or lipid metabolites profiles were performed at the Broad Institute.
Hydrophilic interaction liquid chromatography (HILIC) analyses of polar metabolites were conducted in the positive ion mode using a Nexera X2 U-HPLC (Shimadzu)-Q Exactive orbitrap (Thermo Fisher Scientific) LC-MS instrument. Cell extracts for polar metabolites profile (10μL) were diluted using 90 μL of 74.9:24.9:0.2 v/v/v acetonitrile/methanol/formic acid containing stable valine-d8 and phenylalanine-d8 (#DLM-488 and #DLM-372, Cambridge Isotope Laboratories) as internal standards. The samples were injected directly onto a 150 × 2 mm Atlantis HILIC column (Waters). The column was eluted isocratically at a flow rate of 250 μL/min with 5% mobile phase A (10 mM ammonium formate and 0.1% formic acid in water) for 1 min followed by a linear gradient to 40% mobile phase B (acetonitrile with 0.1% formic acid) over 10 min. The electrospray ionization voltage was 3.5 kV and data were acquired using full scan analysis over m/z 70–800 at 70,000 resolution. HILIC analyses of polar metabolites in the negative ion mode were done using a Nexera X2 U-HPLC (Shimadzu) coupled to a Q Exactive Plus orbitrap mass spectrometer (Thermo Fisher Scientific). Extracts for polar metabolites profiles (10μL) were directly injected onto a 150 × 2.0 mm Luna NH2 column (Phenomenex) that was eluted at a flow rate of 400 μL/min with initial conditions of 10% mobile phase A (20 mM ammonium acetate and 20 mM ammonium hydroxide in water) and 90% mobile phase B (10 mM ammonium hydroxide in 75:25 v/v acetonitrile/methanol) followed by a 10 min linear gradient to 100% mobile phase A. MS full scan data were acquired over m/z 70–750. Instrument settings were: source voltage −3.0 kV, source temperature 325°C, capillary temperature 350°C, sheath gas 55, auxiliary gas 10, and resolution 70,000.
Cell extracts for lipid metabolites profile were analyzed using a Nexera X2 U-HPLC (Shimadzu) coupled to an Exactive Plus orbitrap mass spectrometer (Thermo Fisher Scientific). Extracts (10μL) were injected onto a ACQUITY UPLC BEH C8 column (1.7μm, 2.1 × 100 mm; Waters). The column was initially eluted isocratically at a flow rate of 450 μL/min with 80% mobile phase A (95:5:0.1 vol/vol/vol 10mM ammonium acetate/methanol/formic acid) for 1 minute followed by a linear gradient to 80% mobile-phase B (99.9:0.1 vol/vol methanol/formic acid) over 2 minutes, a linear gradient to 100% mobile phase B over 7 minutes, then 3 minutes at 100% mobile-phase B. MS analyses were carried out using electrospray ionization in the positive ion mode (source voltage was 3kV, source temperature was 300°C, sheath gas was 50.0, auxillary gas was 15) using full scan analysis over m/z 200–1100 and at 70,000 resolution. For negative ion mode analysis of lipid metabolites, samples were prepared by adding 90 μL of methanol containing PGE2-d4 (#314010, Cayman Chemical) as an internal standard to cell extract for lipid metabolites profile (30 μL) and injected (10 μL) onto a 150 × 2 mm ACQUITY T3 column (Waters). The column was eluted isocratically at a flow rate of 400 μL/min with 25% mobile phase A (0.1% formic acid in water) for 1 min followed by a linear gradient to 100% mobile phase B (acetonitrile with 0.1% formic acid) over 11 mins. MS analyses were carried out using electrospray ionization in the negative ion mode using (source voltage was −3.5 kV, source temperature was 320C, sheath gas was 45.0, auxillary gas was 10). All samples were centrifuged at 9,000X g for 10 min at 4C and the supernatants were injected for analysis. LC-MS data were processed and visually inspected using TraceFinder 3.1 software (Thermo Fisher Scientific).
Measurement of Miglustat in CNS
Brain tissue was isolated from NOD EAE mice received 2 weeks of oral administration of 600mg/kg Miglustat. Weighed brain tissue was homogenized using a Dounce homogenizer (VWR), in the extraction solvent using a Bligh and Dyer type liquid-liquid extraction. Chloroform (#650498, Sigma-Aldrich) and methanol (#34860, Sigma-Aldrich) in HPLC grade were used as solvent. The internal standard was dissolved in 2:1 chloroform-methanol. After homogenization for 2 mins, the liquid was transferred to a 8 ml glass vial and spun in a centrifuge at 1000g for 20 minutes. This resulted in the formation of a protein disk and insoluble materials in the middle. The bottom layer was removed using a glass Pasteur pipet and transferred to a clean vial for evaporation under a stream of gentle nitrogen. The dried sample was reconstituted in 100 μl of 2:1 chloroform-methanol, and analyzed using the HPLC-MS.
QUANTIFICATION AND STATISTICAL ANALYSIS
Statistical analyses were performed with Prism 8 software (GraphPad), using the unpaired T test with parametric test and same S.D. settings in general. Regression slope test is applied for EAE clinical scores analysis only. No samples were excluded. P values of <0.05 were considered significant and all error bars represent s.e.m.. At least 3 biological repeats for each condition were included and 3 independent experiments were performed for all in vitro assays, and displayed figures are representative. No statistical methods were used to pre-determine sample sizes and no blinding was performed in this study. In the cases for in vivo experiments, the stated “n” and “N” values indicate respectively a biological replicate and an independent experiment. All statistical tests, comparisons, and sample sizes are included in the Figures and Figure Legends. All data are shown as mean ± SEM. In all cases, ***p < 0.001, **p < 0.01, *p < 0.05, ns = not statistically significant, p > 0.05.
DATA AND CODE AVAILABILITY
A page has been created in the GEO database with the accession number GEO: GSE139531. All RNA-seq data have been deposited in the GEO database.
Supplementary Material
Figure S1: Knockdown efficiency and effect on T cells, Related to Figures 1,2,3,5 and 6. (A) Expression of B4galt6, Ugcg, Cers1, Cers2, Cers4, Cers5, Cers6 in astrocytes in vivo. (unpaired T test, compared to shControl condition) (B) Effect of the knockdown of B4galt6, Ugcg, Cers1, Cers2, Cers4, Cers5 and Cers6 knockdown on T-cell response. (unpaired T test, compared to shControl condition) (C) Expression of Pla2g4a in astrocytes in vivo. (unpaired T test) (D) Effect of Pla2g4a knockdown in astrocyte on T-cell response. (E) Expression of Mavs in astrocytes in vivo. (unpaired T test) (F) Effect of Mavs knockdown in astrocyte on the T-cell response. (unpaired T test) (G) Expression of Bsg in astrocytes in vivo. (unpaired T test) (h) Expression of Pla2g4a, Mavs, Bsg, Irf1, Rela and Hk2 after siRNA knockdown in astrocytes in vitro. (unpaired T test) (I,J) Bsg (I) and Hk2 (J) protein expression in siRNA-treated astrocyte in vitro. (unpaired T test) (K) Effect of Miglustat treatment on T-cell response. Samples in (A,B,C,D,E,F,H,I) were analyzed 50–51 days after NOD EAE induction. (unpaired T test, intensity normalized to siControl condition)
Figure S2: Analysis of cPLA2-MAVS interaction, Related to Figures 3 and 4 (A) Effect of LacCer and cPLA2 inhibition on MAVS oligomerization. Murine astrocytes were treated with vehicle, 10 μM arachidonic acid, 10 μM LacCer + 1 μM cPLA2i or LacCer alone for 18 hours and mitochondria was isolated for SDD-AGE and western blot. (unpaired T test, compared to all, intensity normalized to vehicle condition) (B) Immunofluorescent analysis of cPLA2-MAVS co-localization within astrocytes in progressive NOD EAE. Brain slides were obtained from naive and EAE NOD mice and Gfap, Mavs, Cox4, cPLA2 (Pla2g4a) were detected by immunoflourescence. (C) Quantification of cPLA2 co-localization with the mitochondrial marker Cox4, and cPLA2-MAVS co-localization in Gfap+ astrocytes and Gfap−cells. (unpaired T test) (D) cPLA2 constructs used. (E,F) His-tagged human cPLA2 (eGFP-cPLA2, eGFP-cPLA2(D43N), eGFP-C2-domain; full-length, S111P, I399A/L400A/L552A, R485H, D549A, S505A, S505E) and Flag-tagged human MAVS were expressed in HEK293 cells, protein complexes were pulled down with anti-flag antibodies and analyzed by western blot. (G) Binding of LacCer to cPLA2 mutants analyzed using the lipid-protein overlay assay. (H) Effect of mutant cPLA2 in induction of MAVS oligomerization. MAVS and cPLA2 (WT, S111P, I399A/L400A/L552A, R485H) were expressed in HEK293 cell and mitochondria was isolated for SDD-AGE and western blot.
Figure S3: Effect of Mavs knockdown in astrocytes on NF-κB signaling, Related to Figure 3. Green and red indicate increased and decreased expression of indicated genes in the shMavs group when compared to the shControl group, respectively.
Figure S4: Metabolic effects of cPLA2-MAVS signaling, Related to Figures 5. (A-C) Effect of cPLA2i on carboxyl derivatives, lipids and purines (A) saturated and unsaturated fatty acids (B) and metabolites linked to glycolysis, TCA cycle and pyruvate metabolism (C) in astrocytes. Red and green indicates increase and decrease, respectively, by cPLA2i treatment. The fold change in metabolite levels is shown in log2. (D) Mitochondrial stress test on MAVS-deficient astrocytes stimulated or not for 12 hours with TNFα and IFNγ. (unpaired T test) (E) Mitochondrial pyruvate levels in MAVS knockout astrocytes. (unpaired T test) (F) Lactate release by MAVS knockout astrocytes stimulated by TNFα and IFNγ for 1 hour. (unpaired T test, compared to naïve vehicle WT condition) (G) No Effect of cPLA2 or MAVS knockdown in astrocytes on mitochondrial stress test. A corresponding control condition for the experiment shown in Figure 5H (H) HK2 co-localization with MAVS in primary murine astrocytes determined by confocal microscopy. Bar plots depict the ratio of HK2-MAVS co-localization. (I) Effect of HK2 knockdown in astrocytes on lactate release and mitochondrial pyruvate levels. (unpaired T test)
Figure S5: Effect of Miglustat on cPLA2-MAVS signaling, Related to Figure 6. (A) EAE development in NOD mice treated with Miglustat and lentiviral constructs expressing shRNAs targeting Mavs or control in astrocytes administered at the time points indicated by the arrows. (n=5, N=2, Regression slope T test, compared to all) (B) Quantification of MAVS and cPLA2 co-localization in astrocytes (MAVS+cPLA2+ double positive astrocytes) in C3+GFAP+ or C3−GFAP+ astrocytes. (unpaired T test) (C) mRNA expression determined by qPCR in murine astrocytes polarized under A1 condition (TNFα, IL1α and C1q) in the presence of vehicle or 10 μM LacCer. Expression of “A1” C3+GFAP+ astrocyte marker genes. Data are shown mean value relative to resting astrocytes.
Table S1: List of Oligonucleotides Used, Related to Key Resources Table.
| REAGENT or RESOURCE | SOURCE | IDENTIFIER |
|---|---|---|
| Antibodies | ||
| anti-GFAP rabbit mAb | Roche | Cat#05269784001 |
| Texas Red conjugated goat anti-rabbit IgG | Thermo Fisher Scientific | Cat# T-2767; RRID:AB_2556776 |
| FITC anti-CD11b | eBioscience | Cat#11–0112–85; RRID: AB_464936 |
| APC anti-CD45 | eBioscience | Cat#17–0451–83; RRID:AB_469393 |
| PerCP anti-Ly-6C | Biolegend | Cat#128028; RRID:AB_10897805 |
| PE anti-mouse CD45R/B220 | BD Biosciences | Cat#553089; RRID:AB_394619 |
| PE anti-mouse TER-119 | Biolegend | Cat#116207; RRID:AB_313708 |
| PE anti-O4 | R&D systems | Cat#FAB1326P; RRID:AB_664169 |
| PE anti-CD105 | eBioscience | Cat#12–1051–82; RRID:AB_657524 |
| PE anti-CD140a | eBioscience | Cat#12–1401–81; RRID:AB_657615 |
| PE anti-Ly-6G | Biolegend | Cat#127608; RRID:AB_2129141 |
| BV421 anti-CD3, | BioLegend | Cat#100227; RRID:AB_10900227 |
| BV605 anti-CD4 | BioLegend | Cat#100547; RRID:AB_11125962 |
| FITC anti-IFNγ | BioLegend | Cat#505806; RRID:AB_315400 |
| PE anti-IL-17a | eBioscience | Cat#12–7177–81; RRID:AB_763582 |
| APC anti-IL-10 | BioLegend | Cat#505010; RRID:AB_315364 |
| PerCP-Cy5.5 anti-FoxP3 | eBioscience | Cat#45–5773–82; RRID:AB_914351 |
| CD11b Microbead for mouse and human | Miltenyi | Cat#130–049–601 |
| anti-Histone H3 rabbit polyclonal antibody | Sigma-Aldrich | Cat#07–690; RRID:AB_417398 |
| anti-Lamin B1 rabbit mAb (HRP Conjugate) | Cell Signaling Technology | Cat#15068S; RRID:AB_2798695 |
| anti-NF-κB p65 rabbit mAb | Cell Signaling Technology | Cat#8242S; RRID:AB_10859369 |
| anti-Bsg rabbit mAb | Thermo Fisher Scientific | Cat#MA5–32534; RRID:AB_2809811 |
| anti-Hk2 rabbit mAb | Cell signaling Technology | Cat#2867; RRID:AB_2232946 |
| anti-p65 rabbit mAb | Cell Signaling Technology | Cat#8242; RRID:AB_10859369 |
| control IgG isotype antibody | Cell Signaling Technology | Cat#3900S; RRID:AB_1550038 |
| anti-MAVS rabbit mAb | Cell Signaling Technology | Cat#4983; RRID:AB_823566 |
| anti-MAVS rabbit mAb | Cell Signaling Technology | Cat#24930S; RRID:AB_2798889 |
| anti-MAVS mouse mAb | Santa Cruz Biotechnology | Cat#sc-365333; RRID:AB_10844335 |
| anti-MAVS rabbit polyclonal Ab | abcam | Cat#ab189109 |
| anti-cPLA2 (4–4B-3C) mouse mAb | Santa Cruze Biotechnology | Cat#sc-454; RRID:AB_627288 |
| anti-cPLA2 rabbit mAb | Cell Signaling Technology | Cat#2832; RRID:AB_2164442 |
| anti-HK2 rabbit mAb | abcam | Cat#ab228819 |
| anti-HK2 rabbit mAb | Cell Signaling Technology | Cat#2867; RRID:AB_2232946 |
| anti-HK2 (B8) mouse mAb | Santa Cruz Biotechnology | Cat#sc-374091; RRID:AB_10917915 |
| anti-flag mouse mAb | Sigma-Aldrich | Cat#F1804; RRID:AB_262044 |
| anti-flag rabbit polyclonal Ab | Sigma-Aldrich | Cat#F7425; RRID:AB_439687 |
| anti-GFP rabbit polyclonal Ab | abcam | Cat#ab290; RRID:AB_303395 |
| anti-rabbit IgG HRP-linked Ab | Cell Signaling Technology | Cat#7074S; RRID:AB_2099233 |
| anti-mouse IgG HRP-linked Ab | Cell Signaling Technology | Cat#7076S; RRID:AB_330924 |
| goat anti-rabbit IgG poly-HRP | Invitrogen | Cat#32260; RRID:AB_1965959 |
| goat anti-mouse IgG poly-HRP | Invitrogen | Cat#32230; RRID:AB_1965958 |
| anti-Tom20 rabbit polyclonal Ab | Santa Cruz Biotechnology | Cat#sc-11415; RRID:AB_2207533 |
| AF635 conjugated anti-mouse IgG goat Ab | Life Technologies | Cat#A31574; RRID:AB_1500640 |
| biotinylated anti-rabbit immunoglobulins goat Ab | Agilent/Dako | Cat#E0432; RRID:AB_2313609 |
| Cy3 conjugated mouse anti-human GFAP | Sigma-Aldrich | Cat#C9205; RRID:AB_476889 |
| anti-GFAP mouse mAb | Millipore | Cat#MAB360; RRID:AB_11212597 |
| anti-COX4-I1 goat polyclonal Ab | R&D Systems | Cat#AF5814; RRID:AB_2085286 |
| anti-NF-κB p65 (acetyl-Lys310) rabbit polyclonal Ab | Sigma-Aldrich | Cat#SAB4502616; RRID:AB_10745506 |
| anti-mouse c3d goat polyclonal antibody | R&D Systems | Cat#AF2655; RRID:AB_2066622 |
| AF488 conjugated anti-rabbit IgG goat Ab | Thermo Fisher Scientific | Cat#A11008; RRID:AB_143165 |
| AF488 conjugated anti-goat IgG donkey antibody | Thermo Fisher Scientific | Cat#A11055; RRID:AB_2534102 |
| AF647 anti-rabbit IgG donkey fab fragment | Jackson Immunoresearch | Cat#711–607–003; RRID:AB_2340626 |
| AF647 conjugated anti-mouse IgG donkey Ab | abcam | Cat#ab150107 |
| Rhodamine anti-mouse IgG donkey fab fragment | Jackson Immunoresearch | Cat#715–297–003; RRID:AB_2340836 |
| AF405 conjugated anti-mouse IgG goat antibody | Thermo Fisher Scientific | Cat#A31553; RRID:AB_221604 |
| AF405 conjugated anti-rabbit IgG goat antibody | Thermo Fisher Scientific | Cat#A31556; RRID:AB_221605 |
| Bacterial and Virus Strains | ||
| Non-viable desiccated M.Tuberculosis H-37Ra | BD Bioscience | Cat#231141 |
| NEB Stable E. Coli | New England Biolabs | Cat#C3040 |
| NEB 10-beta Competent E. coli | New England Biolabs | Cat#C3019 |
| Biological Samples | ||
| Human fetal astrocytes | Laboratory of Developmental Biology, Eunice Kennedy Shriver National Institute of Child Health and Human Development | N/A |
| Human pathology samples | University of Montreal Health Centre | N/A |
| Paraffin-embedded brain sections | Neuropathology Department of the Notre Dame Hospital | N/A |
| Chemicals, Peptides, and Recombinant Proteins | ||
| MOG35–55 peptide | Genemed Synthesis | Cat#110582 |
| Incomplete Freund’s adjuvant | BD Bioscience | Cat#263910 |
| Miglustat hydrochloride | MedChemExpress | Cat#HY-17020A |
| Miglustat | BOC Sciences | Cat#72599–27–0 |
| Pertussis toxin | List biological Laboratories | Cat#180 |
| Papain | Sigma-Aldrich | Cat#P4762 |
| Collagenase D | Roche | Cat#11088858001 |
| DNase I | Thermo Fisher Scientific | Cat#90083 |
| DNase I | QIAGEN | Cat#79254 |
| Percoll | GE Healthcare | Cat#17–5445–01 |
| UltraComp eBeads™ Compensation Beads | Invitrogen | Cat#01–2222–41 |
| PMA (phorbol 12-myristate 13-acetate) | Sigma-Aldrich | Cat#P1585 |
| Ionomycin | Sigma-Aldrich | Cat#I9657 |
| GolgiSTOP | BD Biosciences | Cat#554724 |
| Taqman Fast Universal PCR Master Mix | Life Technologies | Cat#4367846 |
| Fast SYBR Green Master Mix | Thermo Fisher Scientific | Cat#4385612 |
| Poly-L-Lysine | Sigma-Aldrich | Cat#P4707 |
| Polybrene | Sigma-Aldrich | Cat#TR-1003-G |
| INTERFERin | Polyplus transfection | Cat#409 |
| Mouse TNFα recombinant protein | R&D systems | Cat#410-MT-010 |
| Human TNFα recombinant protein | R&D systems | Cat#210-TA-020 |
| Mouse IFNγ recombinant protein | R&D systems | Cat#485-MI-100 |
| Human IFNγ recombinant protein | R&D systems | Cat#285-IF-100 |
| Accutase solution | Sigma-Aldrich | Cat#A6964 |
| Pyrrophenone | Santa Cruz Biotechnology | Cat#sc-296161 |
| N-acetyl cysteine | Sigma-Aldrich | Cat#A7250 |
| HBEGF | Sigma-Aldrich | Cat#E4643 |
| Rat II-1α recombinant protein | Sigma-Aldrich | Cat#I3901 |
| Human TNFα recombinant protein | Cell Signaling Technology | Cat#8902SF |
| Human Complement Component C1q, Native Protein | MyBioSource | Cat#MBS143105 |
| transferrin | Sigma-Aldrich | Cat#T-1147 |
| BSA | Sigma-Aldrich | Cat#A8806 |
| putrescine | Sigma-Aldrich | Cat#P5780 |
| progesterone | Sigma-Aldrich | Cat#P8783 |
| sodium selenite | Sigma-Aldrich | Cat#S5261 |
| Formaldehyde solution, molecular grade | Sigma-Aldrich | Cat#F8775 |
| Halt Protease and Phosphatase Inhibitor Cocktail | Thermo Fisher Scientific | Cat#78441 |
| SuperSignal West Femto Maximum Sensitivity Substrate | Thermo Fisher Scientific | Cat#34095 |
| KwikQuant Ultra Digital-ECL Substrate Solution | Kindle Biosciences | Cat#R1002 |
| Protein A-Dynabeads magnetic beads | Thermo Fisher Scientific | Cat#10001D |
| Protein G-Dynabeads magnetic beads | Thermo Fisher Scientific | Cat#10003D |
| SeaKem GOLD agarose | Lonza | Cat#50152 |
| Laminin | Sigma-Aldrich | Cat#L2020 |
| MitoTracker™ Red CMXRos | Thermo Fisher Scientific | Cat#M7512 |
| donkey serum | Sigma-Aldrich | Cat#D9663 |
| goat serum | Sigma-Aldrich | Cat#G9023 |
| mouse serum | Sigma-Aldrich | Cat#M5905 |
| DAPI Fluoromount-G | SouthernBiotech | Cat#0100–20 |
| NuPAGE LDS sample buffer | Invitrogen | Cat#NP0007 |
| Hot Start Taq 2X Master Mix | New England Biolabs | Cat#M0496 |
| FuGENE HD Transfection Reagent | Promega | Cat#E2311 |
| UK-5099 | Tocris Bioscience | Cat#4186 |
| methylglyoxal solution | Sigma-Aldrich | Cat#M0252 |
| Tyramide-AF488 | Invitrogen | Cat#B40953 |
| DAPI | Sigma-Aldrich | Cat#1.24653 |
| Mowiol | Sigma-Aldrich | Cat#81381 |
| OCT | Sakura | Cat#4583 |
| 2-DG | Sigma-Aldrich | Cat#D6134 |
| Critical Commercial Assays | ||
| Intracellular antibody labeling kit | eBioscience | Cat#00–5523 |
| Aqua LIVE/DEAD cell stain kit | Thermo Fisher Scientific | Cat#L34966 |
| RNeasy Mini Kit | QIAGEN | Cat#74106 |
| custom-made astrocyte-targeted nCounter Gene Expression code set | NanoString; (Rothhammer et al., 2017) | N/A |
| High-Capacity cDNA Reverse Transcription Kit | Life Technologies | Cat#4368813 |
| ViraPower Packaging mix | Thermo Fisher Scientific | Cat#K497500 |
| Lenti-X concentrator kit | Clontech | Cat#631231 |
| CytoTox 96 Nonradioactive Cytotoxicity Assay kit | Promega | Cat#G1780 |
| Cell Fractionation kit | Cell Signaling Technology | Cat#9038S |
| NucleoSpin® Gel and PCR Clean-up kit | Macherey-Nagel | Cat#740609.250 |
| Mitochondria Isolation Kit | abcam | Cat#ab110170 |
| Q5® Site-Directed Mutagenesis Kit | New England Biolabs | Cat#E0554S |
| Dual-Luciferase® Reporter Assay System | Promega | Cat#E1910 |
| cellular reactive oxygen species detection assay kit | abcam | Cat#ab113851 |
| CyQUANT cell proliferation assay kit | Invitrogen | Cat#C7026 |
| L-lactate assay kit | Biomedical Research Service & Clinical Application | Cat#A-108 |
| Pierce BCA Protein Assay Kit | Thermo Fisher Scientific | Cat#23225 |
| Hexokinase Colorimetric Assay Kit | BioVision | Cat#K789 |
| EnzyChrom Pyruvate Assay Kit | BioAssay Systems | Cat#EPYR-100 |
| Seahorse XF Cell Mito Stress Test Kit | Agilent Technologies | Cat#103015–100 |
| avidin-biotin blocking kit | Thermo Fisher Scientific | Cat#004303 |
| Deposited Data | ||
| RNA-seq | This paper | GEO:GSE139531 |
| Experimental Models: Cell Lines | ||
| Human: HEK-293FT | Invitrogen | Cat#R70007 |
| Human: HEK-293 | ATCC | Cat#CRL-1573 |
| Mouse: N2A neuronal cells | ATCC | Cat#CCL-131 |
| Experimental Models: Organisms/Strains | ||
| Mouse: C57BL/6J | The Jackson Laboratory | JAX: 000664 |
| Mouse: NOD/ShiLtJ | The Jackson Laboratory | JAX: 001976 |
| Mouse: B6;129-Mavstm1Zjc/J | The Jackson Laboratory | JAX: 008634 |
| Oligonucleotides | ||
| See Table S1 | This paper | N/A |
| Recombinant DNA | ||
| pLenti-Gfap-GFP-shB4galt6 | This paper | N/A |
| pLenti-Gfap-GFP-shUgcg | This paper | N/A |
| pLenti-Gfap-GFP-shCers1 | This paper | N/A |
| pLenti-Gfap-GFP-shCers2 | This paper | N/A |
| pLenti-Gfap-GFP-shCers4 | This paper | N/A |
| pLenti-Gfap-GFP-shCers5 | This paper | N/A |
| pLenti-Gfap-GFP-shCers6 | This paper | N/A |
| pLenti-Gfap-GFP-shPla2g4a | This paper | N/A |
| pLenti-Gfap-GFP-shMavs | This paper | N/A |
| pLenti-Gfap-GFP-shBsg | This paper | N/A |
| pCMV3-C-His-PLA2G4A | Sino Biological | Cat#MG51714-CH |
| pCMV3-C-His-PLA2G4A (S111P) | This paper | N/A |
| pCMV3-C-His-PLA2G4A (I399A/L400A/L552A) | This paper | N/A |
| pCMV3-C-His-PLA2G4A (R485H) | This paper | N/A |
| pCMV3-C-His-PLA2G4A (D549A) | This paper | N/A |
| pCMV3-C-His-PLA2G4A (S505A) | This paper | N/A |
| pCMV3-C-His-PLA2G4A (S505E) | This paper | N/A |
| pCMV3-C-His-PLA2G4A (dC2) | This paper | N/A |
| pCMV3-C-His-PLA2G4A (dPL) | This paper | N/A |
| pEGFP-PLA2G4A | (Casas et al., 2006) | N/A |
| pEGFP-PLA2G4A (D43N) | (Casas et al., 2006) | N/A |
| pEGFP-N1-C2 | (Movahedi Naini et al., 2015) | N/A |
| pMP31–1 (flag-MAVS) | (Patel et al., 2012) | Addgene, Cat#45905; RRID:Addgene_45905 |
| pMP31–1 (flag-MAVS, G67A/W68A/V69A) | This paper | N/A |
| pMP31–1 (flag-MAVS, W56A) | This paper | N/A |
| pcDNA3-flag-MAVS (M2–6L) | (Qi et al., 2017) | N/A |
| pcDNA3-flag-MAVS (M2) | (Qi et al., 2017) | N/A |
| pGL4.32(luc2P/NF-kB-RE/Hygro) | Promega | Cat#E8491 |
| pRL Renilla luciferase | Promega | Cat#E2241 |
| Software and Algorithms | ||
| R v3.3.3 | The R Foundation | https://www.r-project.org/ |
| DESeq2 | (Love et al., 2014); RRID:SCR_015687 | https://bioconductor.org/packages/release/bioc/html/DESeq2.html |
| GENE-E | Broad Institute | https://software.broadinstitute.org/GENE-E/ |
| Ingenuity pathway analysis | QIAGEN; RRID:SCR_008653 | http://www.ingenuity.com/products/pathways_analysis.html |
| Fiji | (Schindelin et al., 2012); RRID:SCR_002285 | http://fiji.sc |
| Ensembl | (Yates et al., 2016); RRID:SCR_002344 | http://www.ensembl.org/ |
| JASPAR | (Sandelin et al., 2004); RRID:SCR_003030 | http://jaspar.genereg.net |
| NEBaseChanger | New England Biolabs | http://nebasechanger.neb.com/ |
| Primer3 | (Untergasser et al., 2012); RRID:SCR_003139 | http://bioinfo.ut.ee/primer3-0.4.0/ |
| Primer-Blast | (Ye et al., 2012); RRID:SCR_003095 | https://www.ncbi.nlm.nih.gov/tools/primer-blast/ |
| TraceFinder 3.1 software | Thermo Fisher Scientific | N/A |
| Prism 8 software | GraphPad | N/A |
| Other | ||
HIGHLIGHTS.
Sphingolipid drives astrocyte pathogenic activities via cPLA2-MAVS-NF-κB
cPLA2 displaces HK2 from MAVS, limiting the metabolic support of neurons by astrocytes
Miglustat suppresses astrocyte cPLA2-MAVS-NF-κB pro-inflammatory signaling
Miglustat is a candidate drug for repurposing to treat Secondary Progressive MS
ACKNOWLEDGEMENTS
This work was supported by grants NS102807, ES02530, AI126880 and ES029136 from the National Institutes of Health, and RG4111A1 and JF2161-A-5 from the National Multiple Sclerosis Society to FJQ. F.J.Q., A.P. and J.P.A. received support from the International Progressive MS Alliance. A.P. holds the senior Canada Research Chair in Multiple Sclerosis, and funds from the CIHR and the MSSC. C-C.C. received support from a postdoctoral research abroad program (104–2917-I-564 −024) from the Ministry of Science and Technology, Taiwan. C.G-V was supported by an Alfonso Martín Escudero Foundation postdoctoral fellowship, and by postdoctoral fellowship ALTF 610–2017 from the European Molecular Biology Organization. V.R. received support from an educational grant from Mallinkrodt Pharmaceuticals (A219074) and by a fellowship from the German Research Foundation (DFG RO4866 1/1). M.A.W. was supported by a training grant from the NIH and Dana-Farber Cancer Institute (T32CA207201), a postdoctoral fellowship from the NIH (F32NS101790), and a traveling neuroscience fellowship from the Program in Interdisciplinary Neuroscience at Brigham and Women’s Hospital. Human primary astrocytes are provided with the support of NIH Award Number 5R24HD000836 from Eunice Kennedy Shriver National Institute of Child Health and Human Development.
Footnotes
Declaration of Interests
Francisco J. Quintana and Lior Mayo have filed a patent for the use of Miglustat for the treatment of secondary progressive MS.
Publisher's Disclaimer: This is a PDF file of an unedited manuscript that has been accepted for publication. As a service to our customers we are providing this early version of the manuscript. The manuscript will undergo copyediting, typesetting, and review of the resulting proof before it is published in its final form. Please note that during the production process errors may be discovered which could affect the content, and all legal disclaimers that apply to the journal pertain.
REFERENCES
- Allaman I, Belanger M, and Magistretti PJ (2015). Methylglyoxal, the dark side of glycolysis. Front Neurosci 9, 23. [DOI] [PMC free article] [PubMed] [Google Scholar]
- Alvarez JI, Dodelet-Devillers A, Kebir H, Ifergan I, Fabre PJ, Terouz S, Sabbagh M, Wosik K, Bourbonniere L, Bernard M, et al. (2011). The Hedgehog pathway promotes blood-brain barrier integrity and CNS immune quiescence. Science (New York, NY) 334, 1727–1731. [DOI] [PubMed] [Google Scholar]
- Anderson MA, Burda JE, Ren Y, Ao Y, O’Shea TM, Kawaguchi R, Coppola G, Khakh BS, Deming TJ, and Sofroniew MV (2016). Astrocyte scar formation aids central nervous system axon regeneration. Nature 532, 195–200. [DOI] [PMC free article] [PubMed] [Google Scholar]
- Ascherio A, Munger KL, and Lunemann JD (2012). The initiation and prevention of multiple sclerosis. Nature reviews Neurology 8, 602–612. [DOI] [PMC free article] [PubMed] [Google Scholar]
- Baecher-Allan C, Kaskow BJ, and Weiner HL (2018). Multiple Sclerosis: Mechanisms and Immunotherapy. Neuron 97, 742–768. [DOI] [PubMed] [Google Scholar]
- Bakshi R, Yeste A, Patel B, Tauhid S, Tummala S, Rahbari R, Chu R, Regev K, Kivisakk P, Weiner HL, et al. (2016). Serum lipid antibodies are associated with cerebral tissue damage in multiple sclerosis. Neurology(R) neuroimmunology & neuroinflammation 3, e200. [DOI] [PMC free article] [PubMed] [Google Scholar]
- Barthelmes J, de Bazo AM, Pewzner-Jung Y, Schmitz K, Mayer CA, Foerch C, Eberle M, Tafferner N, Ferreiros N, Henke M, et al. (2015). Lack of ceramide synthase 2 suppresses the development of experimental autoimmune encephalomyelitis by impairing the migratory capacity of neutrophils. Brain, behavior, and immunity 46, 280–292. [DOI] [PubMed] [Google Scholar]
- Blaho VA, Galvani S, Engelbrecht E, Liu C, Swendeman SL, Kono M, Proia RL, Steinman L, Han MH, and Hla T (2015). HDL-bound sphingosine-1-phosphate restrains lymphopoiesis and neuroinflammation. Nature 523, 342–346. [DOI] [PMC free article] [PubMed] [Google Scholar]
- Bouzier-Sore AK, and Pellerin L (2013). Unraveling the complex metabolic nature of astrocytes. Frontiers in cellular neuroscience 7, 179. [DOI] [PMC free article] [PubMed] [Google Scholar]
- Buck MD, Sowell RT, Kaech SM, and Pearce EL (2017). Metabolic Instruction of Immunity. Cell 169, 570–586. [DOI] [PMC free article] [PubMed] [Google Scholar]
- Buskiewicz IA, Montgomery T, Yasewicz EC, Huber SA, Murphy MP, Hartley RC, Kelly R, Crow MK, Perl A, Budd RC, et al. (2016). Reactive oxygen species induce virus-independent MAVS oligomerization in systemic lupus erythematosus. Science signaling 9, ra115. [DOI] [PMC free article] [PubMed] [Google Scholar]
- Casas J, Gijon MA, Vigo AG, Crespo MS, Balsinde J, and Balboa MA (2006). Overexpression of cytosolic group IVA phospholipase A2 protects cells from Ca2+-dependent death. J Biol Chem 281, 6106–6116. [DOI] [PubMed] [Google Scholar]
- Cervenka I, Agudelo LZ, and Ruas JL (2017). Kynurenines: Tryptophan’s metabolites in exercise, inflammation, and mental health. Science (New York, NY) 357. [DOI] [PubMed] [Google Scholar]
- Choi HB, Gordon GR, Zhou N, Tai C, Rungta RL, Martinez J, Milner TA, Ryu JK, McLarnon JG, Tresguerres M, et al. (2012). Metabolic communication between astrocytes and neurons via bicarbonate-responsive soluble adenylyl cyclase. Neuron 75, 1094–1104. [DOI] [PMC free article] [PubMed] [Google Scholar]
- Chung WS, Clarke LE, Wang GX, Stafford BK, Sher A, Chakraborty C, Joung J, Foo LC, Thompson A, Chen C, et al. (2013). Astrocytes mediate synapse elimination through MEGF10 and MERTK pathways. Nature 504, 394–400. [DOI] [PMC free article] [PubMed] [Google Scholar]
- Cumings JN, and Goodwin H (1968). Sphingolopids and phospholipids of myelin in multiple sclerosis. Lancet (London, England) 2, 664–665. [DOI] [PubMed] [Google Scholar]
- Dang PT, Bui Q, D’Souza CS, and Orian JM (2015). Modelling MS: Chronic-Relapsing EAE in the NOD/Lt Mouse Strain. Curr Top Behav Neurosci 26, 143–177. [DOI] [PubMed] [Google Scholar]
- Das S, Rafter JD, Kim KP, Gygi SP, and Cho W (2003). Mechanism of group IVA cytosolic phospholipase A(2) activation by phosphorylation. J Biol Chem 278, 41431–41442. [DOI] [PubMed] [Google Scholar]
- Dessen A, Tang J, Schmidt H, Stahl M, Clark JD, Seehra J, and Somers WS (1999). Crystal structure of human cytosolic phospholipase A2 reveals a novel topology and catalytic mechanism. Cell 97, 349–360. [DOI] [PubMed] [Google Scholar]
- Du X, Wen J, Wang Y, Karmaus PWF, Khatamian A, Tan H, Li Y, Guy C, Nguyen TM, Dhungana Y, et al. (2018). Hippo/Mst signalling couples metabolic state and immune function of CD8alpha(+) dendritic cells. Nature 558, 141–145. [DOI] [PMC free article] [PubMed] [Google Scholar]
- Eberle M, Ebel P, Mayer CA, Barthelmes J, Tafferner N, Ferreiros N, Ulshofer T, Henke M, Foerch C, de Bazo AM, et al. (2015). Exacerbation of experimental autoimmune encephalomyelitis in ceramide synthase 6 knockout mice is associated with enhanced activation/migration of neutrophils. Immunol Cell Biol 93, 825–836. [DOI] [PubMed] [Google Scholar]
- Erny D, Hrabe de Angelis AL, Jaitin D, Wieghofer P, Staszewski O, David E, Keren-Shaul H, Mahlakoiv T, Jakobshagen K, Buch T, et al. (2015). Host microbiota constantly control maturation and function of microglia in the CNS. Nature neuroscience 18, 965–977. [DOI] [PMC free article] [PubMed] [Google Scholar]
- Farez MF, Quintana FJ, Gandhi R, Izquierdo G, Lucas M, and Weiner HL (2009). Toll-like receptor 2 and poly(ADP-ribose) polymerase 1 promote central nervous system neuroinflammation in progressive EAE. Nature immunology 10, 958–964. [DOI] [PMC free article] [PubMed] [Google Scholar]
- Galluzzi L, Kepp O, and Kroemer G (2012). Mitochondria: master regulators of danger signalling. Nature reviews Molecular cell biology 13, 780–788. [DOI] [PubMed] [Google Scholar]
- Geiger R, Rieckmann JC, Wolf T, Basso C, Feng Y, Fuhrer T, Kogadeeva M, Picotti P, Meissner F, Mann M, et al. (2016). L-Arginine Modulates T Cell Metabolism and Enhances Survival and Anti-tumor Activity. Cell 167, 829–842.e813. [DOI] [PMC free article] [PubMed] [Google Scholar]
- Gupta S, Knight AG, Gupta S, Keller JN, and Bruce-Keller AJ (2012). Saturated long-chain fatty acids activate inflammatory signaling in astrocytes. J Neurochem 120, 1060–1071. [DOI] [PMC free article] [PubMed] [Google Scholar]
- Halfmann R, and Lindquist S (2008). Screening for amyloid aggregation by Semi-Denaturing Detergent-Agarose Gel Electrophoresis. J Vis Exp. [DOI] [PMC free article] [PubMed] [Google Scholar]
- Hotamisligil GS (2017). Inflammation, metaflammation and immunometabolic disorders. Nature 542, 177–185. [DOI] [PubMed] [Google Scholar]
- Jeyakumar M, Dwek RA, Butters TD, and Platt FM (2005). Storage solutions: treating lysosomal disorders of the brain. Nature reviews Neuroscience 6, 713–725. [DOI] [PubMed] [Google Scholar]
- Kanter JL, Narayana S, Ho PP, Catz I, Warren KG, Sobel RA, Steinman L, and Robinson WH (2006). Lipid microarrays identify key mediators of autoimmune brain inflammation. Nature medicine 12, 138–143. [DOI] [PubMed] [Google Scholar]
- Kornberg MD, Bhargava P, Kim PM, Putluri V, Snowman AM, Putluri N, Calabresi PA, and Snyder SH (2018). Dimethyl fumarate targets GAPDH and aerobic glycolysis to modulate immunity. Science (New York, NY) 360, 449–453. [DOI] [PMC free article] [PubMed] [Google Scholar]
- Kuhlmann T, Ludwin S, Prat A, Antel J, Bruck W, and Lassmann H (2017). An updated histological classification system for multiple sclerosis lesions. Acta Neuropathol 133, 13–24. [DOI] [PubMed] [Google Scholar]
- Leslie CC (2015). Cytosolic phospholipase A(2): physiological function and role in disease. Journal of lipid research 56, 1386–1402. [DOI] [PMC free article] [PubMed] [Google Scholar]
- Liddelow SA, and Barres BA (2017). Reactive Astrocytes: Production, Function, and Therapeutic Potential. Immunity 46, 957–967. [DOI] [PubMed] [Google Scholar]
- Liddelow SA, Guttenplan KA, Clarke LE, Bennett FC, Bohlen CJ, Schirmer L, Bennett ML, Munch AE, Chung WS, Peterson TC, et al. (2017). Neurotoxic reactive astrocytes are induced by activated microglia. Nature 541, 481–487. [DOI] [PMC free article] [PubMed] [Google Scholar]
- Liu G, Yang K, Burns S, Shrestha S, and Chi H (2010). The S1P(1)-mTOR axis directs the reciprocal differentiation of T(H)1 and T(reg) cells. Nature immunology 11, 1047–1056. [DOI] [PMC free article] [PubMed] [Google Scholar]
- Love MI, Huber W, and Anders S (2014). Moderated estimation of fold change and dispersion for RNA-seq data with DESeq2. Genome Biol 15, 550. [DOI] [PMC free article] [PubMed] [Google Scholar]
- Maceyka M, and Spiegel S (2014). Sphingolipid metabolites in inflammatory disease. Nature 510, 58–67. [DOI] [PMC free article] [PubMed] [Google Scholar]
- Machler P, Wyss MT, Elsayed M, Stobart J, Gutierrez R, von Faber-Castell A, Kaelin V, Zuend M, San Martin A, Romero-Gomez I, et al. (2016). In Vivo Evidence for a Lactate Gradient from Astrocytes to Neurons. Cell metabolism 23, 94–102. [DOI] [PubMed] [Google Scholar]
- Mandala S, Hajdu R, Bergstrom J, Quackenbush E, Xie J, Milligan J, Thornton R, Shei GJ, Card D, Keohane C, et al. (2002). Alteration of lymphocyte trafficking by sphingosine-1-phosphate receptor agonists. Science (New York, NY) 296, 346–349. [DOI] [PubMed] [Google Scholar]
- Mascanfroni ID, Takenaka MC, Yeste A, Patel B, Wu Y, Kenison JE, Siddiqui S, Basso AS, Otterbein LE, Pardoll DM, et al. (2015). Metabolic control of type 1 regulatory T cell differentiation by AHR and HIF1-alpha. Nature medicine 21, 638–646. [DOI] [PMC free article] [PubMed] [Google Scholar]
- Mathupala SP, Ko YH, and Pedersen PL (2009). Hexokinase-2 bound to mitochondria: cancer’s stygian link to the “Warburg Effect” and a pivotal target for effective therapy. Seminars in cancer biology 19, 17–24. [DOI] [PMC free article] [PubMed] [Google Scholar]
- Matloubian M, Lo CG, Cinamon G, Lesneski MJ, Xu Y, Brinkmann V, Allende ML, Proia RL, and Cyster JG (2004). Lymphocyte egress from thymus and peripheral lymphoid organs is dependent on S1P receptor 1. Nature 427, 355–360. [DOI] [PubMed] [Google Scholar]
- Mayo L, Trauger SA, Blain M, Nadeau M, Patel B, Alvarez JI, Mascanfroni ID, Yeste A, Kivisakk P, Kallas K, et al. (2014). Regulation of astrocyte activation by glycolipids drives chronic CNS inflammation. Nature medicine 20, 1147–1156. [DOI] [PMC free article] [PubMed] [Google Scholar]
- Mills EL, Ryan DG, Prag HA, Dikovskaya D, Menon D, Zaslona Z, Jedrychowski MP, Costa ASH, Higgins M, Hams E, et al. (2018). Itaconate is an anti-inflammatory metabolite that activates Nrf2 via alkylation of KEAP1. Nature 556, 113–117. [DOI] [PMC free article] [PubMed] [Google Scholar]
- Molofsky AV, Kelley KW, Tsai HH, Redmond SA, Chang SM, Madireddy L, Chan JR, Baranzini SE, Ullian EM, and Rowitch DH (2014). Astrocyte-encoded positional cues maintain sensorimotor circuit integrity. Nature 509, 189–194. [DOI] [PMC free article] [PubMed] [Google Scholar]
- Morgan MJ, and Liu ZG (2011). Crosstalk of reactive oxygen species and NF-kappaB signaling. Cell research 21, 103–115. [DOI] [PMC free article] [PubMed] [Google Scholar]
- Motori E, Puyal J, Toni N, Ghanem A, Angeloni C, Malaguti M, Cantelli-Forti G, Berninger B, Conzelmann KK, Gotz M, et al. (2013). Inflammation-induced alteration of astrocyte mitochondrial dynamics requires autophagy for mitochondrial network maintenance. Cell metabolism 18, 844–859. [DOI] [PubMed] [Google Scholar]
- Movahedi Naini S, Sheridan AM, Force T, Shah JV, and Bonventre JV (2015). Group IVA Cytosolic Phospholipase A2 Regulates the G2-to-M Transition by Modulating the Activity of Tumor Suppressor SIRT2. Mol Cell Biol 35, 3768–3784. [DOI] [PMC free article] [PubMed] [Google Scholar]
- Mullen TD, Hannun YA, and Obeid LM (2012). Ceramide synthases at the centre of sphingolipid metabolism and biology. The Biochemical journal 441, 789–802. [DOI] [PMC free article] [PubMed] [Google Scholar]
- Nakamura H, Moriyama Y, Makiyama T, Emori S, Yamashita H, Yamazaki R, and Murayama T (2013). Lactosylceramide interacts with and activates cytosolic phospholipase A2alpha. J Biol Chem 288, 23264–23272. [DOI] [PMC free article] [PubMed] [Google Scholar]
- Pappu R, Schwab SR, Cornelissen I, Pereira JP, Regard JB, Xu Y, Camerer E, Zheng YW, Huang Y, Cyster JG, et al. (2007). Promotion of lymphocyte egress into blood and lymph by distinct sources of sphingosine-1-phosphate. Science (New York, NY) 316, 295–298. [DOI] [PubMed] [Google Scholar]
- Patel MR, Loo YM, Horner SM, Gale M Jr., and Malik HS (2012). Convergent evolution of escape from hepaciviral antagonism in primates. PLoS Biol 10, e1001282. [DOI] [PMC free article] [PubMed] [Google Scholar]
- Pellerin L, and Magistretti PJ (1994). Glutamate uptake into astrocytes stimulates aerobic glycolysis: a mechanism coupling neuronal activity to glucose utilization. Proceedings of the National Academy of Sciences of the United States of America 91, 10625–10629. [DOI] [PMC free article] [PubMed] [Google Scholar]
- Perez-Escuredo J, Van Hee VF, Sboarina M, Falces J, Payen VL, Pellerin L, and Sonveaux P (2016). Monocarboxylate transporters in the brain and in cancer. Biochimica et biophysica acta 1863, 2481–2497. [DOI] [PMC free article] [PubMed] [Google Scholar]
- Platt FM (2014). Sphingolipid lysosomal storage disorders. Nature 510, 68–75. [DOI] [PubMed] [Google Scholar]
- Platt FM, Neises GR, Reinkensmeier G, Townsend MJ, Perry VH, Proia RL, Winchester B, Dwek RA, and Butters TD (1997). Prevention of lysosomal storage in Tay-Sachs mice treated with N-butyldeoxynojirimycin. Science (New York, NY) 276, 428–431. [DOI] [PubMed] [Google Scholar]
- Podjaski C, Alvarez JI, Bourbonniere L, Larouche S, Terouz S, Bin JM, Lecuyer MA, Saint-Laurent O, Larochelle C, Darlington PJ, et al. (2015). Netrin 1 regulates blood-brain barrier function and neuroinflammation. Brain : a journal of neurology 138, 1598–1612. [DOI] [PMC free article] [PubMed] [Google Scholar]
- Polman CH, Reingold SC, Banwell B, Clanet M, Cohen JA, Filippi M, Fujihara K, Havrdova E, Hutchinson M, Kappos L, et al. (2011). Diagnostic criteria for multiple sclerosis: 2010 revisions to the McDonald criteria. Annals of neurology 69, 292–302. [DOI] [PMC free article] [PubMed] [Google Scholar]
- Qi N, Shi Y, Zhang R, Zhu W, Yuan B, Li X, Wang C, Zhang X, and Hou F (2017). Multiple truncated isoforms of MAVS prevent its spontaneous aggregation in antiviral innate immune signalling. Nat Commun 8, 15676. [DOI] [PMC free article] [PubMed] [Google Scholar]
- Reed KA, Tucker DE, Aloulou A, Adler D, Ghomashchi F, Gelb MH, Leslie CC, Oates JA, and Boutaud O (2011). Functional characterization of mutations in inherited human cPLA(2) deficiency. Biochemistry 50, 1731–1738. [DOI] [PMC free article] [PubMed] [Google Scholar]
- Rothhammer V, Borucki DM, Tjon EC, Takenaka MC, Chao CC, Ardura-Fabregat A, de Lima KA, Gutierrez-Vazquez C, Hewson P, Staszewski O, et al. (2018). Microglial control of astrocytes in response to microbial metabolites. Nature 557, 724–728. [DOI] [PMC free article] [PubMed] [Google Scholar]
- Rothhammer V, Kenison JE, Tjon E, Takenaka MC, de Lima KA, Borucki DM, Chao CC, Wilz A, Blain M, Healy L, et al. (2017). Sphingosine 1-phosphate receptor modulation suppresses pathogenic astrocyte activation and chronic progressive CNS inflammation. Proceedings of the National Academy of Sciences of the United States of America 114, 2012–2017. [DOI] [PMC free article] [PubMed] [Google Scholar]
- Rothhammer V, Mascanfroni ID, Bunse L, Takenaka MC, Kenison JE, Mayo L, Chao CC, Patel B, Yan R, Blain M, et al. (2016). Type I interferons and microbial metabolites of tryptophan modulate astrocyte activity and central nervous system inflammation via the aryl hydrocarbon receptor. Nature medicine. [DOI] [PMC free article] [PubMed] [Google Scholar]
- Russi AE, Ebel ME, Yang Y, and Brown MA (2018). Male-specific IL-33 expression regulates sex-dimorphic EAE susceptibility. Proceedings of the National Academy of Sciences of the United States of America 115, E1520–E1529. [DOI] [PMC free article] [PubMed] [Google Scholar]
- Sampson TR, Debelius JW, Thron T, Janssen S, Shastri GG, Ilhan ZE, Challis C, Schretter CE, Rocha S, Gradinaru V, et al. (2016). Gut Microbiota Regulate Motor Deficits and Neuroinflammation in a Model of Parkinson’s Disease. Cell 167, 1469–1480 e1412. [DOI] [PMC free article] [PubMed] [Google Scholar]
- Sanchez-Mejia RO, Newman JW, Toh S, Yu GQ, Zhou Y, Halabisky B, Cisse M, Scearce-Levie K, Cheng IH, Gan L, et al. (2008). Phospholipase A2 reduction ameliorates cognitive deficits in a mouse model of Alzheimer’s disease. Nature neuroscience 11, 1311–1318. [DOI] [PMC free article] [PubMed] [Google Scholar]
- Sandelin A, Alkema W, Engstrom P, Wasserman WW, and Lenhard B (2004). JASPAR: an open-access database for eukaryotic transcription factor binding profiles. Nucleic Acids Res 32, D91–94. [DOI] [PMC free article] [PubMed] [Google Scholar]
- Schindelin J, Arganda-Carreras I, Frise E, Kaynig V, Longair M, Pietzsch T, Preibisch S, Rueden C, Saalfeld S, Schmid B, et al. (2012). Fiji: an open-source platform for biological-image analysis. Nat Methods 9, 676–682. [DOI] [PMC free article] [PubMed] [Google Scholar]
- Serhan CN (2014). Pro-resolving lipid mediators are leads for resolution physiology. Nature 510, 92–101. [DOI] [PMC free article] [PubMed] [Google Scholar]
- Seth RB, Sun L, Ea CK, and Chen ZJ (2005). Identification and characterization of MAVS, a mitochondrial antiviral signaling protein that activates NF-kappaB and IRF 3. Cell 122, 669–682. [DOI] [PubMed] [Google Scholar]
- Sheng WS, Hu S, Feng A, and Rock RB (2013). Reactive oxygen species from human astrocytes induced functional impairment and oxidative damage. Neurochem Res 38, 2148–2159. [DOI] [PMC free article] [PubMed] [Google Scholar]
- Simmons SB, Pierson ER, Lee SY, and Goverman JM (2013). Modeling the heterogeneity of multiple sclerosis in animals. Trends in immunology 34, 410–422. [DOI] [PMC free article] [PubMed] [Google Scholar]
- Slatter DA, Aldrovandi M, O’Connor A, Allen SM, Brasher CJ, Murphy RC, Mecklemann S, Ravi S, Darley-Usmar V, and O’Donnell VB (2016). Mapping the Human Platelet Lipidome Reveals Cytosolic Phospholipase A2 as a Regulator of Mitochondrial Bioenergetics during Activation. Cell metabolism 23, 930–944. [DOI] [PMC free article] [PubMed] [Google Scholar]
- Sofroniew MV, and Vinters HV (2010). Astrocytes: biology and pathology. Acta Neuropathologica 119, 7–35. [DOI] [PMC free article] [PubMed] [Google Scholar]
- Soumillon M, Cacchiarelli D, Semrau S, van Oudenaarden A, and Mikkelsen TS (2014). Characterization of directed differentiation by high-throughput single-cell RNA-Seq. bioRxiv, 003236. [Google Scholar]
- Stephenson D, Rash K, Smalstig B, Roberts E, Johnstone E, Sharp J, Panetta J, Little S, Kramer R, and Clemens J (1999). Cytosolic phospholipase A2 is induced in reactive glia following different forms of neurodegeneration. Glia 27, 110–128. [DOI] [PubMed] [Google Scholar]
- Thompson AJ, Baranzini SE, Geurts J, Hemmer B, and Ciccarelli O (2018a). Multiple sclerosis. Lancet (London, England) 391, 1622–1636. [DOI] [PubMed] [Google Scholar]
- Thompson AJ, Baranzini SE, Geurts J, Hemmer B, and Ciccarelli O (2018b). Multiple sclerosis. The Lancet 391, 1622–1636. [DOI] [PubMed] [Google Scholar]
- Ulland TK, Song WM, Huang SC, Ulrich JD, Sergushichev A, Beatty WL, Loboda AA, Zhou Y, Cairns NJ, Kambal A, et al. (2017). TREM2 Maintains Microglial Metabolic Fitness in Alzheimer’s Disease. Cell 170, 649–663.e613. [DOI] [PMC free article] [PubMed] [Google Scholar]
- Untergasser A, Cutcutache I, Koressaar T, Ye J, Faircloth BC, Remm M, and Rozen SG (2012). Primer3--new capabilities and interfaces. Nucleic Acids Res 40, e115. [DOI] [PMC free article] [PubMed] [Google Scholar]
- Venier RE, and Igdoura SA (2012). Miglustat as a therapeutic agent: prospects and caveats. J Med Genet 49, 591–597. [DOI] [PubMed] [Google Scholar]
- Vidaurre OG, Haines JD, Katz Sand I, Adula KP, Huynh JL, McGraw CA, Zhang F, Varghese M, Sotirchos E, Bhargava P, et al. (2014). Cerebrospinal fluid ceramides from patients with multiple sclerosis impair neuronal bioenergetics. Brain : a journal of neurology 137, 2271–2286. [DOI] [PMC free article] [PubMed] [Google Scholar]
- Weber B, and Barros LF (2015). The Astrocyte: Powerhouse and Recycling Center. Cold Spring Harbor perspectives in biology 7. [DOI] [PMC free article] [PubMed] [Google Scholar]
- Wheeler D, Bandaru VV, Calabresi PA, Nath A, and Haughey NJ (2008). A defect of sphingolipid metabolism modifies the properties of normal appearing white matter in multiple sclerosis. Brain : a journal of neurology 131, 3092–3102. [DOI] [PMC free article] [PubMed] [Google Scholar]
- Wheeler MA, Jaronen M, Covacu R, Zandee SEJ, Scalisi G, Rothhammer V, Tjon EC, Chao CC, Kenison JE, Blain M, et al. (2019). Environmental Control of Astrocyte Pathogenic Activities in CNS Inflammation. Cell 176, 581–596.e518. [DOI] [PMC free article] [PubMed] [Google Scholar]
- Wheeler MA, and Quintana FJ (2018). Regulation of Astrocyte Functions in Multiple Sclerosis. Cold Spring Harb Perspect Med. [DOI] [PMC free article] [PubMed] [Google Scholar]
- Wolf A, Agnihotri S, Micallef J, Mukherjee J, Sabha N, Cairns R, Hawkins C, and Guha A (2011). Hexokinase 2 is a key mediator of aerobic glycolysis and promotes tumor growth in human glioblastoma multiforme. The Journal of experimental medicine 208, 313–326. [DOI] [PMC free article] [PubMed] [Google Scholar]
- Xu H, He X, Zheng H, Huang LJ, Hou F, Yu Z, de la Cruz MJ, Borkowski B, Zhang X, Chen ZJ, et al. (2014). Structural basis for the prion-like MAVS filaments in antiviral innate immunity. Elife 3, e01489. [DOI] [PMC free article] [PubMed] [Google Scholar]
- Yan Y, Ding X, Li K, Ciric B, Wu S, Xu H, Gran B, Rostami A, and Zhang GX (2012). CNS-specific therapy for ongoing EAE by silencing IL-17 pathway in astrocytes. Mol Ther 20, 1338–1348. [DOI] [PMC free article] [PubMed] [Google Scholar]
- Yates A, Akanni W, Amode MR, Barrell D, Billis K, Carvalho-Silva D, Cummins C, Clapham P, Fitzgerald S, Gil L, et al. (2016). Ensembl 2016. Nucleic Acids Res 44, D710–716. [DOI] [PMC free article] [PubMed] [Google Scholar]
- Ye J, Coulouris G, Zaretskaya I, Cutcutache I, Rozen S, and Madden TL (2012). Primer-BLAST: a tool to design target-specific primers for polymerase chain reaction. BMC Bioinformatics 13, 134. [DOI] [PMC free article] [PubMed] [Google Scholar]
- Zhang W, Wang G, Xu ZG, Tu H, Hu F, Dai J, Chang Y, Chen Y, Lu Y, Zeng H, et al. (2019). Lactate Is a Natural Suppressor of RLR Signaling by Targeting MAVS. Cell 178, 176–189 e115. [DOI] [PMC free article] [PubMed] [Google Scholar]
- Zhu D, Lai Y, Shelat PB, Hu C, Sun GY, and Lee JC (2006). Phospholipases A2 mediate amyloid-beta peptide-induced mitochondrial dysfunction. The Journal of neuroscience : the official journal of the Society for Neuroscience 26, 11111–11119. [DOI] [PMC free article] [PubMed] [Google Scholar]
Associated Data
This section collects any data citations, data availability statements, or supplementary materials included in this article.
Supplementary Materials
Figure S1: Knockdown efficiency and effect on T cells, Related to Figures 1,2,3,5 and 6. (A) Expression of B4galt6, Ugcg, Cers1, Cers2, Cers4, Cers5, Cers6 in astrocytes in vivo. (unpaired T test, compared to shControl condition) (B) Effect of the knockdown of B4galt6, Ugcg, Cers1, Cers2, Cers4, Cers5 and Cers6 knockdown on T-cell response. (unpaired T test, compared to shControl condition) (C) Expression of Pla2g4a in astrocytes in vivo. (unpaired T test) (D) Effect of Pla2g4a knockdown in astrocyte on T-cell response. (E) Expression of Mavs in astrocytes in vivo. (unpaired T test) (F) Effect of Mavs knockdown in astrocyte on the T-cell response. (unpaired T test) (G) Expression of Bsg in astrocytes in vivo. (unpaired T test) (h) Expression of Pla2g4a, Mavs, Bsg, Irf1, Rela and Hk2 after siRNA knockdown in astrocytes in vitro. (unpaired T test) (I,J) Bsg (I) and Hk2 (J) protein expression in siRNA-treated astrocyte in vitro. (unpaired T test) (K) Effect of Miglustat treatment on T-cell response. Samples in (A,B,C,D,E,F,H,I) were analyzed 50–51 days after NOD EAE induction. (unpaired T test, intensity normalized to siControl condition)
Figure S2: Analysis of cPLA2-MAVS interaction, Related to Figures 3 and 4 (A) Effect of LacCer and cPLA2 inhibition on MAVS oligomerization. Murine astrocytes were treated with vehicle, 10 μM arachidonic acid, 10 μM LacCer + 1 μM cPLA2i or LacCer alone for 18 hours and mitochondria was isolated for SDD-AGE and western blot. (unpaired T test, compared to all, intensity normalized to vehicle condition) (B) Immunofluorescent analysis of cPLA2-MAVS co-localization within astrocytes in progressive NOD EAE. Brain slides were obtained from naive and EAE NOD mice and Gfap, Mavs, Cox4, cPLA2 (Pla2g4a) were detected by immunoflourescence. (C) Quantification of cPLA2 co-localization with the mitochondrial marker Cox4, and cPLA2-MAVS co-localization in Gfap+ astrocytes and Gfap−cells. (unpaired T test) (D) cPLA2 constructs used. (E,F) His-tagged human cPLA2 (eGFP-cPLA2, eGFP-cPLA2(D43N), eGFP-C2-domain; full-length, S111P, I399A/L400A/L552A, R485H, D549A, S505A, S505E) and Flag-tagged human MAVS were expressed in HEK293 cells, protein complexes were pulled down with anti-flag antibodies and analyzed by western blot. (G) Binding of LacCer to cPLA2 mutants analyzed using the lipid-protein overlay assay. (H) Effect of mutant cPLA2 in induction of MAVS oligomerization. MAVS and cPLA2 (WT, S111P, I399A/L400A/L552A, R485H) were expressed in HEK293 cell and mitochondria was isolated for SDD-AGE and western blot.
Figure S3: Effect of Mavs knockdown in astrocytes on NF-κB signaling, Related to Figure 3. Green and red indicate increased and decreased expression of indicated genes in the shMavs group when compared to the shControl group, respectively.
Figure S4: Metabolic effects of cPLA2-MAVS signaling, Related to Figures 5. (A-C) Effect of cPLA2i on carboxyl derivatives, lipids and purines (A) saturated and unsaturated fatty acids (B) and metabolites linked to glycolysis, TCA cycle and pyruvate metabolism (C) in astrocytes. Red and green indicates increase and decrease, respectively, by cPLA2i treatment. The fold change in metabolite levels is shown in log2. (D) Mitochondrial stress test on MAVS-deficient astrocytes stimulated or not for 12 hours with TNFα and IFNγ. (unpaired T test) (E) Mitochondrial pyruvate levels in MAVS knockout astrocytes. (unpaired T test) (F) Lactate release by MAVS knockout astrocytes stimulated by TNFα and IFNγ for 1 hour. (unpaired T test, compared to naïve vehicle WT condition) (G) No Effect of cPLA2 or MAVS knockdown in astrocytes on mitochondrial stress test. A corresponding control condition for the experiment shown in Figure 5H (H) HK2 co-localization with MAVS in primary murine astrocytes determined by confocal microscopy. Bar plots depict the ratio of HK2-MAVS co-localization. (I) Effect of HK2 knockdown in astrocytes on lactate release and mitochondrial pyruvate levels. (unpaired T test)
Figure S5: Effect of Miglustat on cPLA2-MAVS signaling, Related to Figure 6. (A) EAE development in NOD mice treated with Miglustat and lentiviral constructs expressing shRNAs targeting Mavs or control in astrocytes administered at the time points indicated by the arrows. (n=5, N=2, Regression slope T test, compared to all) (B) Quantification of MAVS and cPLA2 co-localization in astrocytes (MAVS+cPLA2+ double positive astrocytes) in C3+GFAP+ or C3−GFAP+ astrocytes. (unpaired T test) (C) mRNA expression determined by qPCR in murine astrocytes polarized under A1 condition (TNFα, IL1α and C1q) in the presence of vehicle or 10 μM LacCer. Expression of “A1” C3+GFAP+ astrocyte marker genes. Data are shown mean value relative to resting astrocytes.
Table S1: List of Oligonucleotides Used, Related to Key Resources Table.
Data Availability Statement
A page has been created in the GEO database with the accession number GEO: GSE139531. All RNA-seq data have been deposited in the GEO database.