Significance
As part of a systematic macroneuroscience project to clarify the general organizing principles of a mammalian nervous system, the architecture of the rat intrainterbrain network was examined with network analysis tools. This bilateral network displays 6 identical hubs on each side of the medial hypothalamus (which controls essential bodily functions), weak evidence of small-world attributes, an absence of rich club organization, and just 3 top-level subsystems or modules. Direct comparison with previous analysis of intrinsic endbrain organization suggests that intrinsic connections shape regional functional specialization to a varying extent, in part driven by differences in density and centrality, with extrinsic input–output connectivity playing a greater role in subdivisions that are sparser and less centralized.
Keywords: connectomics, mammal, neural connections, neuroinformatics, subsystems
Abstract
The endbrain and interbrain form 2 great vertebrate forebrain divisions, and the interbrain is subdivided into the hypothalamus ventrally and thalamus dorsally. General organizing principles of intrainterbrain axonal circuitry were examined here at the level of gray matter regions using network analysis tools in a mammal with the most complete available dataset—before examining interbrain input–output relationships with other nervous system parts. The dataset was curated expertly from the neuroanatomical literature using experimental axonal pathway-tracing methods, and evidence from 74,242 connection reports indicates the existence of 10,836 macroconnections of the possible 49,062 macroconnections between the 222 gray matter regions forming the right and left halves of the interbrain. Two identical sets of 6 putative hubs were identified in the intrainterbrain network and form a continuous tissue mass in a part of the right and left medial hypothalamus associated functionally with physiological mechanisms controlling bodily functions. The intrainterbrain network shows only weak evidence of small-world attributes, rich club organization is absent, and multiresolution consensus cluster analysis indicates a solution with only 3 top-level subsystems or modules. In contrast, a previous analysis employing the same methodology to the significantly denser 244-node intraendbrain network revealed 2 identical sets of 13 hubs, small-world and rich club attributes, and 4 top-level subsystems. These differences in intrinsic network architecture across subdivisions suggest that intrinsic connections shape regional functional specialization to a varying extent, in part driven by differences in density and centrality, with extrinsic input–output connectivity playing a greater role in subdivisions that are sparser and less centralized.
Based primarily on embryological development and adult topographic structure, the rostral part of the vertebrate central nervous system is traditionally divided into the endbrain (EB; telencephalon) and then caudal to it, the interbrain (IB; diencephalon) (1, 2). Each of these great divisions in turn has ventral and dorsal subdivisions, cerebral nuclei and cerebral cortex for the endbrain, and hypothalamus (HY) and thalamus (TH) for the interbrain. In an earlier paper (3), we analyzed the global network organization of intrinsic EB macroconnectivity, and for comparison a similar analysis has been carried out here on the organization of intrinsic IB macroconnectivity.
This research is part of a systematic macroneuroscience project to clarify the subsystem organization of rat nervous system connections using network analysis methodology (4). For this purpose, a defined vocabulary (5, 6) is used to describe directed and weighted axonal connections from one gray matter region to another gray matter region. The gray matter regions are from a standard rat brain atlas (7) with a complete, defined, internally consistent, and hierarchically arranged nomenclature table, which itself is consonant with a similar gray matter region nomenclature applicable to all mammals, including humans (8, 9). Such a nomenclature—which is based primarily on a combination of architecture, topography, and connections, and secondarily on function—is a prerequisite for constructing the connection tables (matrices) used in network analysis, and the macroconnections between these gray matter regions can serve as a framework for network analyses at progressively finer mesoconnection (between neuron types), microconnection (between individual neurons), and nanoconnection (individual synaptic) levels of granularity (10).
The macroconnection data analyzed here for the IB were expertly collated from the structural neuroscience literature describing the results of experimental axonal pathway-tracing methods in the rat, where by far the most extensive relevant information for any vertebrate is currently available, and all such data were converted when necessary to the nomenclature and parcellation of the standard rat brain atlas (7). One result of this collation is the creation of a gold-standard online database of intrainterbrain macroconnections. Another result is a macrolevel conceptual model for understanding intrainterbrain circuitry at finer levels of granularity. And a third result is a direct comparison of intraendbrain and intrainterbrain network macroorganization using the same methodology. Future goals are to analyze the organization of macroconnections throughout the forebrain as a whole, and then to analyze the organization of forebrain macroconnections with the rest of the nervous system.
Results
Analysis Framework.
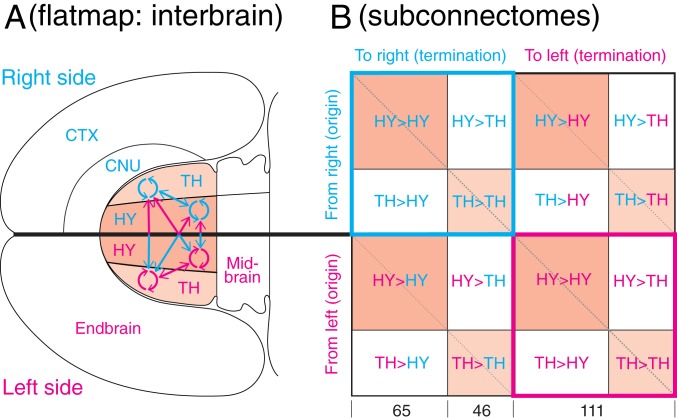
The analysis is based on experimental evidence of macroconnection presence or absence between all gray matter regions of the IB recognized in the standard rat brain atlas used here (7). On each side of the brain there are identical sets of 65 HY gray matter regions and 46 TH gray matter regions (Fig. 1). There are thus 12,210 (1112 − 111) possible ipsilateral (uncrossed, association) macroconnections between the 111 gray matter regions of the rat IB on one side of the brain (a connection from a region to itself is not considered), and 12,321 (1112) possible contralateral (crossed, commissural) macroconnections from these 111 regions to the corresponding IB regions on the other side of the brain. The IB on one side therefore has 24,531 possible ipsilateral and contralateral connections, and the right IB and left IB together have 49,062 possible connections between the 222 gray matter regions forming the right and left IB. Our systematic review of the primary structural neuroscience literature identified no reports of statistically significant male–female, right–left, or strain differences for any ipsilateral or contralateral intrainterbrain connections used for the analysis, which thus applies simply to the species level (adult rat, Rattus norvegicus domestica). Possible differences in these variables should be addressed with contemporary quantitative methodology, especially for components of the sexually dimorphic circuit.
Fig. 1.
Overview of the analysis strategy. (A) The right and left hypothalamus and thalamus are highlighted on a flatmap of the adult rat forebrain (endbrain and interbrain) and midbrain (7); also shown is the overall arrangement of connections within (circular arrows) and between (straight arrows) the 2 topographic subdivisions forming the interbrain. (B) A schematic view of the bilateral interbrain connection matrix with its 16 subconnectomes. The HY has 65 gray matter regions (nodes) on each side of the brain and the TH has 46 gray matter regions on each side, for a combined total of 111 gray matter regions on the right side and 111 on the left side; thus, the entire interbrain generates a 222 × 222 macroconnection matrix. Colored subconnectomes, or earlier versions of them, were published previously (Materials and Methods) (11, 12). The main diagonal (upper left to lower right) indicates the connection of a region to itself and has no value in a macroconnectome, where regions are treated as black boxes. The 2 shorter diagonals on either side of the main diagonal represent homotypic crossed connections, that is, connections from a region on 1 side of the brain to the corresponding region on the opposite side.
For systematic data collection and analysis, the IB connection matrix (subconnectome) is itself divided into 16 subconnectomes (Fig. 1B). Eight subconnectomes (or earlier versions of them; Materials and Methods) were previously published by our laboratory in this journal: 4 concern intrahypothalamic connections (11), and 4 concern intrathalamic connections (12). Data for extrinsic connections, between the HY and TH (the other 8 subconnectomes), were collated for the current analysis. Connections from the HY to TH were collated by J.D.H., and connections from the TH to HY were collated by L.W.S.; a comparison of collations by 2 experts for the same connection matrix (cerebral cortical association network) is provided in ref. 13.
A dataset of 37,121 connection reports for ipsilateral and contralateral connections from one IB was collated from 244 original research publications published since 1975 for the 24,531 possible connections (given no reports of statistically significant right–left differences, these numbers are doubled to give 74,242 connection reports for 49,062 possible connections arising from both sides of the brain). The connection reports were from 28 journals, book articles, or theses (47.0% from the Journal of Comparative Neurology) involving about 84 laboratories; 28% of the reports (10,378 for ipsilateral and contralateral connections arising in 1 hemisphere) were from the L.W.S. laboratory. In total, 23 different methods were used in generating the connection reports; the pathway-tracing method and other metadata associated with each report are identified in Dataset S1.
Basic Connection Numbers and Data Validity.
The collation identified 3,691 ipsilateral intrainterbrain connections as present and 7,926 as absent (reported values of “unclear” are binned with “absent” values), for a connection density of 31.8% (3,691/11,617). In contrast, 1,727 contralateral IB connections arising on 1 side of the brain were identified as present and 9,855 as absent, for a connection density of 14.9% (1,729/11,582). Thus, for each side of the IB, 5,418 ipsilateral and contralateral connections were identified as present and 17,781 as absent, for a connection density of 23.4% (5,418/23,199), whereas for the complete bilateral intrainterbrain connection matrix 10,836 connections were identified as present (also with a connection density of 23.4%, assuming no right–left differences).
No published data were found for 593 (4.9%) of all 12,210 possible ipsilateral connections for a matrix coverage (fill ratio) of 95.1% (Fig. 2A), whereas matrix coverage for contralateral connections from 1 IB to the other was 94.0% (no article found for 739, or 6.0%, of all 12,321 possible connections). Thus, the matrix coverage for all ipsilateral and contralateral connections arising in 1 IB is 94.6%, which also applies to the complete bilateral intrainterbrain connection matrix (assuming no right–left differences).
Fig. 2.
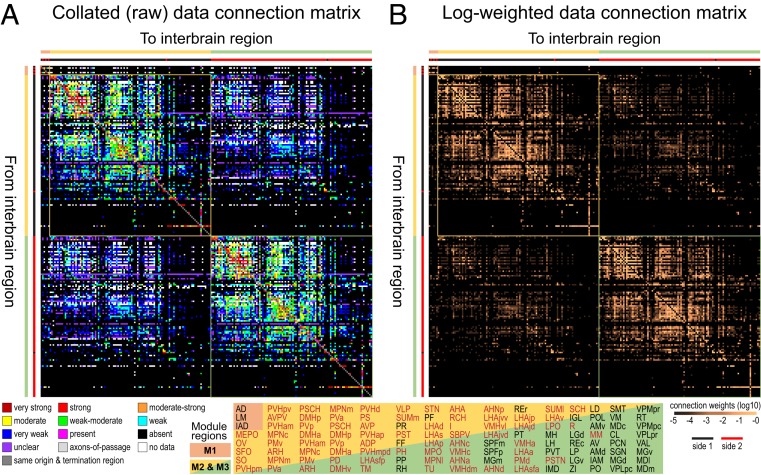
Bilateral rat intrainterbrain macroconnectome (IB2). Directed and weighted monosynaptic macroconnection matrices with gray matter region sequence in a subsystem (modular) arrangement derived from multiresolution consensus clustering analysis (Fig. 7). Connection weights are represented by descriptive values (A) and on a log10 scale derived from the descriptive values (B), and both measures are represented for identical datasets for each side of the interbrain. Sides 1 and 2 (left or right) are indicated by the thick red/black lines just to the left, and on top, of each matrix. Three top-level subsystems (modules M1 to M3) are delineated, and M1 and M3 have identical gray matter regions on opposite sides of the brain. The obvious cross formed by a single row and column near the lower right corner of M2 and M3 represents connections of the reticular thalamic nucleus. Hypothalamus regions are shown in red text; thalamus regions are in black text. Region abbreviations are defined in Dataset S2.
Assuming the connection reports collated from the literature representatively sample the 111-region matrix for each side of the brain, the complete association connection dataset for the IB on 1 side would contain ∼3,879 macroconnections, the complete contralateral connection dataset from the IB on that side would contain ∼1,837 macroconnections, and the complete bilateral intrainterbrain connection dataset would contain ∼11,458 macroconnections.
For network analysis, reported values of “no data” (and unclear) are assigned to and binned with reported values in the absent category (Fig. 2B), resulting in connection densities for ipsilateral and contralateral intrainterbrain macroconnections as follows: ipsilateral, 30.2% (3,691/12,210); contralateral, 14.0% (1,727/12,321); ipsilateral and contralateral together, 22.1% (5,418/24,531) (Dataset S2). For each IB gray matter region (node) the range of ipsilateral output connections (degrees) is 1 to 92, the range of input connections is 1 to 67, and the range of total connections (input + output) is 6 to 151. In contrast, for each IB region the range of ipsilateral and contralateral output connections is 1 to 148, the range of ipsilateral and contralateral input connections is 1 to 116, and the range of total connections is 6 to 244.
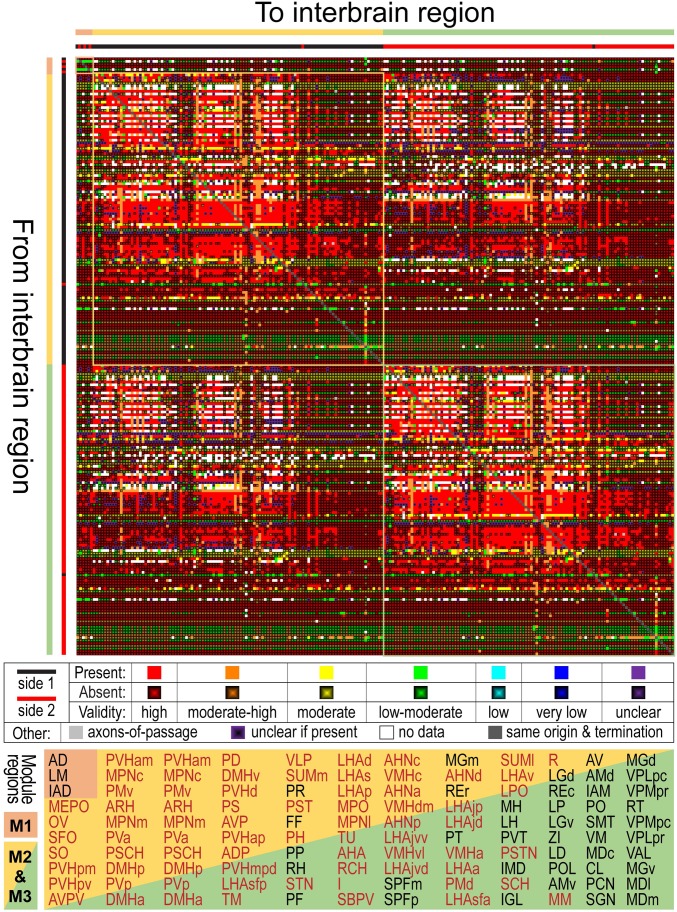
A metric was also applied to the validity of pathway-tracing methods for the collated connection reports (3, 13). The average validity of the pathway-tracing methods for macroconnection reports of present intrainterbrain macroconnections selected for network analysis was 6.58 (on a scale of 1 = lowest to 7 = highest); it was 6.25 for selected reports of macroconnections that do not exist (absent) (Fig. 3 and Dataset S1).
Fig. 3.
Comparative matrix of intrainterbrain macroconnections and the validity of pathway-tracing methods upon which they are based. The matrix combines a weighted and directed macroconnectome for the bilateral intrainterbrain network (IB2) (Fig. 1A) with a validity measure for the experimental pathway-tracing methods for present or absent connections, based on a 7-point scale (3, 13). For absent connections, a lower pathway-tracing method validity does not necessarily reduce the validity of the data (3, 13). Gray matter region arrangement and top-level subsystems (delineated modules M1 to M3) are derived from MRCC analysis (Figs. 2 and 6). Hypothalamus regions are shown in red text; thalamus regions are in black text.
Network Attributes.
The intrainterbrain macroconnectome was analyzed for 3 basic network attributes, as in our previous studies (3, 4, 11–14). First, the “small-world” attribute applies to networks with highly clustered nodes connected via short paths; second, “rich club” applies to a group of well-connected and densely interconnected nodes; and third, network centrality suggests the relative “importance” of network nodes. To rank order nodes, 4 centrality measures were used: degree, strength, betweenness, and closeness. Degree is a measure of the number of input or output connections (described as the in degree or out degree) for each network node (here, each gray matter region); strength represents the total weight of each node’s macroconnections; and betweenness and closeness take account of the shortest paths between nodes and provide an indication of node centrality with respect to putative information flow throughout the network. To identify regions with the highest overall centrality, an aggregate score was calculated for regions scoring in the top 20th percentile for each centrality metric. Regions scoring in the top 20th percentile on all 4 centrality measures were regarded as candidate hubs.
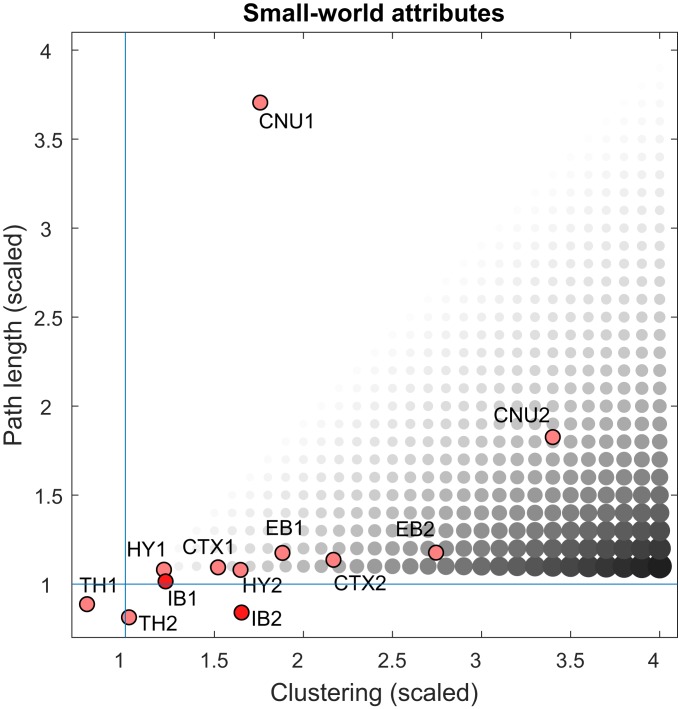
Investigation of these network attributes for the rat intrainterbrain macroconnectome revealed no small-world organization for the intrainterbrain connection network on 1 side of the brain (IB1), and weak small-world organization for the complete bilateral intrainterbrain connection network (IB2). In fact, the composite small-world metrics for IB1 and IB2 tend to be intermediate between those calculated independently for the unilateral and bilateral intrathalamic (TH1 and TH2) and intrahypothalamic (HY1 and HY2) subnetworks (Fig. 4). In addition, no rich club organization was detected in the IB1 or IB2 networks.
Fig. 4.
Comparison of small-world analysis for interbrain and other forebrain divisions. Small-world networks have 2 main properties: highly clustered (densely interconnected) nodes and relatively short paths connecting the nodes. Clustering is computed as the nodal mean of the weighted and directed clustering coefficients, whereas path length is computed as the global mean of the weighted path lengths between all node pairs. Both metrics are scaled by the median of the corresponding measures obtained from 1,000 degree-preserving randomized networks. The diameter and gray-level value of the circles correspond to the ratio between scaled clustering and scaled path length, the small-world index (23). For a network to display small-world attributes, its index should be >1, with a high (scaling >> 1) clustering index and a short (scaling near 1) path length. Neither the unilateral endbrain (EB1) nor bilateral endbrain (EB2) networks show small-world features. For comparison, values are also plotted for previously reported subconnectomes for the endbrain (EB1 and EB2) (3), as well as its component parts the cerebral nuclei (CNU1 and CNU2) (14) and cerebral cortex (CTX1 and CTX2) (13), hypothalamus (HY1 and HY2) (11), and thalamus (TH1 and TH2) (12).
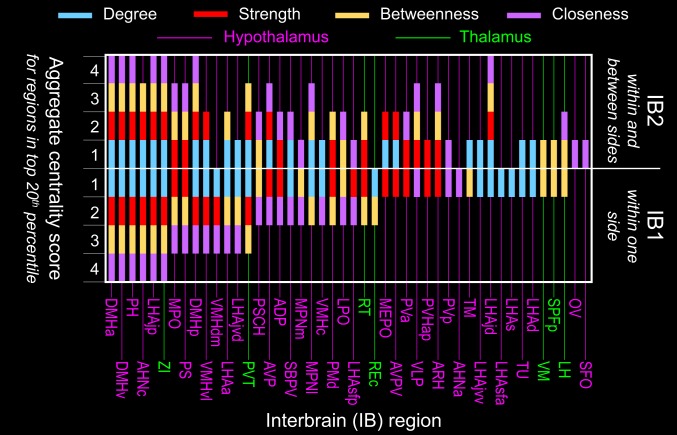
The intrainterbrain networks do, however, contain a set of putative hubs as defined above. Rank ordering of aggregated centrality scores for IB1 (SI Appendix, Fig. S1) revealed the existence of 6 hubs (Fig. 5): the anterior and ventral parts of dorsomedial hypothalamic nucleus (DMHa, DMHv), posterior hypothalamic nucleus (PH), central part of anterior hypothalamic nucleus (AHNc), juxtaparaventricular region of lateral hypothalamic area (LHAjp), and zona incerta (ZI). All but 1 of these hubs are in the hypothalamus; the exception is the ZI, in the TH, and more specifically in the ventral subdivision of the TH adjacent to the dorsal border of the HY.
Fig. 5.
Central nodes of the intrainterbrain (IB) network. Identification of candidate hub regions, and other nodes with high network centrality, for the bilateral (IB2) and unilateral (IB1) intrainterbrain subconnectomes. Nodes (gray matter regions) are assigned a score of 0 to 4 based on how many times they occur in the top 20th percentile for each of 4 measures of centrality (degree, strength, betweenness, and closeness), and are arranged from left to right by IB1 descending aggregate centrality and then topographically (7). Gray matter regions with a centrality score of 4 are considered candidate hubs. Note that aggregate centrality scores are modulated between IB1 and IB2, suggesting the relevance of contralateral connections associated with IB2 to the overall structure of the network. Also note the strong predominance of hypothalamic as compared with thalamic hubs.
As found previously for the cerebral nuclei (14), cerebral cortex (3), and HY (11), expanding anatomical coverage of a network by adding commissural (contralateral) connections to association (ipsilateral) connections can shift hub rankings. Thus, like the IB1 network, the IB2 network also has 6 putative nodes (strictly, 2 identical sets of 6 nodes on each side of the brain), but 3 of the nodes for IB2 are different and all 6 are in the HY (Fig. 5): the anterior, posterior, and ventral parts of dorsomedial hypothalamic nucleus (DMHa, DMHp, DMHv); posterior hypothalamic nucleus (PH); and juxtaparaventricular and juxtadorsomedial regions of lateral hypothalamic area (LHAjp, LHAjd). Each of the 2 identical sets of 6 gray matter regions forming IB2 nodes forms a topographically continuous mass of tissue medial to the postcommissural (column of the) fornix in the right and left HY.
It has also been shown for the endbrain (3) that expanding anatomical coverage of a network by adding association (ipsilateral) connections (cerebral cortical to cerebral nuclei) can shift hub rankings. A dramatic example in the present analysis involves the reticular thalamic nucleus (RT). This gray matter region plays a preeminent role in the unilateral and bilateral intrathalamic networks (12): The RT is the only putative hub in these 2 networks, and if the RT is removed the intrathalamic networks are no longer fully connected in the sense that no path of finite length exists between many node pairs. However, when the RT is viewed in the context of the broader IB1 network (ipsilateral connections within and between TH and HY), the RT drops precipitously from ranking in the top 20th percentile for all 4 centrality measures (for the intrathalamic networks) to ranking in the top 20th percentile for only 2 centrality measures (for both IB1 and IB2). In stark contrast, for IB1, the juxtadorsomedial region of the lateral hypothalamic area (LHAjd) only ranks in the top 20th percentile for 1 centrality measure (degree), whereas for IB2 (where commissural connections are added to the network), the LHAjd becomes a putative hub, ranked in the top 20th percentile in all 4 centrality measures. These results together clearly demonstrate that the status of a hub is not absolute but is determined instead by the coverage and size of its anatomical neighborhood (3).
Unilateral Modularity/Subsystem Organization.
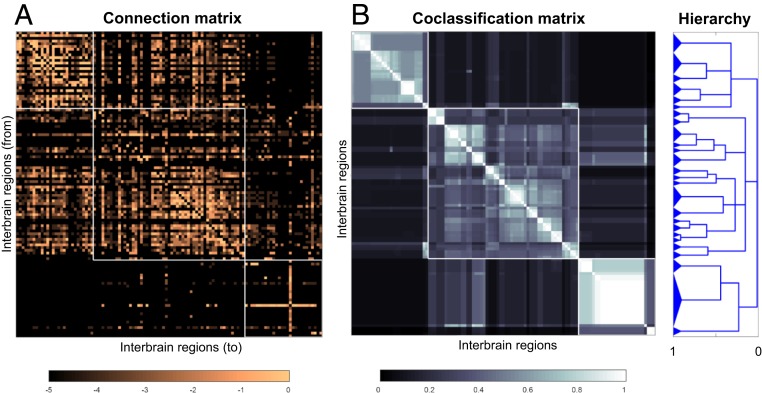
Multiresolution consensus clustering (MRCC) analysis (15) was first applied to the complete 111 × 111 gray matter region connection matrix for the IB1 (IB on the right or on the left side of the brain) subnetwork (Fig. 6A). MRCC analysis is an approach to detect a hierarchy of clusters or sets of nodes (here, IB gray matter regions) where members of a cluster have denser mutual connections within the cluster as compared with between clusters (Materials and Methods). The results of this analysis for the IB1 subnetwork, with its 3,691 connections, yielded just 3 subsystems or modules at the top level of the cluster tree (Fig. 6B). The first subsystem (Fig. 7; top of the cluster tree, IB1:M1) has the most straightforward interpretation. All nodes are in the HY, and furthermore, this subsystem is with 1 exception identical to 1 top-level HY1 subsystem that is correlated functionally with subserving physiological mechanisms controlling bodily functions (11). The exception involves addition of the ventrolateral preoptic nucleus node to the IB1 top-level subsystem. The gray matter regions forming this “hypothalamic” IB1 subsystem have 1 other striking feature: They form a topographically continuous tissue mass that is centered medial and ventral to the postcommissural fornix.
Fig. 6.
Connection and coclassification network matrices for the unilateral intrainterbrain (IB1) subconnectome. (A) Directed and weighted monosynaptic macroconnection matrix for IB1 with gray matter region (node) sequence in a modular or subsystem arrangement derived from MRCC analysis (shown in B). Connection weights are represented on a log10 scale (Bottom) and 3 top-level modules are outlined in white. (B) Complete coclassification matrix obtained from MRCC analysis (as in A) for the 111 interbrain regions on 1 side of the brain. A linearly scaled coclassification index (Bottom) gives a range between 0 (no coclassification at any resolution) and 1 (perfect coclassification across all resolutions). Ordering and hierarchical arrangement (Right) are determined after building a hierarchy of nested solutions (1,000,000 event samples) that recursively partition each cluster/subsystem, starting with the 3 top-level clusters/subsystems (IB1:M1 to M3). The 26 subsystems obtained for the finest partition are indicated on the left edge of the cluster tree, while the 3 top-level subsystems (corresponding to IB1:M1 to M3) appear at the root of the tree (far right edge). A total of 19 distinct hierarchical levels are present, as determined by the number of vertical cuts through each unique set of branches. The length of each distinct set of branches represents a distance between adjacent solutions in the hierarchical cluster tree that may be interpreted as its persistence along the entire spectrum; dominant solutions extend longer branches, while fleeting or unstable solutions extend shorter branches. All solutions plotted in the cluster tree survive the statistical significance level of α = 0.05.
Fig. 7.
Gray matter regions associated with the subsystem hierarchical organization of the unilateral intrainterbrain (IB1) coclassification matrix described in Fig. 6. Numbers on hierarchy branches indicate the scheme used for systematic identification of each branch; for example, “2” indicates the second first-order branch, referred to in the text as M2 (module or subsystem 1). Region abbreviations are defined in Dataset S2; the hierarchy index (Bottom) is explained in Fig. 6.
In contrast, a second top-level IB1 subsystem (Fig. 7; bottom of the cluster tree, IB1:M3) consists mostly of thalamic nuclei, along with the medial and lateral mammillary nuclei. Functional correlates of this subsystem are more heterogeneous (16, 17). The subsystem contains all TH parts clearly designated as first-order (18), including the dorsal lateral geniculate, ventral posterior medial, ventral posterior lateral, ventral anterior lateral, and anterior nuclei (which receive inputs from the medial and lateral mammillary nuclei) and medial geniculate complex medial part. However, this “thalamic” top-level IB1 subsystem also contains most of the medial, intralaminar, and posterior nuclei: the ventral medial nucleus, medial geniculate complex dorsal part, nucleus reuniens caudal division, and finally, the reticular thalamic nucleus. Thus, the thalamic top-level IB1 subsystem contains all of the nuclei most directly related to sensory-motor functions (the first-order nuclei), and a subset of second-order nuclei.
The final top-level IB1 subsystem (Fig. 7; middle of the cluster tree, IB1:M2) is even harder to characterize functionally. Most of its hypothalamic components are in the top-level HY1 subsystem that has been characterized as relating most clearly with complex behavior control mechanisms (11) and its thalamic components are all in the category of second-order nuclei with presumed modulatory functions as far as their cortical projections are concerned (16–18).
Overall, the complete coclassification matrix for IB1 (Fig. 7) has 26 bottom-level subsystems arranged in a hierarchy with 19 levels. The clustering of regions in lower levels of this hierarchy is not readily interpretable in terms of the classical ways the TH (16–18) and HY (19) have been parceled with respect to topography, embryological development, or extrinsic input–output relationships.
Side 1–Side 2 (Right–Left) Symmetry.
Because the datasets for connections arising on side 1 and on side 2 of the brain are identical (Analysis Framework), MRCC analysis of the complete 2-sided connection matrix (IB2, with 222 regions or nodes) should result in subsystems that are precisely symmetric across the midline (SI Appendix, Materials and Methods). We found that a symmetric MRCC solution (Figs. 2, 8, and 9) could be obtained only after removing the right and left central medial thalamic nuclei (CM), 2 nodes that are very strongly mutually coupled (SI Appendix, Materials and Methods). These two nodes form a midline thalamic structure with right and left halves that should be considered a very small module or top-level subsystem in and of itself.
Fig. 8.
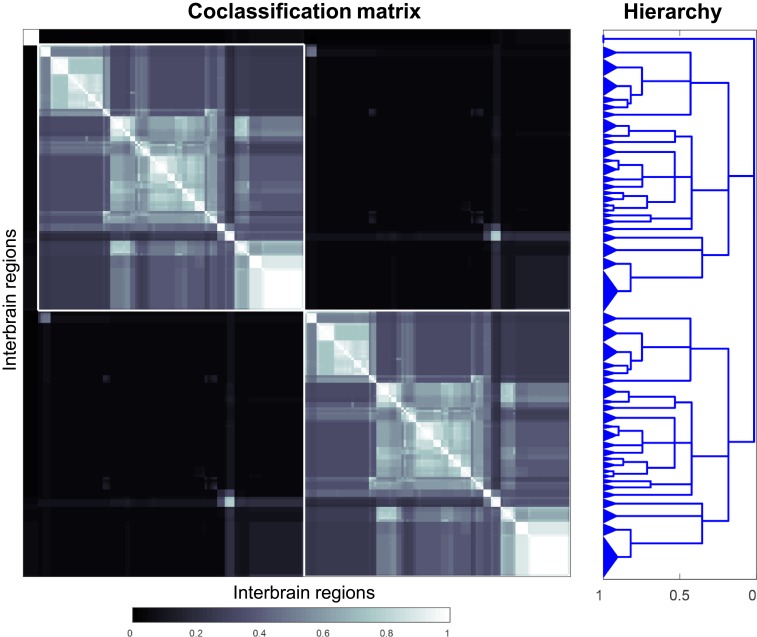
Complete coclassification matrix obtained from MRCC analysis (conducted as in Fig. 6B, except the analysis was based on 1 million event samples) for the gray matter regions (nodes) of the interbrain on both sides of the brain (IB2), with homologous sets of regions on each side (Materials and Methods). For the corresponding connection matrices (with the 3 top-level subsystems highlighted), see Fig. 2. The cluster tree (Right) was constructed as in Fig. 6; the tree’s gray matter region composition is shown in Fig. 9.
Fig. 9.
Gray matter regions associated with the subsystem hierarchical organization of the bilateral intrainterbrain (IB2) coclassification matrix described in Fig. 8. Because the region composition of the 2 large top-level modules (IB2:M2 and IB2:M3) is identical (with the same regions but on opposite sides of the brain), only IB2:M2 is shown (the branch labeling scheme is explained in Fig. 7). The 51 subsystems obtained for the finest partition are indicated on the left edge of the cluster tree, and the 3 top-level subsystems (corresponding to IB2:M1 to M3) appear at the root of the tree (far right edge); there are 51 hierarchical levels present (not shown), as determined by the number of vertical cuts through each unique set of branches. The hierarchy index (Bottom) is explained in Fig. 6.
Bilateral Modularity/Subsystem Organization.
The most striking result of the MRCC analysis applied to the IB2 network (with 220 nodes, after removing the right and left CM) was the production of 3 top-level subsystems, 1 that is small and 2 that are large and symmetrical (Figs. 2 and 8). It was also clear that adding contralateral (commissural) connections to the ipsilateral network of connections (IB1; Fig. 6) changes the network features of the original ipsilateral (1-sided or unilateral) network considered in isolation, a result also found for the endbrain (3), hypothalamus (11), and thalamus (12).
For IB2, the small subsystem (IB2:M1) has 6 nodes with a set of 3 identical nodes for side 1 and side 2: the lateral mammillary hypothalamic nucleus (LM) on each side, and the connections from each LM to the anterodorsal and interanterodorsal thalamic nuclei (AD, IAD) on the same side (Fig. 9). Each set of 3 nodes has the same components as bottom-level subsystem IB1:M3.2 (Fig. 7).
The 2 large IB2 subsystems (IB2:M2 and IB2:M3) have the same set of components, except, of course, from opposite sides of the brain, and all but 1 of the components in each set are from 1 side of the brain. The 1 exception is a component of the hypothalamus, the retina (R), which is from the opposite side of the brain because the connection from the R to contralateral IB is much heavier than the corresponding R to the ipsilateral IB connection in the rat (Datasets S1 and S2).
Subsystems IB2:M2 and IB2:M3 display identical cluster trees involving homologous regions on opposite sides of the brain (Fig. 8), so for simplicity just IB2:M2 will be described and illustrated (Fig. 9). The IB2:M2 cluster tree has 3 top-level subsystems (IB2:M2.1 to 2.3). All components but 1 of subsystem IB2:M2.1 are the same as those in IB1:M1 (Fig. 7), so it is easiest to assign functional correlations to subsystem IB2:M2.1. It is associated most clearly with physiological mechanisms controlling bodily functions, and in fact contains all 8 regions identified thus far as components of the proposed hypothalamic visceromotor pattern generator network (20). The 1 node that differs in hierarchical assignment between IB1 and IB2 is tuberomammillary nucleus (TM), which shifts between IB1:M2.4.1 (Fig. 8) and IB2:M2.1.3 (Fig. 9).
The gray matter region components of the other 2 top-level subsystems of IB2:M2 (Fig. 9; M2.2 and M2.3) are similar though not identical to the other 2 IB1 top-level subsystems (Fig. 7; IB1:M2 and IB1:M3, respectively). One obvious difference is that 2 bottom-level clusters in IB1:M2.1, which are correlated most closely overall with direct or indirect retinal inputs, move to IB2:M2.3. Thus, the top-level unilateral thalamic subsystem (IB1:M3) retains the same basic functional correlates in the bilateral IB2 network, where it corresponds to IB2:M2.3, except that compared with IB1:M1.3 it has gained the retina and other visual-related regions and has lost the lateral mammillary–anterior thalamic cluster. A less obvious difference is observed between IB1:M2 and IB2:M2.2 (Figs. 7 and 9) because of the changes just described. Thus, whereas most node components of IB1:M2 and IB2:M2.2 are the same, their cluster trees are arranged quite differently. There are 17 bottom-level subsystems in IB1:M2.2, and adding commissural connections leaves only 6 of them (2.1.2; 2.2.1.1.1 and 2.2.1.1.2; 2.3.3.1.1 and 2.3.3.1.2; and 2.4.2) with the same set of gray matter regions in IB2:M2.2, where there are 15 bottom-level subsystems.
As mentioned above (Unilateral Modularity/Subsystem Organization), functional correlates of top-level subsystems IB2:M2.2 and IB2:M2.3 are not straightforward to summarize succinctly. Overall, the complete coclassification matrix for IB2 (Fig. 9) has 51 bottom-level subsystems (1 in M1, and 25 each in M2 and M3) arranged in a hierarchy with 36 levels.
Connections between Traditional Interbrain Subdivisions.
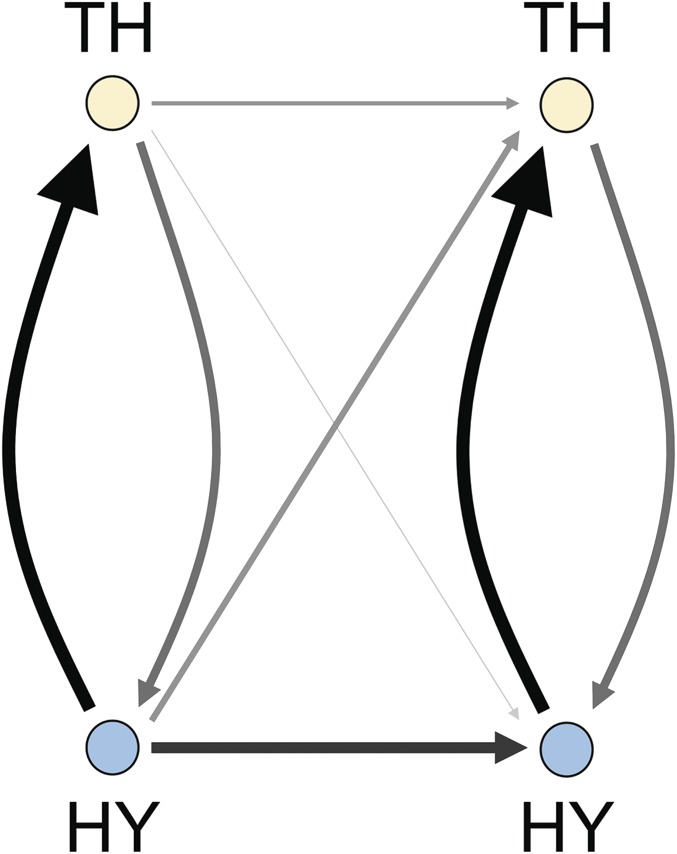
Examination of the connection reports (Dataset S1) and connection matrices (Dataset S2) reveals interesting features of interactions between the HY and TH considered as the 2 IB topographic subdivisions. At the most basic level, examination of mean connection weight by IB subdivision (HY, TH) (Fig. 10 and Table 1) shows that on average connections between right and left HY are about 6× stronger than connections between right and left TH, that ipsilateral connections from HY to TH are about 2× stronger than ipsilateral TH to HY connections, and that crossed connections from HY to TH are more than 5× stronger than crossed connections from TH to HY. In short, the 2 sides of the HY are much more strongly interconnected than the 2 sides of the TH, and HY connections to the TH are much stronger than TH connections to the HY.
Fig. 10.
Schematic layout of averaged connection weights between the 2 anatomical subdivisions of the interbrain, the hypothalamus (HY) and thalamus (TH). Connection weights are displayed on an ordinal scale (stronger connections are shown with thicker and darker arrows) according to their ranks. Both sides of the IB are shown, with contralateral connections indicated from side 1 (left) to side 2 (right) only. For numerical comparison of connection weights, see Table 1.
Table 1.
Mean connection weights over the 2 subdivisions of the IB (hypothalamus and thalamus) on both sides of the brain (HY1 and TH1 on side 1; HY2 and TH2 on side 2)
| To | ||||
| From | HY1 | TH1 | HY2 | TH2 |
| HY1 | 0.0530 | 0.0111 | 0.0040 | 0.0018 |
| TH1 | 0.0031 | 0.0152 | 0.0002 | 0.0016 |
| HY2 | 0.0040 | 0.0018 | 0.0530 | 0.0111 |
| TH2 | 0.0002 | 0.0016 | 0.0031 | 0.0152 |
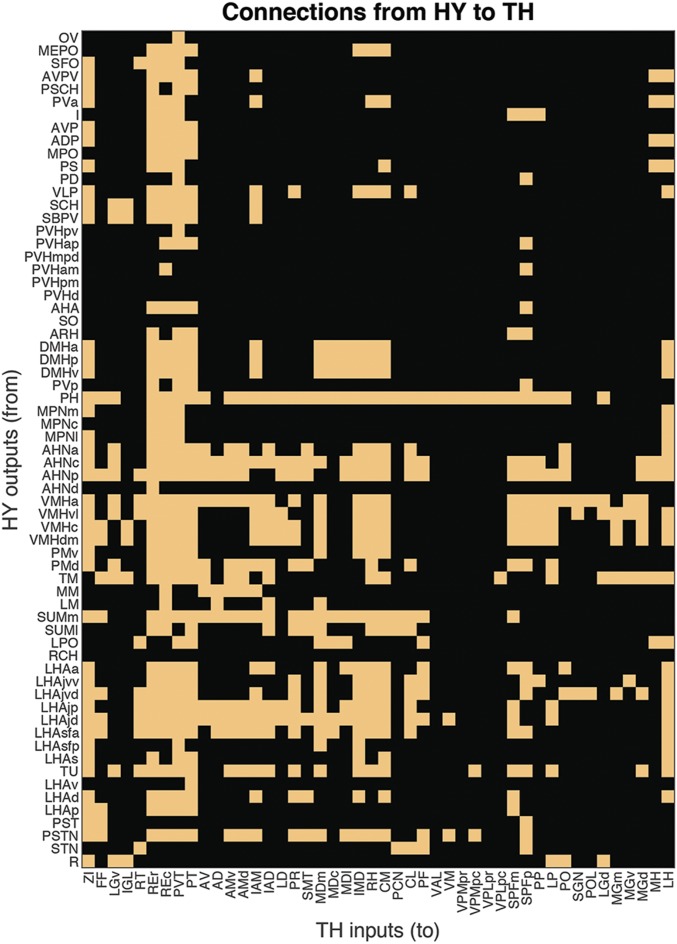
From another perspective, there is evidence that most HY regions (at least 60/65) send 1 or more topographically organized connections to the TH (Fig. 11); the only possible exceptions include 3 components of the paraventricular hypothalamic nucleus (posterior magnocellular part, PVHpm; medial parvicellular part dorsal zone, PVHmpd; and descending division, PVHd), the supraoptic nucleus (SO), and the retrochiasmatic area (RCH). At the other end of the spectrum, current evidence suggests that at least 15 individual HY regions send divergent connections to 20 or more TH regions, with the most divergent set (of 36) generated by the posterior hypothalamic nucleus (PH) (Fig. 11). Conversely, all TH regions receive a connection from at least 1 HY region, although considerable convergence is the general rule (Fig. 11). For example, 12 TH regions receive inputs from 20 or more HY regions. The paraventricular thalamic nucleus receives input from at least 51/65 HY regions, and the reuniens and paratenial nuclei receive inputs from more than 40 HY regions. The very broad nature of HY>TH connections was noted previously (21), where a hypothalamic domain of the dorsal thalamus was delineated and described as centered rostromedially in the anterior, medial, and midline groups. The current analysis provides a systematic description of HY>TH macroconnections.
Fig. 11.
Matrix of connections existing (yellow) from hypothalamic regions to thalamic regions, with regions listed topographically (7). For region abbreviations and connection weights, see Dataset S2.
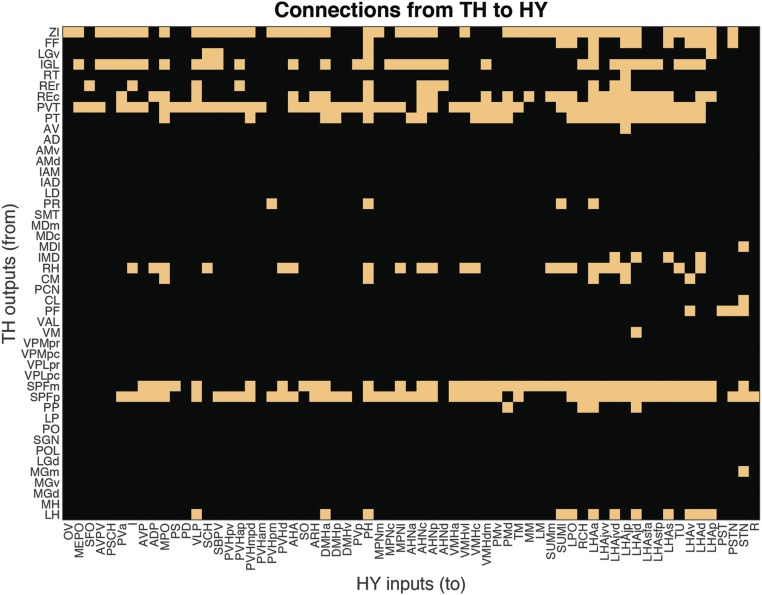
In contrast, current evidence suggests that only 14/39 dorsal thalamic regions project to the HY (Fig. 12), and most of those dorsal thalamic regions are associated with the midline and intralaminar groups. Surprisingly, all HY regions but 2 (vascular organ of lamina terminalis, OV; and suprachiasmatic preoptic nucleus, PSCH) receive topographically organized connections from 1 or more regions of the dorsal thalamus, and the OV and PSCH receive an input from the zona incerta of the ventral thalamus. Dorsal thalamic regions that send the strongest and greatest number of connections to the HY include the nucleus reuniens caudal division (REc), paraventricular thalamic nucleus (PVT), paratenial nucleus (PT), and subparafascicular nucleus magnocellular and parvicellular parts (SPFm and SPFp); all 5 regions receive convergent inputs from many (at least 18) HY regions. It is also worth noting that all 5 regions of the ventral thalamus, and the lateral (but not medial) habenula of the epithalamus, project to the HY.
Fig. 12.
Matrix of connections existing (yellow) from thalamic regions to hypothalamic regions, with regions listed topographically (7).
Discussion
Although the general organization of intrahypothalamic and of intrathalamic connections has been considered in isolation for some time (reviewed in refs. 11 and 12), we present here a systematic analysis of intrainterbrain connections as a whole. Four main conclusions emerge from this network analysis of intrainterbrain macroconnections in the rat, the mammal with the most complete available dataset. First, at this top, macro level of analysis, the IB2 network is moderately dense: Experimental axonal pathway-tracing data exist for 10,836 connections of a possible 49,062 connections between the 222 gray matter regions forming the right and left interbrain. Second, MRCC analysis revealed that the 10,836 IB2 connections form a cluster tree arranged into 36 levels, with 3 top-level subsystems (modules, communities, and clusters) and 51 bottom-level subsystems. Third, the IB2 network shows only weak evidence of small-world or rich club organization. And fourth, the IB2 network contains an identical set of 6 hubs on the right and left sides, and topographically each set forms a continuous tissue mass in a medial zone of the hypothalamus that has been associated previously with basic physiological mechanisms controlling bodily functions.
The cluster tree generated from MRCC analysis (Fig. 9) of any nervous system division is particularly useful because it allows top-down and/or bottom-up approaches to understanding functional differentiation based on the assumption that members of a particular cluster form a functionally cohesive subsystem because they are more strongly connected with each other than with the rest of the network. If this is true, subsystems at the top of the hierarchy have the broadest functional significance, subsystems at the bottom of the hierarchy are the most specialized, and subsystems at varying levels in between are combinations of lower-level subsystems—or alternatively are components of higher-level subsystems. All levels of the MRCC hierarchy, at all levels of granularity, are potentially important as they may disclose groupings of regions that contribute to different aspects of function. Indeed, the hierarchical structure revealed by multiresolution cluster analysis may be thought of as a hypothesis-generating engine for experimental systems neuroscience research assuming that the strongest connections of a node are functionally the most important.
One top-level IB2 cluster (IB2:M1) is very small and consists of the right and left lateral mammillary nuclei along with the bilateral connections of each nucleus to the anterodorsal and interanterodorsal thalamic nuclei, connections that relay vestibular information about head direction to the hippocampal formation (22). The other 2 top-level IB2 subsystems (IB2:M2 and M3) are large and have homologous nodes on opposite sides of the brain. IB2:M2 (and IB2:M3) has 3 top-level subsystems. As noted in Results, 1 subsystem (IB2:M2 and M3.1) has all of the hubs identified for IB2, contains all members identified thus far of the putative hypothalamic visceromotor pattern generator network, and is associated functionally with physiological mechanisms controlling bodily functions. In contrast, the broad functional correlates associated with the other 2 top-level subsystems of IB2:M2 and M3 are more difficult to summarize. This functional ambiguity was also encountered with the MRCC analysis of intrathalamic subsystem architecture (12), where it was suggested that additional information about the input–output connections of a particular nervous system division (for example, thalamus or interbrain) may be necessary to clarify subsystem functional significance within a broader context (more extensive network).
Thus, evidence from the rat forebrain indicates that for some divisions of the nervous system the organization of intrinsic connections alone may suggest readily interpretable functional correlates. This outcome applies, for example, to the global organization of intracerebral cortical (3, 13) and intrahypothalamic (11) connections, which are relatively dense. In contrast, the organization of intrinsic connectivity may be considerably less informative, with respect to function, for other nervous system divisions like the TH (12) or IB (here), where the connection density is relatively lower. These results suggest that the contribution of intrinsic connectivity to the function of a nervous system division is partly determined by its density, with extrinsic input–output connectivity playing a greater role with decreasing intrinsic connectivity.
Now that top-level network features of the IB have been examined, it is possible to make a direct comparison with the same features of the other subdivision of the forebrain, the endbrain, as determined with the same methodology (3). Basically, the EB and caudally adjacent IB display fundamentally different network architectures, as illustrated by comparing the 2 bilateral networks (EB2 with IB2). As a starting point, the overall connection densities are rather similar: The density for EB2 is 16.9% and that for IB2 is somewhat higher at 22.1%. However, there is a striking difference with respect to small-world and rich club attributes: EB2 shows both whereas IB2 shows neither. And finally, despite the fact that the IB2 network with 222 nodes is somewhat denser than the EB2 network with 244 nodes, the latter displays over twice as many putative hubs as the former (26 versus 12, respectively). Interestingly, functional correlates of the intrinsic connectional architecture are more readily apparent for the EB2 network (3) than for the IB2 network (here). This indicates that there are significant differences in the extent to which connections intrinsic to a given subdivision determine its regional functional specialization, with extrinsic input–output connectivity playing a greater role in subdivisions that are sparser and less centralized.
The next step in our analysis of the rat macroconnectome will be to analyze the organization of connections within and between the EB and IB, that is, within the forebrain as a whole. As demonstrated previously (3, 12), adding (or subtracting) anatomical coverage to (or from) a network can change the network attributes of individual nodes (such as hub rankings due to changes in centrality measures, or inclusion in one or another component of a cluster tree), and it seems reasonable to suggest that placing the IB subnetwork within the larger forebrain network, which includes input–output connections with cerebral cortex and cerebral nuclei, may yield a set of top-level subsystems with more apparent functional correlates. However, following this completeness rule to its logical end suggests that a stable cluster tree, including top-level organizing principles, cannot be expected until the entire nervous system connection matrix (the neurome) has been subjected to macroanalysis.
Materials and Methods
All network analysis methods used here follow those described previously (3, 4, 11–14), including a recently introduced method for multiresolution consensus clustering analysis (3, 15). The MRCC method as implemented here aims to detect densely connected communities (clusters, modules, or subsystems) among the directed and weighted connections between network nodes (here, gray matter regions). Importantly, it does so across multiple levels of resolution or scale, looking for the existence of larger as well as smaller clusters. Across all scales, significant clusters are combined into a summary description called a coclassification matrix, which, for every pair of nodes, records how frequently these 2 nodes are placed into the same cluster, across all scales. The coclassification matrix is then subjected to hierarchical clustering to create a compact description of all nested solutions.
All macroconnection data obtained from the primary literature were interpreted in relation to the current version of the only available standard, hierarchically organized, annotated parcellation and nomenclature for the rat brain (7). Within- and between-side connection reports were assigned ranked qualitative connection weights according to their description; an ordinal scale (from 1 = very weak to 7 = very strong) was used. For weighted network analysis, as in previous work (3, 4, 11–14), an exponential scale was applied to the ordinal weight categories; the scale spanned a range of 5 orders of magnitude and is consistent with quantitative pathway-tracing data in rat (4).
As mentioned in Results, the IB connectome has 16 subconnectomes. Connection reports for 8 subconnectomes were collated for this report, and 8 subconnectomes were collated for earlier reports, or newer versions of those earlier subconnectomes were updated for this report (Fig. 1B); the necessity of versioning was discussed earlier (13). New versions of previously published subconnectomes are contained in the hypothalamus-to-hypothalamus (HYtoHY) connection matrix, version 1.1 (Dataset S2).
Data Availability.
Connection report data and annotations are provided in a tabulated Microsoft Excel spreadsheet (Dataset S1), as are the data extracted from these reports to construct connection matrices (Dataset S2). To facilitate access to and use of the connection report data, they are freely available as a searchable resource at The Neurome Project (https://sites.google.com/view/the-neurome-project/home). Network analyses were carried out on the directed and exponentially scaled/weighted rat interbrain macroconnection matrix (Dataset S2, worksheet “IB2 topographic bins”) using tools collected in the Brain Connectivity Toolbox (https://sites.google.com/site/bctnet/).
Supplementary Material
Footnotes
The authors declare no competing interest.
Data deposition: All connection reports used for this study are provided as Datasets S1 and S2, as well as deposited as a searchable resource at The Neurome Project, https://sites.google.com/view/the-neurome-project/connections.
This article contains supporting information online at https://www.pnas.org/lookup/suppl/doi:10.1073/pnas.1915446116/-/DCSupplemental.
References
- 1.Nauta W. J. H., Feirtag M., Fundamental Neuroanatomy (Freeman, New York, 1986). [Google Scholar]
- 2.Swanson L. W., What is the brain? Trends Neurosci. 23, 519–527 (2000). [DOI] [PubMed] [Google Scholar]
- 3.Swanson L. W., Hahn J. D., Jeub L. G. S., Fortunato S., Sporns O., Subsystem organization of axonal connections within and between the right and left cerebral cortex and cerebral nuclei (endbrain). Proc. Natl. Acad. Sci. U.S.A. 115, E6910–E6919 (2018). [DOI] [PMC free article] [PubMed] [Google Scholar]
- 4.Bota M., Sporns O., Swanson L. W., Architecture of the cerebral cortical association connectome underlying cognition. Proc. Natl. Acad. Sci. U.S.A. 112, E2093–E2101 (2015). [DOI] [PMC free article] [PubMed] [Google Scholar]
- 5.Swanson L. W., Bota M., Foundational model of structural connectivity in the nervous system with a schema for wiring diagrams, connectome, and basic plan architecture. Proc. Natl. Acad. Sci. U.S.A. 107, 20610–20617 (2010). [DOI] [PMC free article] [PubMed] [Google Scholar]
- 6.Brown R. A., Swanson L. W., Neural systems language: A formal modeling language for the systematic description, unambiguous communication, and automated digital curation of neural connectivity. J. Comp. Neurol. 521, 2889–2906 (2013). [DOI] [PMC free article] [PubMed] [Google Scholar]
- 7.Swanson L. W., Brain maps 4.0—Structure of the rat brain: An open access atlas with global nervous system nomenclature ontology and flatmaps. J. Comp. Neurol. 526, 935–943 (2018). [DOI] [PMC free article] [PubMed] [Google Scholar]
- 8.Swanson L. W., Neuroanatomical Terminology: A Lexicon of Classical Origins and Historical Foundations (Oxford University Press, Oxford, 2015). [Google Scholar]
- 9.Swanson L. W., Hof P. R., A model for mapping between the human and rodent cerebral cortex. J. Comp. Neurol. 527, 2925–2927 (2019). [DOI] [PMC free article] [PubMed] [Google Scholar]
- 10.Swanson L. W., Lichtman J. W., From Cajal to connectome and beyond. Annu. Rev. Neurosci. 39, 197–216 (2016). [DOI] [PubMed] [Google Scholar]
- 11.Hahn J. D., Sporns O., Watts A. G., Swanson L. W., Macroscale intrinsic network architecture of the hypothalamus. Proc. Natl. Acad. Sci. U.S.A. 116, 8018–8027 (2019). [DOI] [PMC free article] [PubMed] [Google Scholar]
- 12.Swanson L. W., Sporns O., Hahn J. D., The network organization of rat intrathalamic macroconnections and a comparison with other forebrain divisions. Proc. Natl. Acad. Sci. U.S.A. 116, 13661–13669 (2019). [DOI] [PMC free article] [PubMed] [Google Scholar]
- 13.Swanson L. W., Hahn J. D., Sporns O., Organizing principles for the cerebral cortex network of commissural and association connections. Proc. Natl. Acad. Sci. U.S.A. 114, E9692–E9701 (2017). [DOI] [PMC free article] [PubMed] [Google Scholar]
- 14.Swanson L. W., Sporns O., Hahn J. D., Network architecture of the cerebral nuclei (basal ganglia) association and commissural connectome. Proc. Natl. Acad. Sci. U.S.A. 113, E5972–E5981 (2016). [DOI] [PMC free article] [PubMed] [Google Scholar]
- 15.Jeub L. G. S., Sporns O., Fortunato S., Multiresolution consensus clustering in networks. Sci. Rep. 8, 3259 (2018). [DOI] [PMC free article] [PubMed] [Google Scholar]
- 16.Jones E. G., The Thalamus (Cambridge University Press, Cambridge, UK, ed. 2, 2007). [Google Scholar]
- 17.Vertes R. P., Linley S. B., Groenewegen H. J., Witter M., “Thalamus” in The Rat Nervous System, Paxinos G., Ed. (Elsevier, Amsterdam, ed. 4, 2014), pp. 335–390. [Google Scholar]
- 18.Usrey W. M., Sherman S. M., Corticofugal circuits: Communication lines from the cortex to the rest of the brain. J. Comp. Neurol. 527, 640–650 (2019). [DOI] [PMC free article] [PubMed] [Google Scholar]
- 19.Swanson L. W., “The hypothalamus” in Handbook of Chemical Neuroanatomy, Hökfelt T., Björklund A., Swanson L. W., Eds. (Integrated Systems of the CNS, Part 1, Elsevier, Amsterdam, 1987), vol. 5, pp. 267–295. [Google Scholar]
- 20.Thompson R. H., Swanson L. W., Structural characterization of a hypothalamic visceromotor pattern generator network. Brain Res. Brain Res. Rev. 41, 153–202 (2003). [DOI] [PubMed] [Google Scholar]
- 21.Risold P. Y., Thompson R. H., Swanson L. W., The structural organization of connections between hypothalamus and cerebral cortex. Brain Res. Brain Res. Rev. 24, 197–254 (1997). [DOI] [PubMed] [Google Scholar]
- 22.Stackman R. W., Taube J. S., Firing properties of rat lateral mammillary single units: Head direction, head pitch, and angular head velocity. J. Neurosci. 18, 9020–9037 (1998). [DOI] [PMC free article] [PubMed] [Google Scholar]
- 23.Humphries M. D., Gurney K., Network ‘small-world-ness’: A quantitative method for determining canonical network equivalence. PLoS One 3, e0002051 (2008). [DOI] [PMC free article] [PubMed] [Google Scholar]
Associated Data
This section collects any data citations, data availability statements, or supplementary materials included in this article.
Supplementary Materials
Data Availability Statement
Connection report data and annotations are provided in a tabulated Microsoft Excel spreadsheet (Dataset S1), as are the data extracted from these reports to construct connection matrices (Dataset S2). To facilitate access to and use of the connection report data, they are freely available as a searchable resource at The Neurome Project (https://sites.google.com/view/the-neurome-project/home). Network analyses were carried out on the directed and exponentially scaled/weighted rat interbrain macroconnection matrix (Dataset S2, worksheet “IB2 topographic bins”) using tools collected in the Brain Connectivity Toolbox (https://sites.google.com/site/bctnet/).


