Abstract
This paper describes two general methods: field map processing and NMR lineshape analysis, that we are currently using for the on-going research of field improvement techniques specifically applied to our 700 MHz LTS/HTS NMR magnet. The validity of the methods is verified with comparison between calculations and experiments. Also, a simple but effective analysis has been used to identify the principal source of a remanent magnetic field measured in the bore of the 700 MHz LTS/HTS NMR magnet: the Screening Current induced Field (SCF) from the 100-MHz HTS insert, comprised of 48 double pancake coils, each wound with Bi2223 tape.
Keywords: Field mapping, LTS/HTS NMR magnet, NMR lineshape, screening currents induced field (SCF)
I. Introduction
SINCE 2000, the MIT Francis Bitter Magnet Laboratory has been carrying out a 3-Phase program of which the ultimate goal is to develop a GHz-class LTS/HTS NMR magnet. With Phase 1 350 MHz LTS/HTS NMR magnet (LH350) completed in 2002, we successfully proved the key design philosophy adopted for each HTS insert at the outset of the 3-phase program is viable: 1) use of high-strength Bi2223-Ag 3-ply tape; and 2) stacked double pancake (DP) coil configuration. However, we encountered a new challenge of large harmonic errors in the LH350 magnet [1], [2]. In Phase 2, started in 2003 and scheduled to end in 2007, the improvement of field homogeneity as well as the upgrade of the NMR frequency have been the main targets in building a new 700 MHz LTS/HTS NMR magnet (LH700) that consists of a 600 MHz LTS background magnet (L600) and a 100 MHz HTS insert (H100) [3]. In 2006, we achieved the frequency goal of 700 MHz, upgraded from its original design value of 675 MHz, and a factor-of-4 improvement of field homogeneity from 633 ppm of LH350 to 172 ppm of LH700 [4]. The half-peak bandwidth (half-width) of the 1H NMR signal in LH700 was reduced from 9.0 kHz in LH350 to 1.9 kHz [4].
However, for practical NMR applications, the upgraded 1.9 kHz half-width and 172 ppm field homogeneity are still too large. To successfully achieve the goal of building a high resolution GHz-class LTS/HTS NMR magnet in Phase 3, we are currently devoting most of our efforts to: 1) analyze the source of harmonic errors, especially from HTS inserts; 2) develop homogeneity improvement techniques. In this paper, we describe two important methods, field map processing and NMR lineshape calculation, that we are currently using to estimate the field homogeneity after various homogeneity improvement techniques have been applied. The paper also presents the results of theoretical and experimental analyses of the Screening Currents induced Field (SCF) measured in the bore of the LH700: one of the major harmonic error sources in LTS/HTS NMR magnets, especially when tape-wound HTS inserts are used.
II. Field Homogeneity Estimation
A. Field Map Processing
Field map processing is a procedure of conversion of field values measured at an array of points in a given volume, cylindrical or spherical, into field gradients of various orders that can be used to evaluate the field homogeneity of NMR/MRI magnets. In spherical polar coordinates, the axial magnetic field, Bz, can be expressed as shown in (1) where, u = cos θ, θ is a colatitude angle—the angle between the z axis and the radius-vector r, ϕ is the azimuthal angle and are associated Lengendre functions.
| (1) |
Although those spherical harmonic expansion coefficients, and , are sufficient to evaluate the field homogeneity of NMR/MRI magnets, field gradients are traditionally used for actual mappings and their analyses, for example, Z, X, ZC2, instead of , , . General expressions for the mathematical conversion between harmonic coefficients and field gradients are summarized in Table I.
TABLE I.
Conversion Between Field Gradients and Harmonic Coefficients
| Field gradient | Harmonic coefficient |
|---|---|
| Zi | |
| ZiX; ZiY | |
| ZiCj; ZiSj |
When field improvement techniques such as additional active and passive shim sets to mitigate harmonic errors from SCF are applied, new field gradients are derived. Then, based on the equations in Table I, harmonic coefficients in (1) can be calculated so that, with proper mapping paths defined, an arbitrary field mapping can be achieved. In this way, we can predict the potential field homogeneity in a given volume with the accuracy determined by the order of harmonic coefficients in the analysis.
B. NMR Lineshape Analysis
It is well known that an ideal NMR peak resembles a Lorentzian lineshape, a Fourier transformed solution of the Bloch equation [5]. Fig. 1 represents a sample of the peak-normalized Lorentzian lineshape, L(f), having 0.125 Hz natural half-width, and (2) is a corresponding equation, where f0 and fh are, respectively, a peak frequency and a half-width defined in Fig. 1.
Fig. 1.
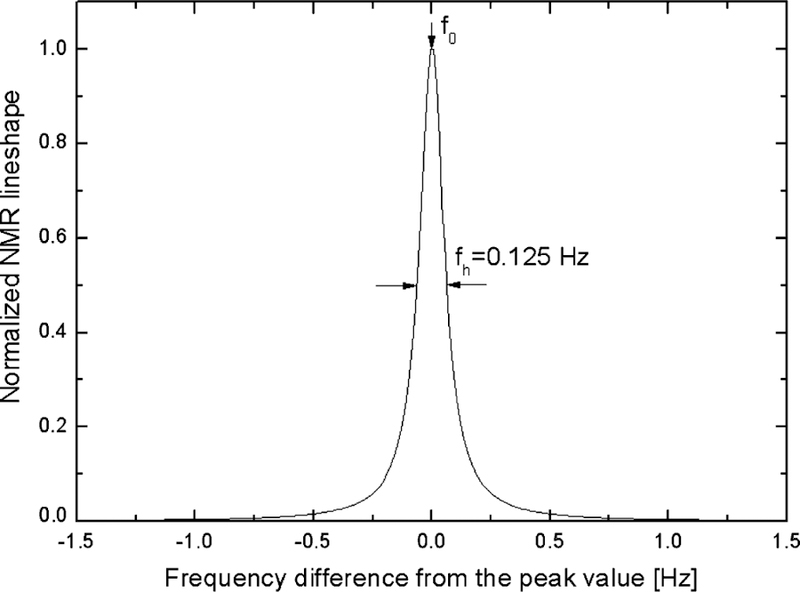
Peak normalized ideal Lorentzian lineshape; Half-width is assumed to be 0.125 Hz, equal to a natural linewidth of 1H NMR probe, e.g.,CHCl3 sample.
| (2) |
Although actual NMR lineshapes depend on various conditions such as RF signal profile and chemical shift, for the engineering purpose three assumptions may be made to estimate a change of original NMR lineshapes by field improvement techniques: 1) uniformly flat RF signal; 2) no local field effects; and 3) homogeneous material density of NMR samples. Based on these assumptions, a target NMR sample volume defined in spherical coordinates is divided into small sub-volumes, in this analysis, 64 divisions in the r direction, and 128 divisions each in θ and ϕ directions. Then, the NMR lineshape of each sub-volume is integrated over the entire sample volume to achieve the final NMR lineshape.
C. Comparison Between Simulation and Experiment
Fig. 2 shows a comparison between calculated (dashed line) and measured (solid line) field mappings of the 700 MHz LTS/HTS NMR magnet (LH700) at the minimum frequency of 692127.4 kHz. During the actual mapping, a 0.7 μL 1H NMR probe was traced in 12 revolutions along the helical mapping path on the cylindrical surface of 17 mm in diameter and 30 mm long. Calculated mapping in Fig. 2 was based on the harmonic coefficients up to the 4th order with the assumption of the same mapping path. Generally, calculation agrees well with measurement; the measured and calculated field homogeneities in the given cylindrical mapping volume are respectively, 172 ppm and 170 ppm. However, as expected and indicated in the dashed box in Fig. 2, there is still a noticeable error, especially in harmonics of orders higher than the 4th. The latter can be improved by including higher order terms into the field map processing.
Fig. 2.
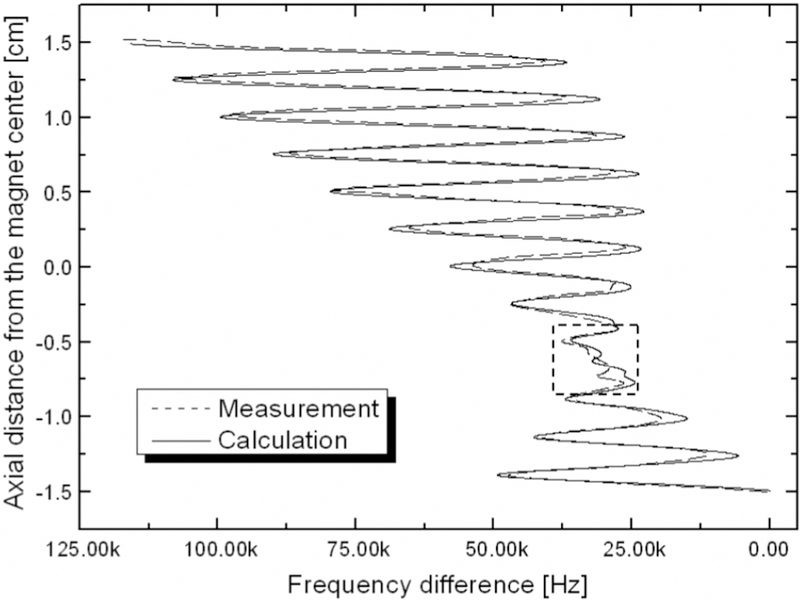
Field mappings of the 700 MHz LTS/HTS NMR magnet (LH700) at the minimum frequency of 692127.4 kHz; Dashed line: measurement; Solid line: calculation. As expected, the dashed box indicated that higher than 4th order harmonics have large errors. In terms of half-width, the computation agrees well with the measurement.
Fig. 3 presents computed (solid line) and measured (dashed line) NMR lineshapes at the peak frequency of 692205.7 kHz from the same 0.7 μL 1H NMR probe used for the field mapping. The computed 0.11% and 0.55% peak bandwidths, that are a good indicator of the quality of the actual NMR signal and strongly depend on high order field gradients, have exhibited significant differences with the similarly located measured bandwidths. However, in terms of half-width that is sufficient to estimate the quality of NMR signals for engineering purposes, the computation agrees well with the measurement; The computed and measured half-widths are respectively 2.1 and 1.9 kHz.
Fig. 3.
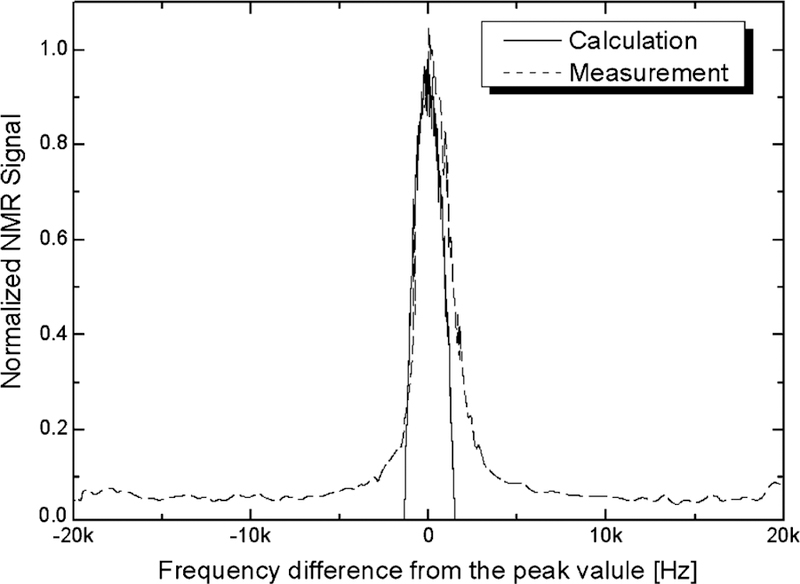
Computed (solid line) and measured (dashed line) NMR lineshapes from the 0.7 μL 1H NMR probe at the peak frequency of 692205.7 kHz.
III. Screening Current Induced Field
A. Remanent Magnetic Field in LH700
In 2006, after the final test of the LH700 NMR magnet, we found that with both LTS and HTS magnets completely discharged but still at 4.2 K, a magnetic field of more than 200 gauss still remained in the RT bore of the LH700 [4]. The remanent field decreased as both LTS and HTS magnets were warmed up, becoming less than 80 gauss near 77 K, and completely disappeared when it was measured again after the HTS insert temperature reached around 130 K. Based on this measurement, we believed that the primary source of the remanent field could likely be the screening current induced in the H100 Bi2223 tape, not the magnetization of the reinforcement stainless steel layers in the 3-ply HTS tapes, as was initially assumed.
B. Simulation of SCF
Fig. 4 illustrates the actual test procedure of the LH700 [4]. After the final test (Map 6 in Fig. 4) was completed, the entire system was shut down; first, the HTS insert was discharged and then the LTS magnet followed. To accurately simulate an SCF of an HTS insert, it is important to know the previous history of both self and external magnetic fields into the HTS insert. However, in the actual test, the procedure was complex; both HTS and LTS magnets were fully discharged once (mark A in Fig. 4); charging and discharging of the HTS insert were repeated twice always followed by a tuning of the LTS magnet (mark B in Fig. 4). For simplicity, in the simulation presented here, it was assumed that, in spite of the previous history at the moment corresponding to mark C in Fig. 4, the electro motive force (EMF) induced inside the HTS tape by the next discharging process of the external LTS magnet, was sufficient to determine the final distribution of the SCF, with both LTS and HTS magnets completely discharged. In other words, in this simplified simulation, induction of the SCF was considered as a simple field-cooling process where the field generated by the LTS magnet at mark C in Fig. 4 was treated as a nominal external field.
Fig. 4.
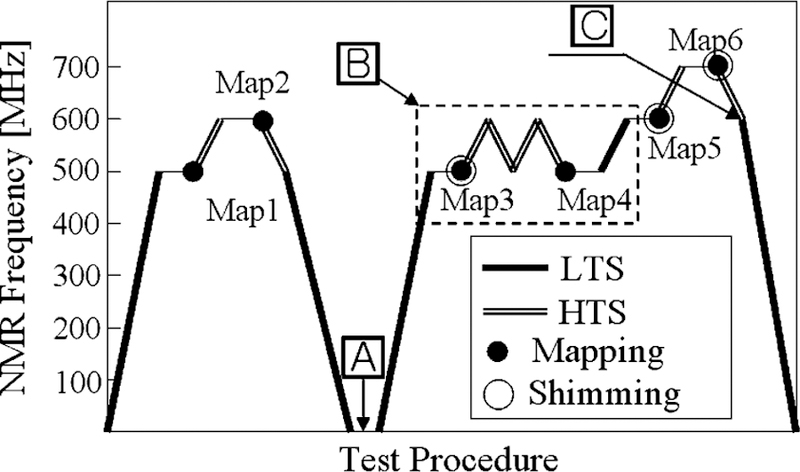
Test procedure of the LH700 system, i.e., the history of the self and external magnetic fields applied in the HTS insert, H100; Mark A: both LTS and HTS magnets were once fully discharged; Mark B: H100 repeatedly charged and discharged; Mark C: HTS insert finally discharged.
To compute the screening current distribution inside the DP coil assembly, we chose a method similar to that of [6]. Fig. (5a) shows a schematic drawing of both LTS and HTS magnets and Fig. (5b) is a schematic of a single-turn HTS tape in an arbitrary DP coil of the HTS insert. Calculation of the induced current in the HTS tape follows two steps; 1) Magnetic field generated by the LTS magnet at the moment corresponding to mark C in Fig. 4 is computed with the Finite Element Method, based on the configuration of Fig. (5a); 2) Using only the radial field component, Br in Fig. (5b), that is perpendicular to the HTS tape, the penetration depth, p in Fig. (5b), is calculated on the basis of the infinite-slab critical state model, (3).
| (3) |
where, Jc(Br) is the critical current density of the HTS tape according to the Anderson-Kim model [7], (4). In this paper, Jc0 and Br0 were set to, respectively, 8.53 × 10⁷ A/m2 and 0.2 T, based on the Bi2223 tape specifications [3].
Fig. 5.
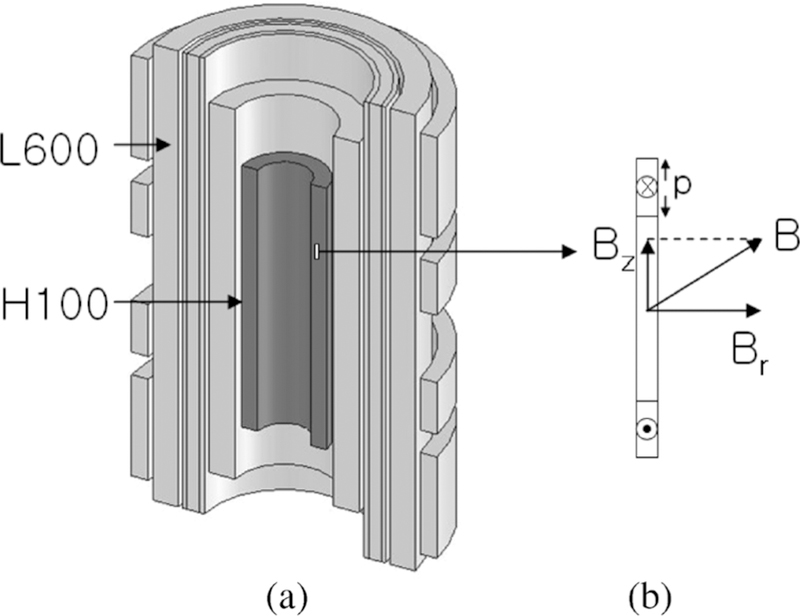
(a) Schematic to-scale drawing of the 700 MHz LTS/HTS NMR magnet. (b) Enlarged view of a single-turn HTS tape in an arbitrary DP coil of the HTS insert, H100; B: magnetic field vector; Br: radial (perpendicular to the HTS tape) field component; Bz: axial field component; p: penetration depth based on the assumption of the infinite-slab critical state model.
| (4) |
Given that the number of DP coils in the H100 insert was 48 with each 142 turns, a total of 6816 concentric current loops were generated according to the previously mentioned simulation model for the induced screening current inside the HTS tape. With this computed current distribution, the final SCF along the Z axis was calculated with the Biot-Savart law.
C. Comparisons Between Simulation and Experiment
Fig. 6 compares the axial distributions of the SCF between simulation and measurement along the axis in the RT bore of the LH700; dashed and solid lines are respectively calculated and measured plots. The field measurement was performed using a Hall probe attached to the bottom of a motor-driven stick. Despite a simple model used for simulation, agreement between measurement and calculation is quite good. The two negative peaks of both simulation and measurement curves, shown in Fig. 6 correspond to the top and bottom axial ends of the HTS insert, where the radial field component of the HTS insert is maximum. On the contrary, the small SCF near the mid-plane, the recess between two positive peaks, indicates that the radial field component, the dominating source of the induced current in the HTS tape is very weak because the external LTS magnet produces a very uniform axial field in that area. The discrepancy between calculation and measurement in the vicinity of the magnet center, the important area for NMR application, shows that a more accurate simulation model is required in order to precisely consider the SCF effect on field gradients. Also, according to our previous test of the LH700 magnet, understanding of the temporal behavior of the SCF is also important in LTS/HTS NMR magnet operation. More experiments and simulations are being processed and results will be reported later.
Fig. 6.
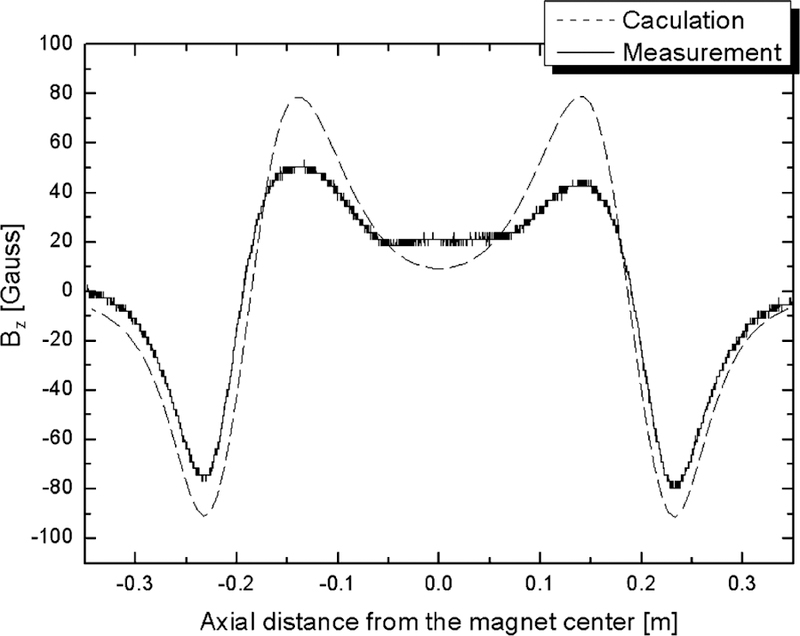
Axial distribution of the SCF in the 100 MHz HTS insert, H100; Dash: calculation; Solid: measurement. Two negative peaks of both calculation and measurement curves correspond to top and bottom ends of the H100; The recess between two positive peaks indicate that the external radial field from L600 is very weak.
IV. Conclusion
To develop techniques for homogeneity improvement in LTS/HTS NMR magnets, it is necessary to estimate theoretically the potential effects of those techniques on harmonic errors. This paper describes two general methods: field map processing and NMR lineshape analysis that we are currently using to develop homogeneity improvement techniques for LTS/HTS NMR magnets such as additional active and passive shim designs to mitigate harmonic errors from SCF. The validity of the methods was verified by comparison between calculations and experiments. Also, a simple but effective calculation method was used to reveal the source of the remnant magnetic field: the Screening Current induced Field (SCF), in the bore of the 700 MHz LTS/HTS magnet.
Further studies are scheduled focusing on several issues related to the characteristics of SCF and its effect on the field homogeneity: 1) temporal stability of the SCF with or without the presence of the external magnetic field; 2) upgraded simulation method with the axial field component taken into account; 3) screening current distribution and its effect on field gradients especially when both LTS/HTS magnets are fully energized. With full understanding of the nature and mechanisms of SCF in LTS/HTS NMR magnets, together with the homogeneity evaluation technique of field mapping and NMR lineshape computations discussed here, we expect to succeed in achieving the goal of Phase 3: a high-resolution GHz-class LTS/HTS NMR magnet.
Acknowledgments
This work was supported by the NIH National Center for Research Resources.
Contributor Information
Seung-yong Hahn, Francis Bitter Magnet Laboratory at Massachusetts Institute of Technology, Cambridge, MA 02139, USA..
Juan Bascuñán, Francis Bitter Magnet Laboratory at Massachusetts Institute of Technology, Cambridge, MA 02139, USA..
Woo-Seok Kim, Francis Bitter Magnet Laboratory at Massachusetts Institute of Technology, Cambridge, MA 02139, USA..
Emanuel S. Bobrov, Francis Bitter Magnet Laboratory at Massachusetts Institute of Technology, Cambridge, MA 02139, USA.
Haigun Lee, Francis Bitter Magnet Laboratory at Massachusetts Institute of Technology, Cambridge, MA 02139 USA. He is now with the Department of Materials Science & Engineering, College of Engineering, Korea University, Seoul 136-701, Korea.
Yukikazu Iwasa, Francis Bitter Magnet Laboratory at Massachusetts Institute of Technology, Cambridge, MA 02139, USA..
References
- [1].Bascuñán J, Lee H, Bobrov E, and Iwasa Y, “A low- and high-temperature superconducting NMR magnet: Design and performance results,” IEEE Trans. Applied Superconductivity, vol. 13, no. 2, pp. 1550–1553, June 2003. [Google Scholar]
- [2].Lee H, Bascuñán J, and Iwasa Y, “A high-temperature superconducting double-pancake insert for an NMR magnet,” IEEE Trans. Applied Superconductivity, vol. 13, no. 2, pp. 1546–1549, June 2003. [Google Scholar]
- [3].Lee H, Bobrov E, Bascuñán J, Hahn S, and Iwasa Y, “An HTS insert for Phase 2 of a 3-Phase 1-GHz LTS/HTS NMR magnet,” IEEE Trans. Applied Superconductivity, vol. 15, no. 2, pp. 1299–1302, June 2005. [Google Scholar]
- [4].Bascuñán J, Kim W, Hahn S, Bobrov ES, Lee H, and Iwasa Y, “An LTS/HTS NMR magnet operated in the range 600–700 MHz,” IEEE Trans. Applied Superconductivity, vol. 17, no. 2, pp. 1446–1449, June 2007. [Google Scholar]
- [5].Bloch F, Hansen WW, and Packard M, “The nuclear induction experiment,” Phys. Rev, vol. 70, pp. 474–485, 1946. [Google Scholar]
- [6].Gu C, Qu T, and Han Z, “Measurement and calculation of residual magnetic field in a Bi2223/Ag Magnet,” IEEE Trans. Applied Super-conductivity, vol. 17, pp. 2394–2397, June 2007. [Google Scholar]
- [7].Anderson W and Kim YB, “Hard superconductivity: Theory of the motion of Abrikosov flux lines,” Rev. Mod. Phys, vol. 36, pp. 39–43, January 1964. [Google Scholar]


