

Abstract
Farms usually apply excessive nitrogen (N) fertilizers, especially in a vegetable production system, resulting in severe N leaching loss. Although there have been some reports on the impact of biochar on the N leaching in farmlands, most of them focused on field crops in temperate or subtropical religions. Limited information about N leaching in the tropical vegetable system is available regarding the quantitative data and effective countermeasures. A field experiment was conducted to quantify N leaching in a tropical leafy production system (Ipomoea aquatica Forsk) and to evaluate the effects of coconut shell biochar on N loss and crop growth. The results showed that compared to conventional fertilization with the 240 kg N ha−1 application rate (NPK), biomass yield of water spinach increased by 40.1% under the high biochar application rate of 48 t ha−1 (HBC), which was significantly higher than that of NPK treatment. Moreover, The HBC treatment decreased N leaching by 34.0%, which can be attributed to enhanced crop uptake which increased by 40.3% as compared to NPK treatment. The NH4+/NO3− ratio in leachates was between 0.01 and 0.05. It was concluded that coconut shell derived biochar improved the biomass yields of water spinach and reduced the leaching N loss, which provides a promising amendment in tropical regions.
Subject terms: Environmental chemistry, Environmental impact
Introduction
Excessive chemical fertilizers are often applied to maintain or enhance agricultural productivity under the pressures of shrinking land area per capita. The average chemical fertilizer usage per hectare in China has increased from 86.7 kg ha−1 in 1980 to 359 kg ha−1 in 2016, about 3.3 times that of the United States and 3.6 times that of the world average1. The average N input for vegetable crops was raised to 588 kg ha−1 according to the 2013–2015 survey, which was 2.7 times the recommended for open-field vegetables in China, respectively2,3. Excessive chemical fertilizers have caused many environmental problems, including soil acidification, water and air pollution4,5. One of the most common environmental concerns is NO3− leaching into underground water and caused great risk for human health6,7.
Biochar is a carbon-rich product made by pyrolysis of organic matter under partial or complete exclusion of oxygen8. Biochar can be produced from various feedstocks. It is composed of condensed aromatic groups that are partially responsible for its highly biochemical recalcitrance than many other forms of organic matter in soil9. Biochars are highly porous, usually alkaline, and exhibit large specific surface area10. Owing to these inherent physicochemical properties, biochar affects many soil properties including soil pH, organic matter, water holding capacity and microbial composition and diversity11,12. In addition, oxidation of biochar at a slow rate in soil leads to the production of negatively-charged functional groups, such as carboxyl and phenolic groups13,14. The presence of these groups implies a high density of functional groups at the surface of biochar particles that interact with nutrient ions by electrostatic, complexation, or capillary forces15,16. These properties of biochars can reduce the leaching of nutrients from soil and subsequent accessibility of nutrients to crops17.
As a promising soil amendment, there has been an increased interest in biochar research in recent years due to its potential beneficial effects on soil properties and water remediation18,19. It has the potential to be a low cost and efficient sorbent for NH4+ and NO3−20 and may reduce N leaching and increase crop yields21,22. NH4+ could be adsorbed on the surface of biochar by cation exchange and entrapped in its pore structures. Furthermore, NO3− could be also adsorbed as a result of exchange reactions between base functional groups20,23,24. However, biochar addition to soil showed inconsistent results on crop growth, soil properties and nutrient N leaching10,23–26 because biochar properties vary widely, depending on the biomass source, pyrolysis temperature (350–900 °C) and application rate (4–90 t ha−1)8,20,27,28.
In many tropical regions, organic wastes from the processing of coconut are widely generated and mostly they are destined for landfills29. An alternative way to reuse the coconut shells may be the production of biochar to keep a sustainable organic matter cycle. Water spinach (Ipomoea aquatica Forsk) is a kind of common leafy vegetables in the South of China. There is limited information about the impacts of biochar on water spinach and tropical vegetable production system. The present research was aimed at (1) comparing the efficiency of soil amendments on the growth of water spinach; (2) determining whether biochar could effectively reduce N leaching.
Results
Growth of water spinach and N use efficiency
The biomass of water spinach was harvested three times during the experiment (Fig. 1). The first harvest had obvious biomass due to the short growth period (26 days) than that of the other two times (33 days). Significant differences occurred in every harvest dry biomass between the treatments. Biochar amendment promoted the growth of water spinach. The accumulative dry biomass yields of spinach amended with biochar was from 1357 to 1678 kg ha−1, which was 13.3–40.1% more than that of chemical fertilizer treatment (NPK, 1197 kg ha−1). The difference in biomass yield between the treatments of NPK plus a high biochar rate (HBC, 48 t ha−1) and NPK was significant (P ≤ 0.05), whereas the difference was not significant when manure was applied, although the increase was 18%, as compared to NPK treatment.
Figure 1.
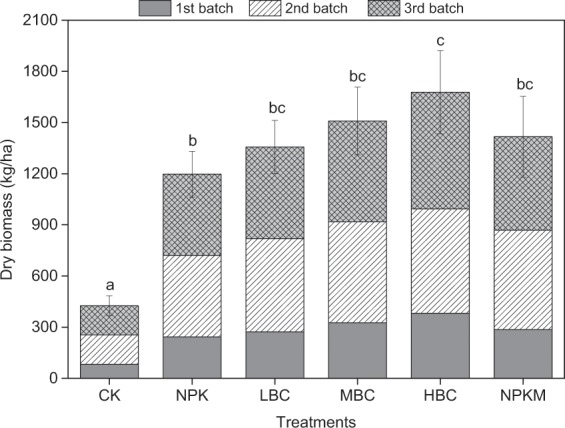
Harvested biomass yields of water spinach during the experiment. The same letter on the top of vertical bars indicates no significant difference in the accumulative dry biomass yield of water spinach at the 0.05 level. CK-control (without N fertilizer and soil amendments); NPK- conventional chemical fertilization; LBC, MBC and HBC- chemical fertilizer (NPK) plus 12 t ha−1, 24 t ha−1, 48 t ha−1 biochar, respectively; NPKM-NPK plus 12 t ha−1 manure.
Biochar addition increased N use efficiency (NUE) by water spinach (Fig. 2). The NUE was ~6% higher with biochar at the high application rate than that of NPK treatment (P ≤ 0.05), and there were significant differences between them. Medium rate of biochar had a similar NUE of NPKM, and slightly higher than that of low biochar rate.
Figure 2.

N use efficiency (NUE) by water spinach with different treatments. Different lowercase letters on the top of vertical bars indicate significant differences between treatments (P < 0.05). CK-control (without N fertilizer and soil amendments); NPK- conventional chemical fertilization; LBC, MBC and HBC- chemical fertilizer (NPK) plus 12 t ha−1, 24 t ha−1, 48 t ha−1 biochar, respectively; NPKM-NPK plus 12 t ha−1 manure.
N leaching
The amount of leached N from different treatment was determined by its concentration in the leachate multiplied with the amount of leachate. The cumulative amount of leached N reflected the concentration of N in the leachate and the leachate volume. Due to minor differences in leachate volume among all the treatments (Supplementary Fig. 1), the leaching N was more related to mineral N concentration (Supplementary Fig. 2). The amount of leached N was highest in the 7 days after planting before root systems of water spinach established (Fig. 3). Afterwards, leachate NO3−-N and NH4+-N declined with the growth of water spinach (Figs. 4 and 5). The accumulative leachate N during the experiment was the highest for NPK (60.3 kg ha−1), 34.0% higher than that of HBC (39.5 kg ha−1).
Figure 3.

The leaching mineral-N as affected by different treatments during the water spinach growing season. Different lowercase letters on the top of vertical bars indicate significant differences between treatments (P < 0.05). CK-control (without N fertilizer and soil amendments); NPK- conventional chemical fertilization; LBC, MBC and HBC- chemical fertilizer (NPK) plus 12 t ha−1, 24 t ha−1, 48 t ha−1 biochar, respectively; NPKM-NPK plus 12 t ha−1 manure.
Figure 4.
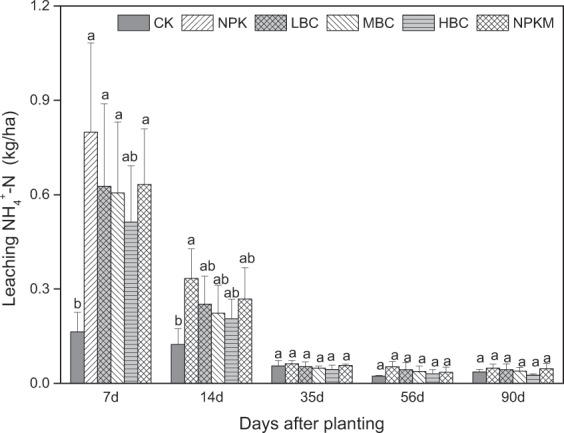
The leaching NH4+-N as affected by different treatments during the water spinach growing season. Different lowercase letters on the top of vertical bars indicate significant differences between treatments (P < 0.05). CK-control (without N fertilizer and soil amendments); NPK- conventional chemical fertilization; LBC, MBC and HBC- chemical fertilizer (NPK) plus 12 t ha−1, 24 t ha−1, 48 t ha−1 biochar, respectively; NPKM-NPK plus 12 t ha−1 manure.
Figure 5.

The leaching NO3−-N as affected by different treatments during the water spinach growing season. Different lowercase letters on the top of vertical bars indicate significant differences between treatments (P < 0.05). CK-control (without N fertilizer and soil amendments); NPK- conventional chemical fertilization; LBC, MBC and HBC- chemical fertilizer (NPK) plus 12 t ha−1, 24 t ha−1, 48 t ha−1 biochar, respectively; NPKM-NPK plus 12 t ha−1 manure.
Regardless of treatments and days after planting, more N in the leachate occurred as NO3− than NH4+ (Supplementary Figs. 3 and 4). The NH4+/NO3− ratio in the leachate was from 0.01 to 0.05. For NPK, the NO3−-N concentration in the leachate was 42.5 mg L−1 in the initial leachate and 16.4 mg L−1 at the end of the experiment. These values were 30.3% and 39.0% higher than that of HBC during the corresponding periods.
Soil mineral N
Soil mineral N content at the 0–30 cm soil depth before the experiment was 8.82 mg kg−1 and decreased to 6.81 mg kg−1 for CK at the end of the experiment. Soil NO3−-N content for HBC treatment was 5.72 mg kg−1 and was significantly higher than CK and NPKM treatments (Fig. 6). Soil NH4+-N content was from 5.64 mg kg−1 to 12.4 mg kg−1; there was no significant difference between the fertilization treatments. The NH4+/NO3− ratios of biochar treatments (2.1–2.5) were lower than those of NPK and NPKM treatments (2.8–3.0).
Figure 6.
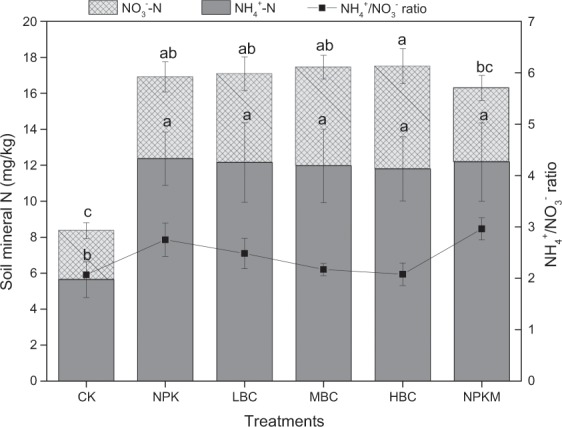
Soil mineral N and NH4+/NO3− ratio at the end of the experiment. Different lowercase letters on the top of vertical bars indicate significant differences between treatments (P < 0.05). CK-control (without N fertilizer and soil amendments); NPK- conventional chemical fertilization; LBC, MBC and HBC- chemical fertilizer (NPK) plus 12 t ha−1, 24 t ha−1, 48 t ha−1 biochar, respectively; NPKM-NPK plus 12 t ha−1 manure.
N balance
The N balance in the open-field water spinach production system was greatly affected by the treatments (Table 1). N input (which was the sum of N from fertilizer, soil mineralization, and mineral N before planting) ranged from 64.3 kg ha−1 for CK to 304 kg ha−1 for the other treatments. Fertilizer was the dominant N input. Compared with NPK, N output of biochar treatments increased by 5.27%-18.4%.
Table 1.
The amounts of N losses (kg ha−1) in the tropical water spinach production system as affected by biochar amendment.
| Items | Treatments | ||||||
|---|---|---|---|---|---|---|---|
| CK | NPK | LBC | MBC | HBC | NPKM | ||
| Input | Urea | 0.00 ± 0.00 b | 240 ± 0.00 a | 240 ± 0.00 a | 240 ± 0.00 a | 240 ± 0.00 a | 240 ± 0.00 a |
| Mineralization | 25.9 ± 3.91 a | 25.9 ± 3.91 a | 25.9 ± 3.91 a | 25.9 ± 3.91 a | 25.9 ± 3.91 a | 25.9 ± 3.91 a | |
| 0–30 cm soil mineral N at the beginning of experiment | 38.4 ± 6.23 a | 38.4 ± 6.23 a | 38.4 ± 6.23 a | 38.4 ± 6.23 a | 38.4 ± 6.23 a | 38.4 ± 6.23 a | |
| Output | Crop uptake | 10.7 ± 1.81 c | 35.1 ± 5.17 b | 39.5 ± 6.95 ab | 44.3 ± 7.25 ab | 49.2 ± 9.55 a | 42.5 ± 8.54 ab |
| 0–30 cm soil mineral N at the end of experiment | 30.1 ± 5.16 b | 60.9 ± 8.11 a | 61.5 ± 10.9 a | 62.9 ± 9.65 a | 63.1 ± 9.48 a | 58.7 ± 10.2 a | |
| N loss | Apparent N loss | 23.6 ± 2.49 b | 208 ± 8.14 a | 203 ± 11.4 a | 197 ± 10.8 a | 192 ± 13.4 a | 203 ± 11.0 a |
| N leaching loss | 23.4 ± 3.38 b | 54.7 ± 11.9 a | 45.2 ± 13.6 ab | 43.8 ± 15.5 ab | 36.1 ± 12.2 ab | 47.8 ± 11.4 a | |
| N leaching/Apparent N loss | 99.6 ± 12.9 a | 26.4 ± 6.59 b | 22.5 ± 7.83 b | 22.6 ± 9.34 b | 19.2 ± 7.89 b | 23.8 ± 7.06 b | |
Different lowercase letters on the top of vertical bars indicate significant differences between treatments (P < 0.05). CK-control (without N fertilizer and soil amendments); NPK- conventional chemical fertilization; LBC, MBC and HBC- chemical fertilizer (NPK) plus 12 t ha−1, 24 t ha−1, 48 t ha−1 biochar, respectively; NPKM-NPK plus 12 t ha−1 manure.
N losses caused by leaching ranged from 19.2 to 26.4%. In both years, N leaching loss was highest in the system managed according to the conventional farming practice (NPK) and was lowest in the system of HBC. Crop uptake N was highest for MBC, although there were no significant differences between fertilization treatments. Compared with NPK, biochar addition increased crop N uptake by 12.6–40.1%, reduced N leaching by 17.3–34.0%, and total N loss by 2.4–7.8%.
Discussion
Biochar increased vegetable yield in tropical religion
Biochar has been proven a renewable resource and eco-friendly material for improving soil fertility and increasing crop yields30. Although there are controversies regarding the extent and cause of positive benefits, biochar is widely used to boost crop yield31. In the tropics, water spinach commonly grows in acidic Oxisols with a low content of soil organic C and nutrients. Biochar amendment increased water spinach biomass by 13–40%, as compared to control (Fig. 1). The yield increase by biochar can be attributed to (i) increased nutrient supply for crop growth; (ii) enhanced water availability; (iii) improved soil quality; (iv) suppressing of soil-borne plant diseases30,32,33. Moreover, yield response to biochar has shown to be more evident on acid soils in the tropical regions than on neutral/alkaline soils in the temperate34. The global-scale meta-analysis by Jeffery et al. (2017) 31 indicated that biochar had on average no effect on crop yield in the temperate regions, yet elicited a 25% average increase in crop yield in the tropics. Moreover, the physicochemical properties of biochar also affected the extent of crop yield benefit35. For instance, the coconut shell biochar with higher pH and micropore specific surface area was more useful for improving soil fertility, nutrient availability and crop growth.
N leaching in vegetable systems
Application rates of fertilizers in vegetable production systems often exceed crop requirements, resulting in a high accumulation of nutrients in the soil36. Soil NO3− leaching was influenced by crop type, soil properties, irrigation management, and rainfall37. In this study, N leaching in the water spinach production system amounted to 36.1–54.7 kg ha−1 during the 90 days of the experiment (Fig. 5), which is consistent with the report by Chotangui et al.38. Wang et al.39 quantified the nitrate leaching by conducting a meta-analysis and pointed that NO3−-N leaching over the entire crop growing season in Chinese vegetable systems averaged 79.1 kg ha−1 under the high N inputs (on average 423 kg ha−1). Moreover, due to the low capacity to retain anions in soils, NO3− is more prone to leaching than NH4+40. Therefore, NH4+ concentration in leachates was far lower than NO3−, and the NH4+/NO3− ratio was only 0.01 to 0.05 (Figs. 5 and 6), which is consistent with the report by Zhang et al.41.
Biochar decreased N leaching loss
Biochar addition has been shown to increase nutrient retention in highly weathered soils through different mechanisms including sorption of NO3−, NH4+ and organic-N; alteration of cation and anion exchange capacity and changes in microbial processes and activities42. Significant NO3− adsorption occurred at pyrolysis temperatures ≥700 °C20. In the present study, as compared to control (application of 240 kg N ha−1 without biochar), biochar-amended treatment decreased N leaching by 17.3–34.0% (Fig. 5). Related research showed that negatively charged functional groups on biochar surface could adsorb positively charged NH4+8,42. It was reported that NO3− retention driven by anion exchange with oxonium and pyridinium groups also occurred22. Kameyama et al.43 reasoned that the adsorption of NO3− was a result of base functional groups and not a result of physical adsorption since surface area and micropore volumes followed different trends. Other mechanisms for reducing N leaching loss in the biochar-amended soils included enhanced N assimilation by crops and improved soil structure44. Enhanced N assimilation by water spinach was observed in the present study (Table 1). Biochar increased N uptake by 12.6–40.3%, as compared to control.
NUE and N balance
The high-yield vegetable production systems in China were dependent on the intensive input of fertilizers over the past decades, especially N fertilizers, which have lowered NUE in croplands. In this present study, NUE of water spinach was 10.3–16.2% (Fig. 2), which is consistent with previous studies45,46, but lower than the average NUE of open-air and greenhouse vegetable production systems in China47.
Nitrogen balance, defined as the difference between N inputs and outputs, can be used as an indicator to reveal N loss in the vegetable cropping systems47–49. In this present study, N leaching accounted for 19.2–26.4% of total N losses (Table 1), and other loss could include runoff, NH3 volatilization, and gaseous emissions from nitrification and denitrification50. Previous studies indicated that NH3 volatilization loss to N input accounted for 18–24% of the total N input in the vegetable production systems51, and the proportion increased with the application of urea23,52. The nitrous oxide emissions (N2O) for vegetable fields were only around 0.94% of applied N fertilizer53.
Conclusion
Concerns about nitrate contamination to groundwater and agricultural sustainable development have been impelling us to apply effective technologies to decrease N environmental loss and promote N use efficiency. In the present study, compared to conventional chemical fertilization treatment, biomass yield of water spinach increased by 13.3–40.1% with biochar amendment. Biochar addition also decreased N leaching by 17.3–34.0%, which is mainly attributed to enhanced crop uptake of N by 12.6–40.3% as compared to control. It was concluded that coconut shell derived biochar improved the biomass yields of water spinach and reduced the leaching N loss, which provides a promising amendment in tropical regions.
Materials and Methods
Experiment site
The field experiment was conducted on the Danzhou Experiment Station of Chinese Academy of Tropical Agricultural Science (19°30′36′′ N, 109°29′40′′ E). This region is characterized by a tropical monsoon climate with an average annual rainfall of 1815 mm and a mean annual temperature of 23.5 °C. The soil was derived from granite material, classified as Oxisol with a sandy loam texture. The surface soil (0–30 cm) had pH (H2O) 6.02, organic C 5.61 g/kg, total N, P and K of 0.96, 0.24 and 0.29 g kg−1, available N, P and K of 60.7, 9.28 and 41.6 mg kg−1.
Experiment design and agricultural management practices
Water spinach (Ipomoea aquatica Forsk) is a kind of typical leafy vegetable in tropical region of China, which is most commonly grown in East, South and Southeast Asia. The experiment was conducted from July 1 to September 30, 2017, with three water spinach harvests. The seeds of water spinach (var. Ching Quat) were tested. The experiment was a completely randomized design with six treatments and three replications. Six treatments were: no N fertilizer and no soil amendments (CK), conventional chemical fertilizer (NPK), NPK plus a low biochar rate (LBC, 12 t ha−1), NPK plus a moderate biochar rate (MBC, 24 t ha−1), NPK plus a high biochar rate (HBC, 48 t ha−1) and NPK plus manure (NPKM, 12 t ha−1). Agricultural practices except for fertilizer management were identical for all the treatments. According to the local recommendation of leafy vegetable, all the treatments except for CK had the same N, P2O5 and K2O input, which were 240, 96 and 192 kg ha−1, respectively; 40% N, 100% P and 40% K are applied as base fertilizers by mixing with the topsoil (0–30 cm) and 100% amendments (biochar or manure) as urea, calcium superphosphate and potassium sulfate. 30% N and 30% K are applied after the second and third harvest, respectively. Coconut shells were crushed and then were pyrolyzed in a sealed stove. The pyrolysis temperature was raised to 700 °C at a ramp rate of 20 °C min−1 and lasted for 2 h. The biochar had a pH (H2O) 10.2, content of C 65.7%, H 2.43%, N 0.55%, S 0.08%, P 0.16%, K 1.11% and micropore specific surface area 152.8 m2/g. Manure with 21% C, 2.2% N, 1.2% P and 1.4% K was acquired from a local fertilizer shop. The experiment consisted of 18 field plots (each 2.0 × 2.0 m), which were separated from each other by an anti-seepage film and cement bricks (600-mm depth) to prevent lateral water movement.
Collection of soil and plant samples and measurements
All the aboveground tissues of water spinach were harvested three times during the experiment and the harvested biomass from each plot was weighed. The subsamples were oven-dried to a constant weight at 75 °C to calculate the water content of biomass, and the dried plant samples were powdered and analyzed for total N concentration using a CHNS element analyzer (Vario EL III, Elementary, Hanau, Germany)54.
After harvest, the 0–30 cm soil layer was sampled using a stainless steel auger (15 mm interior diameter). Soil pH was determined in water at the 1:2.5 soil to solution ratio. Mineral N in soil (NH4+-N and NO3−-N) was extracted by 1 M KCl and NH4+-N concentration in extracts was determined with the colorimetric-indophenol blue method55 and NO3−-N concentration using a dual-wavelength spectrophotometry (Hitachi U-2100; Hitachi, Tokyo, Japan)56.
Soil leachate sampling and analysis
Eighteen lysimeters (one per plot) were installed in the field before the basal fertilizer was applied57. Each lysimeter consisted of a 350-mm-diameter polyvinyl chloride (PVC) cover and a plastic bucket. The PVC cover was at 600-mm-depth below the ground with holes, filtering mesh and sandy gravels filled up to 50-mm-depth. The plastic bucket was used for collecting leachates. This allowed soil solution to drain from the sandy gravel cover and to be collected as leachate in the buckets by vacuum pump. The leachate was collected on day 7, 14, 35, 56 and 90. Total leachate volume was recorded, and subsamples were analyzed for NH4+-N and NO3−-N concentration with the colorimetric-indophenol blue method and dual-wavelength spectrophotometry, respectively.
Data analysis
N use efficiency (NUE) of water spinach was calculated with the following equation58:
where Ntreat and Ncontrol are crop N uptake by the aboveground biomass with and without N fertilization, respectively. Nfert is N application rate.
Apparent N loss from the water spinach production system was calculated according to Widowati et al. and Zhang et al.59:
where Ninitial and Nend are soil mineral N (sum of NH4+ and NO3−) at the 0–30 cm depth at the initial and end of the experiment. Ncrop is the N uptake by the aboveground of water spinach. Nmin is the soil N mineralized within the vegetable growing period, and was calculated as follows41:
All data were analyzed by one-way analyses of variance (ANOVAs) with SPSS (version 16.0). When an ANOVA was significant, means were compared using the Duncan multi-range test. The significant level was set at P < 0.05. Figures and tables were generated with Microsoft Excel 2010 and Origin 8.0. The data were expressed as mean ± standard deviation (n = 3).
Supplementary information
Acknowledgements
This research was supported by Special Fund for Agro-scientific Research in the Public Interest (201503106), National Natural Science Foundation of China (31401945), Major Science and Technology Program of Hainan Province (ZDKJ2017002), Central Public-interest Scientific Institution Basic Research Fund for Chinese Academy of Tropical Agricultural Sciences (1630042017004 & 2018hzs1J001) and China Scholarship Council (201708460027).
Author contributions
F.Z. and G.Z. conducted the experiment. G.Z., Y.S., Z.D. and M.D. were involved in the field experiment. F.Z. and Z.H. analyzed the data and prepared the manuscript.
Competing interests
The authors declare no competing interests.
Footnotes
Publisher’s note Springer Nature remains neutral with regard to jurisdictional claims in published maps and institutional affiliations.
These authors contributed equally: Fengliang Zhao and Ganghua Zou.
Supplementary information
is available for this paper at 10.1038/s41598-019-56663-w.
References
- 1.Wang P, et al. Does Fertilizer Education Program Increase the Technical Efficiency of Chemical Fertilizer Use? Evidence from Wheat Production in China. Sustainability. 2019;11:543. doi: 10.3390/su11020543. [DOI] [Google Scholar]
- 2.Huang, S. et al. Reducing potential of chemical fertilizers and scientific fertilization countermeasure in vegetable production in China. J. Plant Nutr. Fertil23, 1480–1493 (in Chinese) (2017).
- 3.Wang R, et al. N and P runoff losses in China’s vegetable production systems: Loss characteristics, impact, and management practices. Science of The Total Environment. 2019;663:971–979. doi: 10.1016/j.scitotenv.2019.01.368. [DOI] [PubMed] [Google Scholar]
- 4.Dong Y, Xu L. Aggregate risk of reactive nitrogen under anthropogenic disturbance in the Pearl River Delta urban agglomeration. Journal of Cleaner Production. 2019;211:490–502. doi: 10.1016/j.jclepro.2018.11.194. [DOI] [Google Scholar]
- 5.Zhao F, et al. Purifying eutrophic river waters with integrated floating island systems. Ecological Engineering. 2012;40:53–60. doi: 10.1016/j.ecoleng.2011.12.012. [DOI] [Google Scholar]
- 6.Li, S. & Chen, G. Contemporary strategies for enhancing nitrogen retention and mitigating nitrous oxide emission in agricultural soils: present and future. Environment, Development and Sustainability, 1–39 (2019).
- 7.Cai Y, Akiyama H. Nitrogen loss factors of nitrogen trace gas emissions and leaching from excreta patches in grassland ecosystems: A summary of available data. Science of the Total Environment. 2016;572:185–195. doi: 10.1016/j.scitotenv.2016.07.222. [DOI] [PubMed] [Google Scholar]
- 8.Singh BP, et al. Influence of biochars on nitrous oxide emission and nitrogen leaching from two contrasting soils. Journal of Environmental Quality. 2010;39:1224–1235. doi: 10.2134/jeq2009.0138. [DOI] [PubMed] [Google Scholar]
- 9.Guo JH, Chen BL. Insights on the Molecular Mechanism for the Recalcitrance of Biochars: Interactive Effects of Carbon and Silicon Components. Environmental Science & Technology. 2014;48:9103–9112. doi: 10.1021/es405647e. [DOI] [PubMed] [Google Scholar]
- 10.Glaser B, Lehmann J, Zech W. Ameliorating physical and chemical properties of highly weathered soils in the tropics with charcoal–a review. Biology and fertility of soils. 2002;35:219–230. doi: 10.1007/s00374-002-0466-4. [DOI] [Google Scholar]
- 11.Chan KY, et al. Agronomic values of greenwaste biochar as a soil amendment. Soil Research. 2008;45:629–634. doi: 10.1071/SR07109. [DOI] [Google Scholar]
- 12.Xu H-J, et al. Biochar impacts soil microbial community composition and nitrogen cycling in an acidic soil planted with rape. Environmental science & technology. 2014;48:9391–9399. doi: 10.1021/es5021058. [DOI] [PubMed] [Google Scholar]
- 13.Kuzyakov Y, et al. Black carbon decomposition and incorporation into soil microbial biomass estimated by 14C labeling. Soil Biology and Biochemistry. 2009;41:210–219. doi: 10.1016/j.soilbio.2008.10.016. [DOI] [Google Scholar]
- 14.Liang B, et al. Black carbon increases cation exchange capacity in soils. Soil Science Society of America Journal. 2006;70:1719–1730. doi: 10.2136/sssaj2005.0383. [DOI] [Google Scholar]
- 15.Glaser B. Prehistorically modified soils of central Amazonia: a model for sustainable agriculture in the twenty-first century. Philosophical Transactions of the Royal Society B: Biological Sciences. 2007;362:187–196. doi: 10.1098/rstb.2006.1978. [DOI] [PMC free article] [PubMed] [Google Scholar]
- 16.Moreno-Castilla C. Adsorption of organic molecules from aqueous solutions on carbon materials. Carbon. 2004;42:83–94. doi: 10.1016/j.carbon.2003.09.022. [DOI] [Google Scholar]
- 17.Lehmann J, et al. Nutrient availability and leaching in an archaeological Anthrosol and a Ferralsol of the Central Amazon basin: fertilizer, manure and charcoal amendments. Plant Soil. 2003;249:343–357. doi: 10.1023/A:1022833116184. [DOI] [Google Scholar]
- 18.Kuppusamy S, et al. Agronomic and remedial benefits and risks of applying biochar to soil: current knowledge and future research directions. Environment international. 2016;87:1–12. doi: 10.1016/j.envint.2015.10.018. [DOI] [PubMed] [Google Scholar]
- 19.El-Naggar A, et al. Biochar application to low fertility soils: a review of current status, and future prospects. Geoderma. 2019;337:536–554. doi: 10.1016/j.geoderma.2018.09.034. [DOI] [Google Scholar]
- 20.Clough T, et al. A review of biochar and soil nitrogen dynamics. Agronomy. 2013;3:275–293. doi: 10.3390/agronomy3020275. [DOI] [Google Scholar]
- 21.Biederman LA, Harpole WS. Biochar and its effects on plant productivity and nutrient cycling: a meta-analysis. Global Change Biology Bioenergy. 2013;5:202–214. doi: 10.1111/gcbb.12037. [DOI] [Google Scholar]
- 22.Fidel RB, Laird DA, Spokas KA. Sorption of ammonium and nitrate to biochars is electrostatic and pH-dependent. Scientific reports. 2018;8:17627. doi: 10.1038/s41598-018-35534-w. [DOI] [PMC free article] [PubMed] [Google Scholar]
- 23.Bouwman A, Boumans L, Batjes N. Estimation of global NH3 volatilization loss from synthetic fertilizers and animal manure applied to arable lands and grasslands. Global Biogeochemical Cycles. 2002;16:8-1-8-14. [Google Scholar]
- 24.Jeffery S, et al. A quantitative review of the effects of biochar application to soils on crop productivity using meta-analysis. Agriculture, ecosystems & environment. 2011;144:175–187. doi: 10.1016/j.agee.2011.08.015. [DOI] [Google Scholar]
- 25.Liu B, et al. Comparison of efficacies of peanut shell biochar and biochar-based compost on two leafy vegetable productivity in an infertile land. Chemosphere. 2019;224:151–161. doi: 10.1016/j.chemosphere.2019.02.100. [DOI] [PubMed] [Google Scholar]
- 26.Sigua G, et al. Efficacies of designer biochars in improving biomass and nutrient uptake of winter wheat grown in a hard setting subsoil layer. Chemosphere. 2016;142:176–183. doi: 10.1016/j.chemosphere.2015.06.015. [DOI] [PubMed] [Google Scholar]
- 27.Williams PT, Reed AR. Development of activated carbon pore structure via physical and chemical activation of biomass fibre waste. Biomass and Bioenergy. 2006;30:144–152. doi: 10.1016/j.biombioe.2005.11.006. [DOI] [Google Scholar]
- 28.Purakayastha TJ, et al. A review on biochar modulated soil condition improvements and nutrient dynamics concerning crop yields: Pathways to climate change mitigation and global food security. Chemosphere. 2019;227:345–365. doi: 10.1016/j.chemosphere.2019.03.170. [DOI] [PubMed] [Google Scholar]
- 29.Devens KU, et al. Characterization of Biochar from Green Coconut Shell and Orange Peel Wastes. Revista Virtual De Quimica. 2018;10:288–294. doi: 10.21577/1984-6835.20180022. [DOI] [Google Scholar]
- 30.Shaaban M. Biochar: A Tool for Improving Soil Fertility. Acta Scientific Agriculture. 2018;2:1. doi: 10.25081/jsa.2018.v2.868. [DOI] [Google Scholar]
- 31.Jeffery S, et al. Biochar boosts tropical but not temperate crop yields. Environmental Research Letters. 2017;12:1–6. doi: 10.1088/1748-9326/aa67bd. [DOI] [Google Scholar]
- 32.Ding Y, et al. Biochar to improve soil fertility. A review. Agronomy for Sustainable Development. 2016;36–42:36. doi: 10.1007/s13593-016-0372-z. [DOI] [Google Scholar]
- 33.Hailegnaw, N. S. et al. Mutual relationships of biochar and soil pH, CEC, and exchangeable base cations in a model laboratory experiment. Journal of Soils and Sediments, 1–12 (2019).
- 34.Subedi R, et al. Crop response to soils amended with biochar: expected benefits and unintended risks. Italian Journal of Agronomy. 2017;12:161–173. [Google Scholar]
- 35.Cornelissen G, et al. Fading positive effect of biochar on crop yield and soil acidity during five growth seasons in an Indonesian Ultisol. Science of the Total Environment. 2018;634:561–568. doi: 10.1016/j.scitotenv.2018.03.380. [DOI] [PubMed] [Google Scholar]
- 36.Yuge Zhang YJ, Liang W. Accumulation of soil soluble salt in vegetable greenhouses under heavy application of fertilizers. Agr J. 2006;1:123–127. [Google Scholar]
- 37.Lu J, et al. Accumulation and leaching of nitrate in soils in wheat-maize production in China. Agricultural water management. 2019;212:407–415. doi: 10.1016/j.agwat.2018.08.039. [DOI] [Google Scholar]
- 38.Chotangui AH, et al. Evaluation of NO3-N leaching in commercial fields of leafy vegetables by the soil nitrogen balance estimation system. Environmental Control in Biology. 2015;53:145–157. doi: 10.2525/ecb.53.145. [DOI] [Google Scholar]
- 39.Wang X, et al. Nitrate leaching from open-field and greenhouse vegetable systems in China: a meta-analysis. Environmental Science and Pollution Research. 2018;25:31007–31016. doi: 10.1007/s11356-018-3082-z. [DOI] [PubMed] [Google Scholar]
- 40.Pathak B, Kazama F, Toshiaki I. Monitoring of nitrogen leaching from a tropical paddy in Thailand. Agricultural Engineering International: CIGR Journal. 2004;6:2–9. [Google Scholar]
- 41.Zhang B, et al. Reducing nitrogen leaching in a subtropical vegetable system. Agriculture, Ecosystems & Environment. 2017;241:133–141. doi: 10.1016/j.agee.2017.03.006. [DOI] [Google Scholar]
- 42.Bai SH, et al. Wood biochar increases nitrogen retention in field settings mainly through abiotic processes. Soil Biology and Biochemistry. 2015;90:232–240. doi: 10.1016/j.soilbio.2015.08.007. [DOI] [Google Scholar]
- 43.Kameyama K, et al. Influence of sugarcane bagasse-derived biochar application on nitrate leaching in calcaric dark red soil. Journal of Environmental Quality. 2012;41:1131–1137. doi: 10.2134/jeq2010.0453. [DOI] [PubMed] [Google Scholar]
- 44.Sun H, et al. Biochar application mode influences nitrogen leaching and NH3 volatilization losses in a rice paddy soil irrigated with N-rich wastewater. Environmental technology. 2018;39:2090–2096. doi: 10.1080/09593330.2017.1349839. [DOI] [PubMed] [Google Scholar]
- 45.Agneessens L, De Waele J, De Neve S. Review of alternative management options of vegetable crop residues to reduce nitrate leaching in intensive vegetable rotations. Agronomy. 2014;4:529–555. doi: 10.3390/agronomy4040529. [DOI] [Google Scholar]
- 46.Zhu J, et al. Environmental implications of low nitrogen use efficiency in excessively fertilized hot pepper (Capsicum frutescens L.) cropping systems. Agriculture, ecosystems & environment. 2005;111:70–80. doi: 10.1016/j.agee.2005.04.025. [DOI] [Google Scholar]
- 47.Ti C, Luo Y, Yan X. Characteristics of nitrogen balance in open-air and greenhouse vegetable cropping systems of China. Environmental Science and Pollution Research. 2015;22:18508–18518. doi: 10.1007/s11356-015-5277-x. [DOI] [PubMed] [Google Scholar]
- 48.OECD, Environmental performance of agriculture in OECD countries since 1990. Organisation for Economic Co-operation and Development, Paris (2008).
- 49.He W, et al. Estimating soil nitrogen balance at regional scale in China’s croplands from 1984 to 2014. Agricultural Systems. 2018;167:125–135. doi: 10.1016/j.agsy.2018.09.002. [DOI] [Google Scholar]
- 50.Oenema O, et al. Trends in global nitrous oxide emissions from animal production systems. Nutrient cycling in agroecosystems. 2005;72:51–65. doi: 10.1007/s10705-004-7354-2. [DOI] [Google Scholar]
- 51.Gong W, et al. High-resolution measurement of ammonia emissions from fertilization of vegetable and rice crops in the Pearl River Delta Region, China. Atmospheric environment. 2013;65:1–10. doi: 10.1016/j.atmosenv.2012.08.027. [DOI] [Google Scholar]
- 52.Neeteson J, et al. Nutrient balances in field vegetable production systems. XXVI International Horticultural Congress: Toward Ecologically Sound Fertilization Strategies for Field Vegetable Production. Acta horticulturae. 2002;627:13–23. [Google Scholar]
- 53.Rashti MR, et al. Fertiliser-induced nitrous oxide emissions from vegetable production in the world and the regulating factors: A review. Atmospheric Environment. 2015;112:225–233. doi: 10.1016/j.atmosenv.2015.04.036. [DOI] [Google Scholar]
- 54.Plaza C, et al. A comprehensive method for fractionating soil organic matter not protected and protected from decomposition by physical and chemical mechanisms. CLEAN–Soil, Air, Water. 2012;40:134–139. doi: 10.1002/clen.201100338. [DOI] [Google Scholar]
- 55.Lu R. Analysis methods of soil agricultural chemistry. China Agricultural Science and Technology Press, Beijing. 2000;107:147–150. [Google Scholar]
- 56.Huang Y, Ye Y, Yang S. Feasibility of NO3-N determination by dual wavelength spectrophotometric method. Chinese Agricultural Science Bulletin. 2009;25:43–45. [Google Scholar]
- 57.Chen Y, et al. Effects of different irrigation and fertilization practices on nitrogen leaching in facility vegetable production in northeastern China. Agricultural water management. 2018;210:165–170. doi: 10.1016/j.agwat.2018.07.043. [DOI] [Google Scholar]
- 58.Cao Y, Yin B. Effects of integrated high-efficiency practice versus conventional practice on rice yield and N fate. Agriculture, Ecosystems & Environment. 2015;202:1–7. doi: 10.1016/j.agee.2015.01.001. [DOI] [Google Scholar]
- 59.Widowati LR, et al. Nitrogen balances and nitrogen use efficiency of intensive vegetable rotations in South East Asian tropical Andisols. Nutrient cycling in agroecosystems. 2011;91:131. doi: 10.1007/s10705-011-9451-3. [DOI] [Google Scholar]
Associated Data
This section collects any data citations, data availability statements, or supplementary materials included in this article.