Abstract
Monocarboxylate transporter 4 (MCT4) is an H+-coupled symporter highly expressed in metastatic tumors and at inflammatory sites undergoing hypoxia or the Warburg effect. At these sites, extracellular lactate contributes to malignancy and immune response evasion. Intriguingly, at 30–40 mm, the reported Km of MCT4 for lactate is more than 1 order of magnitude higher than physiological or even pathological lactate levels. MCT4 is not thought to transport pyruvate. Here we have characterized cell lactate and pyruvate dynamics using the FRET sensors Laconic and Pyronic. Dominant MCT4 permeability was demonstrated in various cell types by pharmacological means and by CRISPR/Cas9-mediated deletion. Respective Km values for lactate uptake were 1.7, 1.2, and 0.7 mm in MDA-MB-231 cells, macrophages, and HEK293 cells expressing recombinant MCT4. In MDA-MB-231 cells MCT4 exhibited a Km for pyruvate of 4.2 mm, as opposed to >150 mm reported previously. Parallel assays with the pH-sensitive dye 2′,7′-bis-(carboxyethyl)-5-(and-6)-carboxyfluorescein (BCECF) indicated that previous Km estimates based on substrate-induced acidification were severely biased by confounding pH-regulatory mechanisms. Numerical simulation using revised kinetic parameters revealed that MCT4, but not the related transporters MCT1 and MCT2, endows cells with the ability to export lactate in high-lactate microenvironments. In conclusion, MCT4 is a high-affinity lactate transporter with physiologically relevant affinity for pyruvate.
Keywords: metabolism, pyruvate, transporter, cancer, macrophage, Michaelis-Menten, monocarboxylate transporter
Introduction
Cancer cells ferment glucose to lactate in the presence of oxygen, a phenomenon originally described by Otto Warburg and colleagues in the 1920s and later found to promote tumor growth and malignancy (1–4). In addition to fostering glycolysis by end product removal, cytosolic alkalinization, and NADH recycling, the co-extrusion of lactate and protons causes interstitial acidification, which along with lactate itself favors tumor invasiveness and facilitates immune response evasion (5). Lactate levels were double in cervical tumors with metastatic spread compared with malignancies in patients without metastases (6). Lactic acid release is also a physiological process, as in exercising skeletal muscle, in active macrophages and brain astrocytes (7–9). The transport of lactate in most mammalian cells is mediated by members of the slc16a family of H+-coupled monocarboxylate transporters MCTs of which MCT1 (slc16a1), MCT2 (slc16a7), and MCT4 (slc16a3) are widely expressed in healthy tissues (10). Malignant tumors overexpress MCT1 and MCT4, the latter being characteristic of metastatic cancer in association with HIF-1α3 up-regulation (11). Potent small-molecule inhibitors specific for MCT1–2 have been synthetized, one of which is currently undergoing a Phase I clinical trial (12). However, the development of MCT4-specific drugs is lagging.
MCT4-endowed cells, both healthy and cancerous, are the strongest lactate producers. So it seems puzzling that, at about 30 mm (13, 14), the Km of MCT4 for lactate is more than 1 order of magnitude higher than the levels of lactate prevailing in tissues and even within hypoxic tumors (6, 15). Taken at face value, this means that MCT4 runs at a small fraction of its capacity. In contrast, MCT1 has a Km of 3–5 mm. Kinetic transport parameters are determined by measuring initial rates of uptake at increasing concentrations of radiolabeled substrate. Unfortunately, this is not practical for MCTs in mammalian cells, because uptake is too fast, demanding high levels of radioactivity and sophisticated stop-flow devices. The introduction of pH-sensitive dyes in the 1980s revolutionized the field by permitting MCT activity determinations with high spatiotemporal resolution (16, 17). With the additional advantage that any substrate could be studied with the same probe, most of what we know about the function of the monocarboxylate transporters was learned from substrate-induced acidification. However, there was a caveat. To obtain detectable acidifications, experiments had to be done in the absence of bicarbonate. As demonstrated below, pH buffering is a major confounding factor when MCTs are characterized using pH dyes.
Genetically-encoded FRET nanosensors have been recently used by several laboratories to directly monitor lactate and pyruvate dynamics in various cell types, in vitro and in vivo (18–27). During the characterization of a MCT4-rich cell line with a FRET sensor we detected robust transport at low lactate concentrations. The present manuscript describes a set of experiments prompted by that observation.
Results
MCT4 mediates monocarboxylate transport in MDA-MB-231 cells
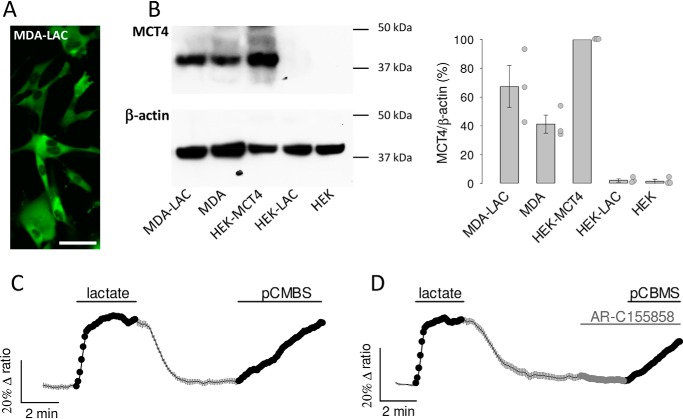
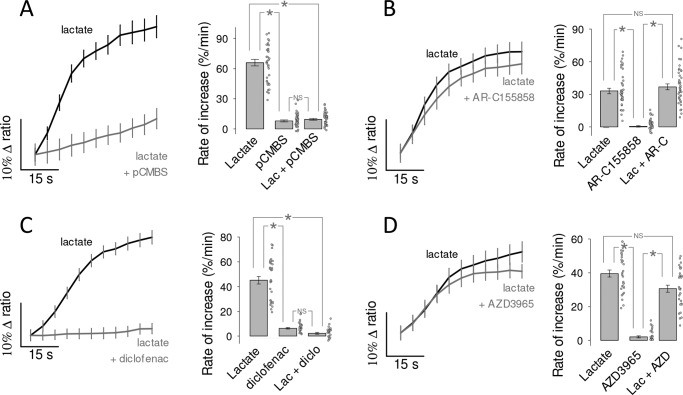
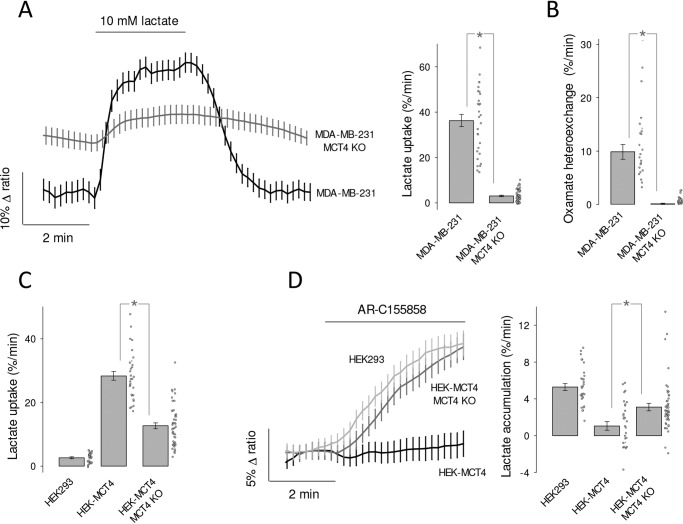
To study the functional properties of MCT4, we expressed the genetically-encoded FRET lactate sensor Laconic (18) in MDA-MB-231 cells, a human breast cancer cell line conspicuous for its high levels of MCT4 and absence of MCT1 (28, 29). Fig. 1A shows MDA-LAC, a cell line generated with MDA-MB-231 cells stably expressing Laconic. Fig. 1B shows that the abundance of MCT4 in these cells is almost as high as that achieved by overexpressing MCT4 in HEK293 cells under the strong cytomegalovirus promoter, and that MCT4 levels are not diminished by expression of the FRET sensor. Exposure of MDA-MB-231 cells to a lactate load caused a rapid increase in intracellular lactate, demonstrative of high permeability (Fig. 1C). The functionality of MCT4 was tested by pharmacological means. As there are no commercially available inhibitors specific for MCT4, we tested compounds of overlapping selectivity. p-Chloromercuribenzenesulfonic acid (pCMBS), which inhibits MCT1 and MCT4 but not MCT2 (30), caused lactate accumulation (Fig. 1C). In contrast AR-C155858 (31), which blocks MCT1 and MCT2 but not MCT4, had no effect (Fig. 1D). Thus, the tonic export of lactate by MDA-MB-231 cells is mediated by MCT4. The insensitivity to AR-C155858 is in agreement with the reported absence of detectable MCT1 expression in these cells (28, 29). Next, the effect of the pharmacological inhibitors was tested on lactate uptake. Consistent with the efflux data, pCMBS blocked the uptake of lactate, whereas AR-C155858 did not (Fig. 2, A and B). Moreover, diclofenac, a structurally-unrelated MCT1 and MCT4 blocker (32), also abrogated the influx of lactate, whereas AZD3965 (33), a structurally-unrelated blocker of MCT1 and MCT2 (but not of MCT4), had no effect (Fig. 2, C and D). In agreement with the pharmacological evidence, genetic deletion of MCT4 in MDA-MB-231 cells using CRISPR/CAS9 caused higher resting intracellular lactate, reduced lactate entry and exit, and reduced lactate/oxamate exchange (Fig. 3). These results provide pharmacological and genetic evidence that MCT4 is responsible for the bidirectional transport of lactate across the plasma membrane of MDA-MB-231 cells.
Figure 1.
MCT4 mediates tonic lactate efflux in MDA-MB-231 cells. A, MDA-MB-231 cells constitutively expressing the lactate sensor Laconic (MDA-LAC). Bar represents 50 μm. B, immunodetection of MCT4 and β-actin in extracts from: MDA-LAC, WT MDA-MB-231 cells (MDA), HEK293 cells transiently expressing MCT4 (HEK-MCT4), HEK293 cells transiently expressing Laconic (HEK-LAC) and WT HEK293 cells (HEK). Position of molecular weight standards is shown. Bar graph shows mean ± S.E. (3 separate preparations). C and D, MDA-MB-231 cells expressing Laconic were exposed to 10 mm lactate and then to 1 μm AR-C155858 and/or 250 μm pCMBS as indicated, mean ± S.E. (10 cells from single experiments, representative of three experiments for each protocol).
Figure 2.
MCT4 mediates the influx of lactate in MDA-MB-231 cells. The uptake of 10 mm lactate by MDA-LAC cells was monitored before and during exposure to MCT inhibitors, mean ± S.E. (10 cells from single experiments). Bar graphs show the initial rates of uptake and the rate of accumulation elicited by the inhibitor itself, mean ± S.E. (30 cells in three experiments). *, p < 0.05 in the Tukey's test. NS, nonsignificant. A, 250 μm pCBMS, inhibits MCT1 and MCT4. B, 1 μm AR-C155858, inhibits MCT1 and MCT2. C, 1 mm diclofenac, inhibits MCT1 and MCT4. D, 10 μm AZD3965, inhibits MCT1 and MCT2.
Figure 3.
Effect of genetic MCT4 deletion on lactate dynamics in MDA-MB-231 and HEK-MCT4 cells. A, WT and MCT4-KO MDA-MB-231 cells were exposed to 10 mm lactate, as indicated. Data are from 10 cells from representative experiments (mean ± S.E.). Note that MCT4-KO cells maintain a higher resting lactate concentration. Bar graphs show rates of lactate uptake (mean ± S.E. of 30–50 cells in three experiments; *, p < 0.05 in the Mann-Whitney test). B, lactate efflux from WT and MCT4-KO MDA-MB-231 cells was monitored immediately after extracellular lactate (1 mm) was replaced by 6 mm sodium oxamate (mean ± S.E. of 30–50 cells in three experiments; *, p < 0.05 in the Mann-Whitney test). C, the uptake of 10 mm lactate in the presence of 1 μm AR-C155858 was measured in HEK293, HEK-MCT4, and HEK-MCT4-MCT4KO cells. Data from 30 cells in three experiments (mean ± S.E.; *, p < 0.05 in the Mann-Whitney test). D, HEK293, HEK-MCT4 and HEK-MCT4-MCT4-KO cells were exposed to 1 μm AR-C155858 in the presence of 2 mm glucose. Data are from 10 cells from representative experiments (mean ± S.E.). Bar graphs summarize the results of three experiments (mean ± S.E. of 30–50 cells in three experiments; *, p < 0.05 in the Mann-Whitney test).
MCT4 of MDA-MB-231 cells is a high affinity lactate/pyruvate transporter
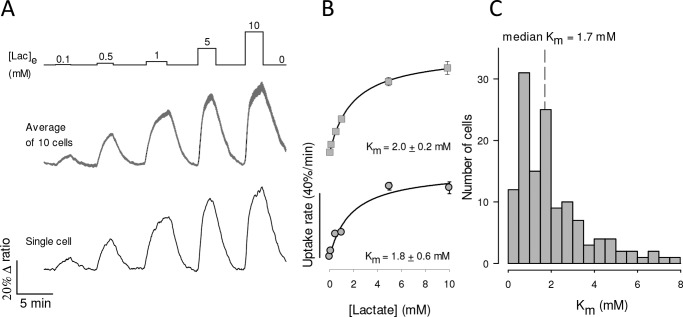
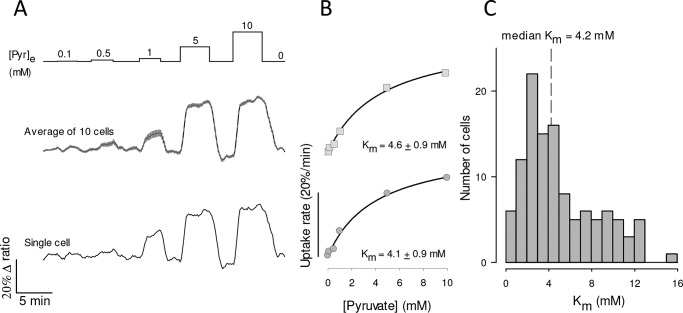
The affinity of MCT4 for lactate was determined by exposing MDA-MB-231 cells expressing the FRET sensor to an increasing extracellular concentration of lactate, as described previously in MCT1-expressing cardiomyocytes (20). Given the dynamic range and kinetic parameters of the Laconic sensor and insensitivity to oxamate heteroexchange, the basal concentration of lactate during the assays was lower than 10 μm, i.e. uptake was measured at 0-trans condition. Control uptakes were routinely included at the beginning and end of the protocol to ensure that measurements were reproducible (data not shown). As illustrated in Fig. 4A, robust lactate uptake was already apparent at low lactate concentrations. Plotting uptake rates against lactate concentration revealed Km values in the low milimolar range (Fig. 4B). To investigate possible confounding effects of experimental conditions, the protocol was repeated in the presence and absence of bicarbonate, at 23 and 35 °C, and in the absence and presence of AR-C155858 (to eliminate possible minor contributions of MCT1 and MCT2), in cells in which Laconic was expressed by transfection, an adenoviral vector, or in a stable cell line. As no strong differences under these experimental conditions were detected, the data were pooled together. The median Km for the uptake of lactate was 1.7 mm (Fig. 4C). In view of this inordinate high affinity for lactate, an analogous experimental approach was applied to characterize the transport of pyruvate, using the FRET sensor Pyronic (19). Reportedly, the affinity of MCT4 for pyruvate obtained in most studies using pH probes is so low that it lies beyond the measurable range (10), with the exception of that described in Ref. 13, which reported a Km of 36 mm. However, we obtained a median Km of 4.2 mm (Fig. 5). Thus, the affinity of MCT4 for lactate and pyruvate in MDA-MB-231 cells was found to be over 1 order of magnitude higher than anticipated.
Figure 4.
High affinity lactate transport in MDA-MB-231 cells. A, MDA-LAC cells were exposed to increasing concentrations of lactate, from 0.1 to 10 mm, as indicated. Responses of intracellular lactate in a single cell (bottom) and in 10 cells from a representative experiment (mean ± S.E., top) are shown. B, dose-response of the initial rate of lactate uptake, from the same cells depicted in A. Mean ± S.E. Km values were obtained by fitting a rectangular hyperbola to the data. C, frequency distribution of Km determinations from 133 cells in 10 experiments. Median Km was 1.7 mm.
Figure 5.
High affinity pyruvate uptake in MDA-MB-231 cells. A, MDA-MB-231 cells expressing pyronic were exposed to increasing concentrations of pyruvate, from 0.1 to 10 mm, as indicated. The responses of a single cell (bottom) and 10 cells from a single experiment (mean ± S.E., top) are shown. B, dose-response of the initial rate of pyruvate uptake, from the same cells depicted in A. Mean ± S.E. and Km values were obtained by fitting a rectangular hyperbola to the data. C, frequency distribution of Km determinations from 117 cells in 13 experiments. The median Km in this series was 4.2 mm.
pH buffering interferes with pH estimation of MCT4 activity
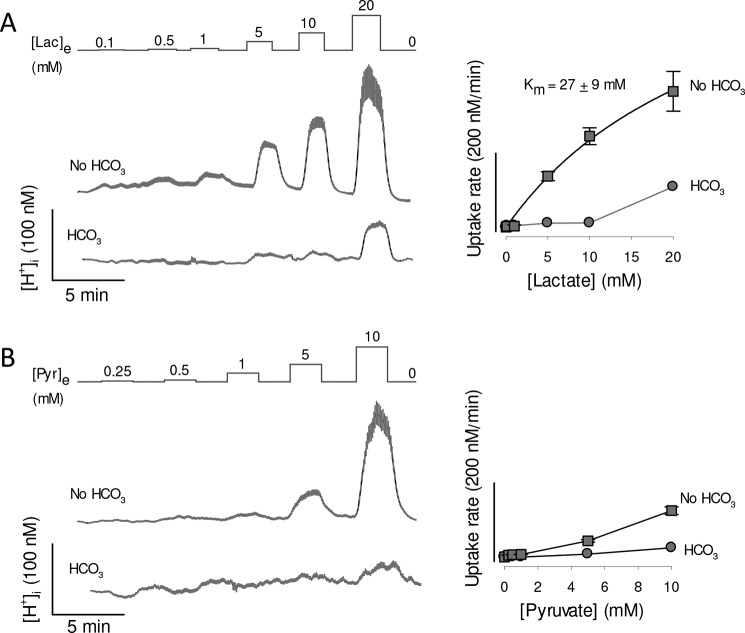
To evaluate MCT4 activity from its effects on intracellular pH, MDA-MB-231 cells were loaded with the pH-sensitive dye 2′,7′-bis-(carboxyethyl)-5-(and-6)-carboxyfluorescein (BCECF). Exposure to lactate did acidify the cells, but in contrast with the accumulation of lactate measured directly with the FRET sensor, the acidification was highly sensitive to bicarbonate (Fig. 6A). In bicarbonate, the rate of acidification induced by lactate did not show saturation. On the contrary, it jumped by a factor of 8 between lactate exposure of 10 and 20 mm. This nonlinear behavior suggests that at 20 mm lactate the flux via MCT4 surpassed the capacity of the cells to muffle protons (Fig. 6A). When bicarbonate was replaced with the impermeant buffer HEPES (no HCO3), intracellular pH became more sensitive to lactate challenges and some degree of saturation appeared (Fig. 6A). A median Km of 27 mm (26 cells from three experiments) could be estimated, which is not deemed accurate as it lies beyond the highest lactate concentration applied. Still, this high Km is in agreement with previous determinations of MCT4 lactate affinity in several cell types using pH, which range from 30 to 40 mm. When BCECF-loaded MDA-MB-231 cells were challenged with pyruvate the results were similar: insensitivity in the presence of bicarbonate and responses being detected in the absence of bicarbonate only at >5 mm pyruvate (Fig. 6B). There was no apparent saturation of the rate of acidification with or without bicarbonate, so that Km values could not be estimated. Of note, bicarbonate omission should not be expected to eliminate the problem of buffering, because bicarbonate represents a minor fraction of the buffering power of mammalian cells (34, 35). In addition to buffering, mammalian cells possess efficient systems for the extrusion of protons, including carbonic anhydrase, Na+/H+ exchangers, and Na+/bicarbonate cotransporters, some of which have recently been found strategically located in the vicinity of MCTs (36). We conclude that pH regulatory mechanisms reduce the impact of MCT4-mediated proton transport on intracellular pH, particularly at low substrate concentrations, introducing a bias in the determination of affinity.
Figure 6.
Lactate- and pyruvate-induced acidification in MDA-MB-231 cells. MDA-MB-231 cells were loaded with the pH-sensitive probe BCECF, which was calibrated as described under “Experimental procedures.” Resting proton concentrations ranged between 36 and 45 nm (pH 7.35 to 7.44). A, cells were exposed to increasing concentrations of lactate, from 0.1 to 20 mm, in the presence and absence of 24 mm HCO3−, equimolarly replaced by HEPES. Traces show intracellular proton concentration of 10 cells (mean ± S.E.) in a single experiment, representative of three. Dose-responses of the rates of acidification are shown in the right graph. The Km was obtained by fitting a rectangular hyperbola to the data in the absence of bicarbonate. B, cells were exposed to increasing concentrations of pyruvate, from 0.25 to 10 mm, in the presence and absence of 24 mm HCO3−, equimolarly replaced by HEPES. Traces show intracellular proton concentration of 10 cells (mean ± S.E.) in a single experiment, representative of three. Dose-responses of the rates of acidification are shown in the right graph.
Recombinant MCT4 is also a high affinity lactate transporter
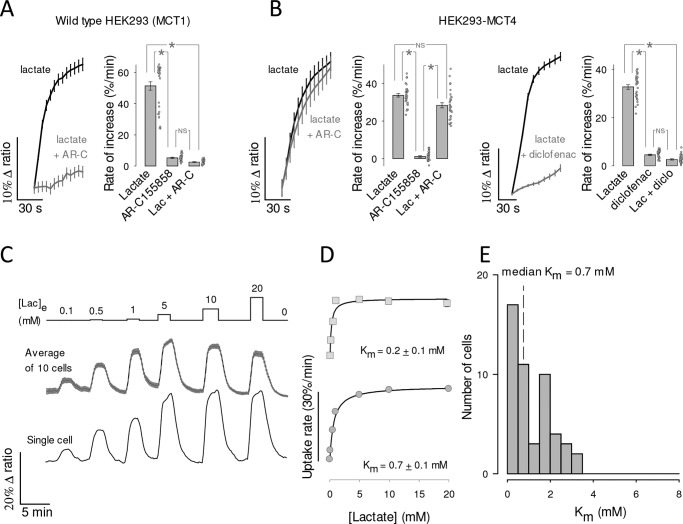
To explore the functional properties of recombinant MCT4, we used HEK293 cells. They possess abundant MCT1 (18) but it is still possible to use them to characterize a foreign transporter if the endogenous MCT1 is blocked pharmacologically, as recently demonstrated for the identification of a Drosophila melanogaster monocarboxylate carrier (25). As expected, the uptake of lactate by WT HEK293 cells was blocked by AR-C155858 (Fig. 7A). Beyond our expectations, overexpression of MCT4 rendered the cells insensitive to the MCT1/2 blocker (Figs. 7B and 3D). We do not know how MCT4 overexpression suppressed the functionality of native MCT1 to such an extent, a phenomenon that may be of physiological interest, as MCT1 and MCT4 may co-exist in the same cells and use the same chaperone basigin/CD147 to reach the plasma membrane (30). A dominant role for MCT4 was confirmed by inhibition of lactate uptake by diclofenac (Fig. 7B) and genetic deletion of MCT4 (Fig. 3). Transport affinity was determined in the presence of AR-C155858 to ensure lack of MCT1 and MCT2 function. We found that HEK293-MCT4 cells transport lactate with a median Km of 0.7 mm (Fig. 7, C–E). Thus, high substrate affinity is also a property of recombinant MCT4.
Figure 7.
High affinity lactate transport in HEK293 cells overexpressing recombinant MCT4. A, HEK293 cells expressing Laconic were exposed to 10 mm lactate in the presence and absence of 1 μm AR-C155858 (mean ± S.E. of 10 cells). The bar graph summarizes the results of three experiments (mean ± S.E. of 30 cells; *, p < 0.05 in the Tukey′s test. NS, nonsignificant). B, HEK293 cells co-expressing MCT4 and Laconic were exposed to 10 mm lactate in the presence and absence of 1 μm AR-C155858 (left panel) or 1 mm diclofenac (right panel), mean ± S.E. of 10 cells. Bar graphs summarize the results of three experiments (mean ± S.E. of 30 cells; *, p < 0.05 in the Tukey's test). C, HEK293 cells co-expressing MCT4 and Laconic were exposed to increasing concentrations of lactate, from 0.1 to 10 mm, as indicated. Responses of intracellular lactate in a single cell (bottom) and in 10 cells from a representative experiment (mean ± S.E., top) are shown. D, dose-response of the initial rate of lactate uptake, from the same cells depicted in C. Km values were obtained by fitting a rectangular hyperbola to the data. E, frequency distribution from 50 cells in five experiments. Median Km was 0.7 mm.
High affinity MCT4-mediated lactate transport in human macrophages
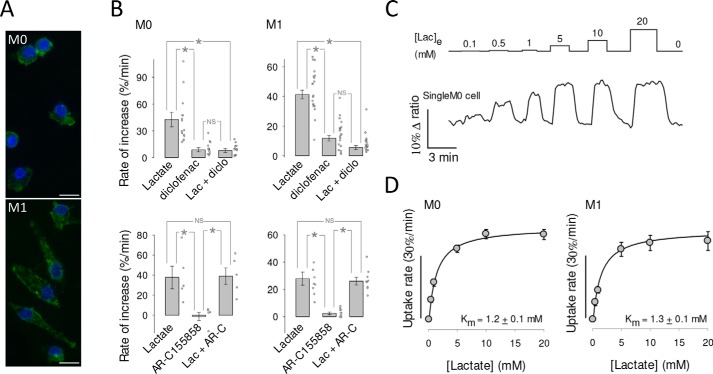
The Warburg effect is important for the activation and operation of macrophages (37, 38), cells characterized by high MCT4 expression (Fig. 8A) (39–41). To study the affinity of MCT4 in these cells, monocytes were isolated from blood samples collected from healthy donors, transformed into macrophages in vitro, and transduced with an adenoviral vector for Laconic. Experiments were carried out with undifferentiated macrophages (M0) and polarized macrophages (M1). In both developmental stages, the uptake of lactate was strongly inhibited by diclofenac but not by AR-C155858, evidencing a preferential role for MCT4 (Fig. 8, C and D). Km values were similar for M0 and M1 macrophages (Fig. 8C), with a pooled average of 1.2 mm.
Figure 8.
High affinity lactate transport in human macrophages. A, undifferentiated (M0) and polarized (M1) macrophages immunostained for MCT4 (green). 4′,6-Diamidino-2-phenylindole (DAPI)-stained nuclei are shown in blue. Bar represents 10 μm. B, the uptake of 1 mm lactate by macrophages was monitored before and during exposure to MCT inhibitors diclofenac (0.5 mm; diclo) or AR-C155858 (1 μm; AR-C). Bar graphs show the initial rates of uptake and the rate of accumulation elicited by the inhibitor itself. Mean ± S.E., 5–20 cells in at least three experiments of each type (*, p < 0.05 in the Tukey's test; NS, nonsignificant) is shown. C, macrophages were exposed to increasing concentrations of lactate, from 0.1 to 20 mm, as indicated. The trace shows the response of an individual M0 macrophage. D, Km values were obtained by fitting a rectangular hyperbola to the data. Mean ± S.E. of 11 cells in three experiments (M0) and 10 cells in three experiments (M1). A pool of M0 and M1 gave a Km of 1.2 ± 0.1 mm (21 cells in six experiments).
MCT4 but not MCT1 or MCT2 can export lactate against high ambient lactate
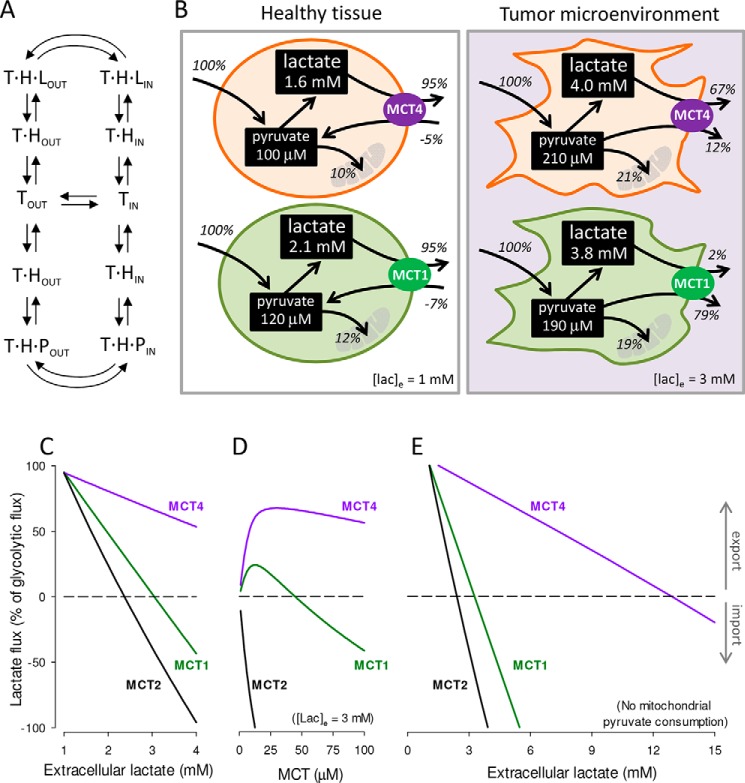
The impact of MCT isoforms on cellular lactate and pyruvate dynamics was gauged using numerical simulation based on the alternating conformer model of the transporter (Fig. 9A) (42). The behaviors of MCT4 and MCT1 were first compared at physiological levels of lactate and pyruvate (Fig. 9B, left panel). Glycolytic cells were simulated by tuning mitochondrial pyruvate consumption and transporter dosage so that lactate was exported at 95% of the glycolytic flux (5, 43). For both isoforms there was pyruvate uptake. It seems remarkable that MCT4 imports almost as much pyruvate as MCT1, despite having an affinity eight times lower. This can be explained by a higher availability of the outward-facing carrier (TIN in Fig. 9A), pushed by lactate on its way out. This pyruvate uptake helps to replenish the intracellular pyruvate pool and thus sustain lactate efflux, which otherwise would be capped at 90% of the glycolytic flux. The steady-state concentration of lactate and pyruvate were slightly higher in MCT1 cells, but on the whole both isoforms behaved similarly when simulated at low extracellular lactate (Fig. 9B, left panel).
Figure 9.
MCT4 is capable of lactate release in high lactate microenvironments. A, alternating conformer model of MCTs. The transporter (T) binds a proton (H) before binding either lactate (L) or pyruvate (P). Only empty and fully-loaded transporters alternate between outward-facing (out) and inward-facing (in) conformations. B, simulation of highly glycolytic cells. Glycolytic flux was fixed at 10 μm/s (100%). Rate constants were 0.01 s−1 (mitochondrial pyruvate import), 0.5 s−1 (LDH forward), and 0.025 s−1 (LDH reverse). Transporter quantities were 40 μm (MCT4), 42 μm (MCT1), and 3.8 μm (MCT2). Dynamics were simulated as specified under “Experimental procedures.” Extracellular lactate was 1 mm (left panel, healthy tissue) or 3 mm (right panel, tumor microenvironment). Extracellular pyruvate was 0.1 mm for both conditions. Fluxes are given as percentage of the glycolytic flux. C, effect of increasing extracellular lactate on lactate flux through MCT1, MCT2, and MCT4, starting from the conditions in B, left panel (healthy tissue). D, effect of increasing transporter dosage on lactate flux through MCT1, MCT2, and MCT4 at 3 mm extracellular lactate (tumor microenvironment). E, effect of increasing extracellular lactate on lactate flux through MCT1, MCT2, and MCT4 in the absence of mitochondrial pyruvate influx.
At elevated ambient lactate, such as is observed within tumors and inflammatory sites, a marked functional divergence between MCT4 and MCT1 became evident (Fig. 9B, right panel). Here MCT1-bearing cells became pyruvate producers, whereas MCT4 cells maintained their lactate producing role and generated little pyruvate. The divergence was more marked at higher lactate levels and at higher transporter dosages (Fig. 9, C and D). With mitochondria unable to consume pyruvate, as would occur during in hypoxia, MCT1 cells reverted from lactate producers to consumers at 3.5 mm extracellular lactate, whereas MCT4 cells reverted at 13 mm lactate (Fig. 9E). MCT2-bearing cells showed a strong tendency toward lactate consumption (Fig. 9, D–F) consistent with the expression of this isoform in highly oxidative cells like neurons (44). For simplicity, the cellular NADH/NAD+ ratio in these simulations was fixed, that is, it was implicitly assumed that mitochondria compensate for deficits in NADH recycling at LDH. If this were the case, MCT4 cells will not only release more lactate than MCT1 cells, they wil use less oxygen. Lactate and pyruvate fluxes are not only determined by MCTs, but also by glycolytic and mitochondrial fluxes and the redox ratio. Thus, these simulations do not cover every possible condition, but serve to demonstrate that all things being equal, MCT4 is more suited for lactate export than MCT1 and MCT2 at high ambient lactate levels.
Discussion
Our main conclusion is that MCT4 is a high affinity lactate transporter and has a relevant affinity for pyruvate. A similar Km for lactate of around 1 mm was determined in three different cell types including endogenous and recombinant MCT4, which suggests that this is a general property of the isoform. High affinity for lactate and a somewhat lower affinity for pyruvate confer MCT4-expressing cells the ability to export lactate against high ambient lactate levels, a role that is not possible for either MCT1 or MCT2, which cannot help losing pyruvate. This ability helps to explain why MCT4 is preferentially expressed in metastatic tumors, rapidly proliferating cells, and hypoxic tissues.
How MCT4 has been considered to be a low affinity lactate transporter with negligible affinity for pyruvate? When BCECF was first used to monitor monocarboxylate transport in 1990, bicarbonate was purposely omitted from experimental solutions “to minimize intracellular buffering in order to produce greater and faster pHi changes when small amounts of lactate were introduced” (16). Shortly afterward, BCECF was used to estimate kinetic parameters, also in bicarbonate-free conditions (17). We confirm here that bicarbonate makes a big difference in the acidification induced by lactate. However, bicarbonate omission is not enough to eliminate the problem of buffering, because bicarbonate represents only 30–50% of the buffering power of mammalian cells, the remainder being shared by protonable amino acid residues, phospholipids, metabolites, etc. (34, 35). As well as buffering, mammalian cells possess efficient systems for the extrusion of protons, including carbonic anhydrase, Na+/H+ exchangers, and Na+/bicarbonate cotransporters, some of which are strategically located in the vicinity of MCTs (36). Of note, NBCe1 remains active even in the nominal absence of bicarbonate (45). A study in Xenopus laevis oocytes showed that the MCT4 activity is enhanced by membrane-anchored carbonic anhydrase. Significantly for affinity estimations, the effect of carbonic anhydrase was stronger at low lactate concentrations (46). Our interpretation of the bias introduced by pH measurements is that on the whole, the pH regulatory system is saturable. Challenged by low lactate loads, it copes well so that intracellular pH remains stable despite lactate influx. At higher lactate loads, the regulatory system is overwhelmed and cells acidify. In the presence of bicarbonate, pH regulation is even stronger, so that MCT-mediated pH changes are difficult to detect even at high lactate loads, and particularly in response to pyruvate, which is a less efficient substrate. The confounding effect of pH regulation leads to a biased estimation of affinity. Whereas proton buffering and muffling explain the high apparent Km values previously reported for MCT4 in mammalian cells, it is not clear to us why a study based on radiolabeled lactate also reported a high Km in MCT4-expressing oocytes (34 mm; see Ref. 13). In that study, lactate uptake was found to have two kinetic components. It is possible that the minor, high-affinity component (approximate Km 4 mm) was a subpopulation of MCT4. Considering these results in Xenopus and the higher affinity detected in the three mammalian systems tested, with both endogenous and exogenous MCT4, it seems possible that the affinity of MCT4 is intrinsically low and that increases in a mammalian cell environment, perhaps due to post-translational modification and/or interaction with other proteins.
The affinity measured here in HEK293-MCT4 cells suggest that over-expression may not account for the discrepancy, neither would genetic variability, because the splice variants of MCT4 do not include the protein coding region. Perhaps factors present in mammalian cells but not in Xenopus oocytes endow MCT4 with high affinity? Prime candidates are carbonic anhydrase and proton extrusion mechanisms, which when co-expressed in oocytes enhance the uptake of lactate (36, 46). Alternatively, the estimation of Km in millimeter-sized oocytes may have been affected by unstirred layers that are not present in micrometer-sized mammalian cells, as discussed previously (14). A nonexclusive possibility is metabolism. The radiolabeled assay involved incubation for 20 min, during which some lactate may have been metabolized, an effect that would be more evident at low lactate loads. X. laevis oocytes have a strong oxidative phosphorylation relative to glycolysis, producing CO2 from pyruvate 80–140 times faster than from glucose (47). They also have endogenous MCT and LDH (48, 49), and are therefore equipped to metabolize lactate. In the case of mammalian cells, oxidative phosphorylation is much slower than MCT-mediated transport, so it should not interfere significantly with the uptake assay. Still, a sizable metabolic interference in mammalian cells, a possibility that we do not favor, would mean that the affinity of MCT4 for its substrates is even higher than reported here. It has been proposed that MCT4 has a higher transport capacity than MCT1 (13). Calibrated lactate and pyruvate measurements accompanied by parallel measurement of MCT surface expression are needed to address the pending question of transport capacity.
MCT4 versus MCT1 and MCT2
The most widely expressed housekeeping member of the monocarboxylate transporter family is MCT1. It has an affinity for pyruvate 5–10 times higher than that for lactate, commensurate with the ratio between the physiological concentrations of the two substrates. MCT1 plays a major role in whole-body energy homeostasis and in the distribution of redox potential between organs (50). It is also widely expressed in tumors, where it mediates both the export and import of lactate (12, 51). Hypoxic cells may only use glycolysis to generate ATP, and to sustain glycolysis they need to recycle the NADH produced at glyceraldehyde-3-phosphate dehydrogenase. With oxidative phosphorylation disabled in the absence of oxygen, NADH may only be recycled at LDH, the enzyme that converts pyruvate into lactate. Thus, to generate energy, hypoxic cells need to release lactate but not pyruvate, a task that is fitting for MCT4, but not for MCT1. This helps to explain why only the expression of the MCT4 is under the control of HIF-1α (11). At variance with hypoxic cells, which require glycolytic ATP production for survival, cancer cells are capable of generating their ATP in mitochondria by oxidative phosphorylation (43). For reasons that are not fully understood, but which include the interstitial effects of lactate and protons (5), some cancer cells engage in a glycolytic frenzy to export almost every glycolytic carbon in the form of lactate (1–4). They do this against elevated ambient lactate levels caused by inflammation, hypoxia, and/or the Warburg effect in neighboring cancer and stroma cells (4–6, 9). According to our numerical simulations MCT1 cells may only produce lactate at low ambient lactate levels, because at high lactate levels they cannot avoid producing pyruvate. Consistently, pharmacological MCT1 inhibition in breast cancer cells was found to inhibit the release of pyruvate but not lactate (52). In contrast, MCT4 exports lactate regardless of extracellular lactate levels. As well as to contributing to the understanding of high-lactate microenvironments, the revised kinetic properties we report here may inform the development of urgently-needed specific MCT4 blockers.
Experimental procedures
Standard reagents and inhibitors were acquired from Sigma or Merck. Plasmids encoding the sensors Laconic (18) and Pyronic (19) are available from Addgene. Ad Laconic and Ad Pyronic (serotype 5) were custom made by Vector Biolabs.
Cell culture
MDA-MB-231 cells were acquired from the American Type Culture Collection (ATCC) and cultured at 37 °C without CO2 in Leibovitz medium (ThermoFisher). Cultures were transfected at 60% confluence using Lipofectamine 3000 (ThermoFisher) or alternatively, exposed overnight to 10∧8 pfu/ml of Ad Laconic or Ad Pyronic and studied after 24–72 h. The generation of the MDA-LAC cell line is described elsewhere (53). HEK293 cells were acquired from the ATCC and cultured at 37 °C in 95% air, 5% CO2 in Dulbecco's modified Eagle's medium/F-12 supplemented with 10% fetal bovine serum. Cultures were transfected at 60% confluence using Lipofectamine 3000 (ThermoFisher) and studied after 24–72 h. HEK-MCT4-LAC, a cell line stably expressing MCT4 and Laconic, was generated by infecting HEK293 cells with a bicistronic lentiviral vector coding for human SLC16A3 (Genscript, Piscataway, NJ) and Laconic. Cell pools were enriched by blasticidine selection. Slc16a3 was deleted from MDA-MB-231 and HEK-MCT4-LAC cells using CRISPR/Cas9 editing. Cells were transduced with MCT4-LentiCRISPR_V2, which encodes the guide 5′-cac cga aga aga cac tga cgg cct t-3′ (51) and selected using puromycin. To obtain macrophages, blood was collected by venepuncture from 10 healthy male volunteers. Age of donors ranged from 25 to 45 years. Ethical guidelines stipulated by the Declaration of Helsinki principles were adhered to. Approval was obtained from the Medical Ethical Committee of the Faculty of Medicine, Universidad Austral de Chile. All donors were informed about the nature of the studies and gave their written consent to participate. Samples were treated anonymously. Monocytes were isolated from whole blood treated with 3.8% sodium citrate, by PercollTM density gradient centrifugation (GE Healthcare). Macrophage differentiation of human monocytes was induced by treatment with 25 nm macrophage colony-stimulating factor for 7 days. Human monocyte-derived macrophages were treated with 100 ng/ml of IFN-γ and 10 ng/ml of lipopolysaccharide for M1 differentiation for 48 h. After isolation cells were maintained in RPMI media supplemented with 10% fetal bovine serum and 1% pyruvate. Cytokines were obtained from PeproTech (USA), LPS (from Pseudomonas aeruginosa) was from Sigma-Aldrich. For lactate measurements, macrophages maintained in culture for 6 to 7 days were incubated for 24 h with 7 × 10⁶ pfu Ad Laconic and imaged 6–7 days later.
Imaging
Cells were imaged at 35 °C in a 95% air, 5% CO2-gassed KRH-bicarbonate buffer of the following composition (in mm): 112 NaCl, 3 KCl, 1.25 CaCl2, 1.25 MgSO4, 10 HEPES, 24 NaHCO3, pH 7.4. Alternatively, NaHCO3 was equimolarly replaced with NaCl. Glucose, lactate, pyruvate, and inhibitors were added as indicated in the figure legends. Laconic and Pyronic were imaged using an upright Olympus FV1000 confocal microscope equipped with a ×20 water immersion objective (NA 1.0). Laconic and Pyronic were imaged at 440 nm excitation/480 ± 15 nm (mTFP) and 550 ± 15 (Venus) emissions. BCECF was ester-loaded at 0.1 μm for 3–4 min and the signal was calibrated by exposing the cultures to solutions of different pH values after permeabilizing the cells with 10 μg/ml of nigericin and 20 μg/ml of gramicidin in an intracellular buffer. BCECF was sequentially excited at 440 and 490 nm (0.05 s) and imaged at 535/30 nm using an Olympus BX51 microscope (×20 water immersion objective, NA 0.95) equipped with a CAIRN monochromator and Optosplit II (Faversham, UK) and a Hamamatsu Rollera camera.
Immunodetection
For immunoblotting cultured cells were scraped into cold phosphate-buffered saline (1×) followed by centrifugation at 5,000 rpm for 5 min at 4 °C. The cell pellet was then suspended in cold 1× RIPA (radioimmune precipitation assay) lysis buffer (50 mm Tris-HCl, pH 7.4, 150 mm NaCl, 0.1% SDS, 0.5% sodium deoxycholate, 1% Nonidet P-40, 10 mm N-ethylmaleimide, 0.1 mm phenylmethylsulfonyl fluoride, 1 μg/ml of aprotinin, 1 μg/ml of leupeptin, and 1 μg/ml of pepstatin A). After 30 min on ice, unlysed cells and nuclei were pelletted at 12,000 rpm for 15 min at 4 °C. The protein concentration of the supernatant was determined by a Bio-Rad Dc Protein Assay using bovine serum albumin standards. Protein samples (50 μg) were loaded onto 10% (w/v) SDS-polyacrylamide gels and electrotransferred onto nitrocelulose membranes. Antibodies used were rabbit anti-MCT4 (1:250; AB3314P, Merck Millipore), mouse anti-β-actin (1:2,000; 8H10D10, Cell Signaling), peroxidase-conjugated anti-rabbit (1:20,000; 111-035-144, Jackson) and peroxidase-conjugated anti-mouse (1:20,000; number 7076, Cell Signaling). Signals were revealed using a chemiluminescence kit (SuperSignalTM West Femto, ThermoFisher), following the instructions of the manufacturer. For immunocytochemistry macrophages fixed with 4% paraformaldehyde and permeabilized with 0.1% PBS-Triton X-100 were blocked with 3% bovine serum albumin plus 10% normal goat serum (Vector Laboratories). Samples were probed with a primary antibody against MCT4 (1:1000; AB3314P, Merck Millipore and Alexa Fluor 488 secondary antibody (1:2000; A11008, Invitrogen). Nuclei were stained with 4,6-diamidino-2-phenylindole (1:50,000; D3571, Invitrogen). Samples were embedded into fluorescence mounting medium (Dako) and analyzed by confocal microscopy (Leica DMi8, Leica Microsystems) using a ×63 oil objective. Image analysis was performed using Leica and ImageJ software.
Mathematical modeling
Cellular lactate and pyruvate dynamics were simulated using Berkeley Madonna software and the following set of ordinary differential equations,
| (Eq. 1) |
| (Eq. 2) |
| (Eq. 3) |
| (Eq. 4) |
| (Eq. 5) |
| (Eq. 6) |
| (Eq. 7) |
| (Eq. 8) |
| (Eq. 9) |
| (Eq. 10) |
Where Equations 1–8 represent the eight possible conformations of the MCT carrier: outward- and inward-facing, either empty (Tout and Tin), loaded with a proton (THout and THin), loaded with both proton and lactate (THLout and THLin), and loaded with both proton and pyruvate (THPout and THPin). Equations 9 and 10 represent cytosolic lactate and pyruvate. The association constant Kon for protons, lactate, and pyruvate was set at 108 m−1 s−1 for the three isoforms (diffusion-limited); respective dissociation constants KoffH, KoffL, and KoffP were 20 s−1, 7.6 × 10⁷ s−1, and 7.6 × 10⁶ s−1 for MCT1, 20 s−1, 7.6 × 10⁶ s−1, and 7.6 × 10⁵ s−1 for MCT2, and 20 s−1, 2.4 × 10⁷ s−1, and 6.4 × 10⁷ s−1 for MCT4. Carrier translocation rates f1 (empty) and f2 (loaded) were set at 200 and 3000 s−1. Rate constants were 0.01 s−1 (Mito, mitochondrial pyruvate import), 0.5 s−1 (LDHforward, pyruvate to lactate), and 0.025 s−1 (LDHreverse, lactate to pyruvate). With these parameters and cytosolic and extracellular pH values of 7.2 (63 nm) and 7.4 (40 nm), apparent zero-trans Km (Kzt) values for lactate and pyruvate uptake were: 5 and 0.5 mm for MCT1, 0.5 and 0.05 mm for MCT2, and 1.7 and 4.2 mm for MCT4.
Statistical analysis
Statistical analyses were carried out with SigmaPlot software (Jandel). Differences between two groups were assessed using the Mann-Whitney Rank Sum Test. Differences between three groups were assessed with the Kruskal-Wallis one-way analysis of variance on ranks followed by the Tukey's ad hoc test; *, p < 0.05; ns, nonsignificant; p > 0.05. The number of experiments and cells is detailed in each figure legend.
Author contributions
Y. C.-B., C. A. F., A. S. M., and L. F. B. conceptualization; Y. C.-B., R. A., A. Galaz, F. C.-M., F. B.-L., R. A.-M., A. Guequén, and C. A. F. data curation; Y. C.-B., R. A., A. Galaz, F. C.-M., F. B.-L., R. A.-M., A. Guequén, C. A. F., A. S. M., and L. F. B. formal analysis; Y. C.-B., R. A.-M., and L. F. B. visualization; Y. C.-B., P. Y. S., R. A., A. Galaz, F. C.-M., K. A., F. B.-L., R. A.-M., A. Guequén, C. A. F., A. S. M., and L. F. B. writing-review and editing; P. Y. S., K. A., F. B.-L., A. Guequén, A. S. M., and L. F. B. resources; P. Y. S., R. A., A. Galaz, F. C.-M., F. B.-L., R. A.-M., A. Guequén, A. S. M., and L. F. B. investigation; P. Y. S., R. A., A. Galaz, K. A., F. B.-L., R. A.-M., A. Guequén, A. S. M., and L. F. B. methodology; K. A., C. A. F., and A. S. M. project administration; F. B.-L., C. A. F., A. S. M., and L. F. B. supervision; A. S. M. and L. F. B. funding acquisition; L. F. B. writing-original draft.
Acknowledgments
We thank Karen Everett for critical reading of the manuscript and José Sarmiento (Universidad Austral de Chile) for help with confocal microscopy of MCT4 in human macrophages. We thank Drs. Brandon Faubert and Ralph J. DeBerardinis (Children's Medical Center Research Institute, University of Texas Southwestern Medical Center, Dallas, TX) for a generous gift of the MCT4-LentiCRISPR_V2 construct. The Centro de Estudios Científicos (CECs) is funded by the Chilean Government through the Centers of Excellence Basal Financing Program of CONICYT.
This work was supported by Fondecyt Grants 11150930 (to A. S. M.), 1160317 (to L. F. B.), and 11190584 (to P. Y. S.). The authors declare that they have no conflicts of interest with the contents of this article.
- HIF-1
- hypoxia-inducible transcription factor 1
- MCT4
- monocarboxylate transporter 4
- pCMBS
- p-chloromercuribenzenesulfonic acid
- BCECF
- 2′,7′-bis-(carboxyethyl)-5-(and -6)-carboxyfluorescein
- LDH
- lactate dehydrogenase.
References
- 1. Warburg O. (1925) The metabolism of carcinoma cells. J. Cancer Res. 9, 148–163 10.1158/jcr.1925.148 [DOI] [Google Scholar]
- 2. Racker E. (1972) Bioenergetics and the problem of tumor growth. Am. Sci. 60, 56–63 [PubMed] [Google Scholar]
- 3. Vander Heiden M. G., Cantley L. C., and Thompson C. B. (2009) Understanding the Warburg effect: the metabolic requirements of cell proliferation. Science 324, 1029–1033 10.1126/science.1160809 [DOI] [PMC free article] [PubMed] [Google Scholar]
- 4. San-Millán I., and Brooks G. A. (2017) Reexamining cancer metabolism: lactate production for carcinogenesis could be the purpose and explanation of the Warburg Effect. Carcinogenesis 38, 119–133 [DOI] [PMC free article] [PubMed] [Google Scholar]
- 5. Liberti M. V., and Locasale J. W. (2016) The Warburg EFfect: how does it benefit cancer cells? Trends Biochem. Sci. 41, 211–218 10.1016/j.tibs.2015.12.001 [DOI] [PMC free article] [PubMed] [Google Scholar]
- 6. Walenta S., Wetterling M., Lehrke M., Schwickert G., Sundfør K., Rofstad E. K., and Mueller-Klieser W. (2000) High lactate levels predict likelihood of metastases, tumor recurrence, and restricted patient survival in human cervical cancers. Cancer Res. 60, 916–921 [PubMed] [Google Scholar]
- 7. Brooks G. A. (2009) Cell-cell and intracellular lactate shuttles. J. Physiol. 587, 5591–5600 10.1113/jphysiol.2009.178350 [DOI] [PMC free article] [PubMed] [Google Scholar]
- 8. Weber B., and Barros L. F. (2015) The astrocyte: powerhouse and recycling center. Cold Spring Harb. Perspect. Biol. 7, a020396 [DOI] [PMC free article] [PubMed] [Google Scholar]
- 9. Rosafio K., and Pellerin L. (2014) Oxygen tension controls the expression of the monocarboxylate transporter MCT4 in cultured mouse cortical astrocytes via a hypoxia-inducible factor-1alpha-mediated transcriptional regulation. Glia 62, 477–490 10.1002/glia.22618 [DOI] [PubMed] [Google Scholar]
- 10. Halestrap A. P. (2013) Monocarboxylic acid transport. Compr. Physiol. 3, 1611–1643 [DOI] [PubMed] [Google Scholar]
- 11. Ullah M. S., Davies A. J., and Halestrap A. P. (2006) The plasma membrane lactate transporter MCT4, but not MCT1, is up-regulated by hypoxia through a HIF-1α-dependent mechanism. J. Biol. Chem. 281, 9030–9037 10.1074/jbc.M511397200 [DOI] [PubMed] [Google Scholar]
- 12. Park S. J., Smith C. P., Wilbur R. R., Cain C. P., Kallu S. R., Valasapalli S., Sahoo A., Guda M. R., Tsung A. J., and Velpula K. K. (2018) An overview of MCT1 and MCT4 in GBM: small molecule transporters with large implications. Am. J. Cancer Res. 8, 1967–1976 [PMC free article] [PubMed] [Google Scholar]
- 13. Dimmer K. S., Friedrich B., Lang F., Deitmer J. W., and Broer S. (2000) The low-affinity monocarboxylate transporter MCT4 is adapted to the export of lactate in highly glycolytic cells. Biochem. J. 350, 219–227 [PMC free article] [PubMed] [Google Scholar]
- 14. Manning Fox J. E., Meredith D., and Halestrap A. P. (2000) Characterisation of human monocarboxylate transporter 4 substantiates its role in lactic acid efflux from skeletal muscle. J. Physiol. 529, 285–293 [DOI] [PMC free article] [PubMed] [Google Scholar]
- 15. Barros L. F. (2013) Metabolic signaling by lactate in the brain. Trends Neurosci. 36, 396–404 10.1016/j.tins.2013.04.002 [DOI] [PubMed] [Google Scholar]
- 16. Bonanno J. A. (1990) Lactate-proton cotransport in rabbit corneal epithelium. Curr. Eye Res. 9, 707–712 10.3109/02713689008999587 [DOI] [PubMed] [Google Scholar]
- 17. Carpenter L., and Halestrap A. P. (1994) The kinetics, substrate and inhibitor specificity of the lactate transporter of Ehrlich-Lettre tumour cells studied with the intracellular pH indicator BCECF. Biochem. J. 304, 751–760 [DOI] [PMC free article] [PubMed] [Google Scholar]
- 18. San Martín A., Ceballo S., Ruminot I., Lerchundi R., Frommer W. B., and Barros L. F. (2013) A genetically encoded FRET lactate sensor and its use to detect the Warburg effect in single cancer cells. PLoS ONE 8, e57712 10.1371/journal.pone.0057712 [DOI] [PMC free article] [PubMed] [Google Scholar]
- 19. San Martín A., Ceballo S., Baeza-Lehnert F., Lerchundi R., Valdebenito R., Contreras-Baeza Y., Alegría K., and Barros L. F. (2014) Imaging mitochondrial flux in single cells with a FRET sensor for pyruvate. PLoS ONE 9, e85780 10.1371/journal.pone.0085780 [DOI] [PMC free article] [PubMed] [Google Scholar]
- 20. Peetz J., Barros L. F., San Martín A., and Becker H. M. (2015) Functional interaction between bicarbonate transporters and carbonic anhydrase modulates lactate uptake into mouse cardiomyocytes. Pflugers Arch. 467, 1469–1480 [DOI] [PubMed] [Google Scholar]
- 21. Sotelo-Hitschfeld T., Niemeyer M. I., Mächler P., Ruminot I., Lerchundi R., Wyss M. T., Stobart J., Fernández-Moncada I., Valdebenito R., Garrido-Gerter P., Contreras-Baeza Y., Schneider B. L., Aebischer P., Lengacher S., San Martín A., et al. (2015) Channel-mediated lactate release by k+-stimulated astrocytes. J. Neurosci. 35, 4168–4178 10.1523/JNEUROSCI.5036-14.2015 [DOI] [PMC free article] [PubMed] [Google Scholar]
- 22. Mächler P., Wyss M. T., Elsayed M., Stobart J., Gutierrez R., von Faber-Castell A., Kaelin V., Zuend M., San Martín A., Romero-Gómez I., Baeza-Lehnert F., Lengacher S., Schneider B. L., Aebischer P., Magistretti P. J., et al. (2016) In Vivo Evidence for a Lactate Gradient from Astrocytes to Neurons. Cell Metab. 23, 94–102 10.1016/j.cmet.2015.10.010 [DOI] [PubMed] [Google Scholar]
- 23. Plaçais P. Y., de Tredern É., Scheunemann L., Trannoy S., Goguel V., Han K. A., Isabel G., and Preat T. (2017) Upregulated energy metabolism in the Drosophila mushroom body is the trigger for long-term memory. Nat. Commun. 8, 15510 10.1038/ncomms15510 [DOI] [PMC free article] [PubMed] [Google Scholar]
- 24. Rusu V., Hoch E., Mercader J. M., Tenen D. E., Gymrek M., Hartigan C. R., DeRan M., von Grotthuss M., Fontanillas P., Spooner A., Guzman G., Deik A. A., Pierce K. A., Dennis C., Clish C. B., Carr S. A., et al. (2017) Type 2 diabetes variants disrupt function of SLC16A11 through two distinct mechanisms. Cell 170, 199–212 10.1016/j.cell.2017.06.011 [DOI] [PMC free article] [PubMed] [Google Scholar]
- 25. Delgado M. G., Oliva C., López E., Ibacache A., Galaz A., Delgado R., Barros L. F., and Sierralta J. (2018) Chaski, a novel Drosophila lactate/pyruvate transporter required in glia cells for survival under nutritional stress. Sci. Rep. 8, 1186 10.1038/s41598-018-19595-5 [DOI] [PMC free article] [PubMed] [Google Scholar]
- 26. Tobar N., Porras O., Smith P. C., Barros L. F., and Martínez J. (2017) Modulation of mammary stromal cell lactate dynamics by ambient glucose and epithelial factors. J. Cell Physiol. 232, 136–144 10.1002/jcp.25398 [DOI] [PubMed] [Google Scholar]
- 27. Baeza-Lehnert F., Saab A. S., Gutiérrez R., Larenas V., Díaz E., Horn M., Vargas M., Hösli L., Stobart J., Hirrlinger J., Weber B., and Barros L. F. (2019) Non-canonical control of neuronal energy status by the Na+ pump. Cell Metab. 29, 668–680.e4 [DOI] [PubMed] [Google Scholar]
- 28. Gallagher S. M., Castorino J. J., Wang D., and Philp N. J. (2007) Monocarboxylate transporter 4 regulates maturation and trafficking of CD147 to the plasma membrane in the metastatic breast cancer cell line MDA-MB-231. Cancer Res. 67, 4182–4189 10.1158/0008-5472.CAN-06-3184 [DOI] [PubMed] [Google Scholar]
- 29. Hussien R., and Brooks G. A. (2011) Mitochondrial and plasma membrane lactate transporter and lactate dehydrogenase isoform expression in breast cancer cell lines. Physiol. Genomics 43, 255–264 10.1152/physiolgenomics.00177.2010 [DOI] [PMC free article] [PubMed] [Google Scholar]
- 30. Wilson M. C., Meredith D., Fox J. E., Manoharan C., Davies A. J., and Halestrap A. P. (2005) Basigin (CD147) is the target for organomercurial inhibition of monocarboxylate transporter isoforms 1 and 4: the ancillary protein for the insensitive MCT2 is EMBIGIN (gp70). J. Biol. Chem. 280, 27213–27221 10.1074/jbc.M411950200 [DOI] [PubMed] [Google Scholar]
- 31. Ovens M. J., Davies A. J., Wilson M. C., Murray C. M., and Halestrap A. P. (2010) AR-C155858 is a potent inhibitor of monocarboxylate transporters MCT1 and MCT2 that binds to an intracellular site involving transmembrane helices 7–10. Biochem. J. 425, 523–530 10.1042/BJ20091515 [DOI] [PMC free article] [PubMed] [Google Scholar]
- 32. Sasaki S., Futagi Y., Ideno M., Kobayashi M., Narumi K., Furugen A., and Iseki K. (2016) Effect of diclofenac on SLC16A3/MCT4 by the Caco-2 cell line. Drug Metab. Pharmacokinet. 31, 218–223 10.1016/j.dmpk.2016.03.004 [DOI] [PubMed] [Google Scholar]
- 33. Polański R., Hodgkinson C. L., Fusi A., Nonaka D., Priest L., Kelly P., Trapani F., Bishop P. W., White A., Critchlow S. E., Smith P. D., Blackhall F., Dive C., and Morrow C. J. (2014) Activity of the monocarboxylate transporter 1 inhibitor AZD3965 in small cell lung cancer. Clin. Cancer Res. 20, 926–937 10.1158/1078-0432.CCR-13-2270 [DOI] [PMC free article] [PubMed] [Google Scholar]
- 34. Deitmer J. W., and Rose C. R. (1996) pH regulation and proton signalling by glial cells. Prog. Neurobiol. 48, 73–103 10.1016/0301-0082(95)00039-9 [DOI] [PubMed] [Google Scholar]
- 35. Chesler M. (2003) Regulation and modulation of pH in the brain. Physiol. Rev. 83, 1183–1221 10.1152/physrev.00010.2003 [DOI] [PubMed] [Google Scholar]
- 36. Deitmer J. W., and Becker H. M. (2013) Transport metabolons with carbonic anhydrases. Front. Physiol. 4, 291 [DOI] [PMC free article] [PubMed] [Google Scholar]
- 37. Cheng S. C., Quintin J., Cramer R. A., Shepardson K. M., Saeed S., Kumar V., Giamarellos-Bourboulis E. J., Martens J. H., Rao N. A., Aghajanirefah A., Manjeri G. R., Li Y., Ifrim D. C., Arts R. J., van der Veer B. M., et al. (2014) mTOR- and HIF-1α–mediated aerobic glycolysis as metabolic basis for trained immunity. Science 345, 1250684 10.1126/science.1250684 [DOI] [PMC free article] [PubMed] [Google Scholar]
- 38. Russell D. G., Huang L., and VanderVen B. C. (2019) Immunometabolism at the interface between macrophages and pathogens. Nat. Rev. Immunol. 19, 291–304 10.1038/s41577-019-0124-9 [DOI] [PMC free article] [PubMed] [Google Scholar]
- 39. Bittner C. X., Loaiza A., Ruminot I., Larenas V., Sotelo-Hitschfeld T., Gutiérrez R., Córdova A., Valdebenito R., Frommer W. B., and Barros L. F. (2010) High resolution measurement of the glycolytic rate. Front. Neuroenergetics 2, 26 [DOI] [PMC free article] [PubMed] [Google Scholar]
- 40. Moreau A., Le Vee M., Jouan E., Parmentier Y., and Fardel O. (2011) Drug transporter expression in human macrophages. Fundam. Clin. Pharmacol. 25, 743–752 10.1111/j.1472-8206.2010.00913.x [DOI] [PubMed] [Google Scholar]
- 41. Tan Z., Xie N., Banerjee S., Cui H., Fu M., Thannickal V. J., and Liu G. (2015) The monocarboxylate transporter 4 is required for glycolytic reprogramming and inflammatory response in macrophages. J. Biol. Chem. 290, 46–55 10.1074/jbc.M114.603589 [DOI] [PMC free article] [PubMed] [Google Scholar]
- 42. Widdas W. F. (1954) Facilitated transfer of hexoses across the human erythrocyte membrane. J. Physiol 125, 163–180 10.1113/jphysiol.1954.sp005148 [DOI] [PMC free article] [PubMed] [Google Scholar]
- 43. Zheng J. (2012) Energy metabolism of cancer: glycolysis versus oxidative phosphorylation (review). Oncol. Lett. 4, 1151–1157 10.3892/ol.2012.928 [DOI] [PMC free article] [PubMed] [Google Scholar]
- 44. Barros L. F., and Deitmer J. W. (2010) Glucose and lactate supply to the synapse. Brain Res. Rev. 63, 149–159 10.1016/j.brainresrev.2009.10.002 [DOI] [PubMed] [Google Scholar]
- 45. Theparambil S. M., Ruminot I., Schneider H. P., Shull G. E., and Deitmer J. W. (2014) The electrogenic sodium bicarbonate cotransporter NBCe1 is a high-affinity bicarbonate carrier in cortical astrocytes. J. Neurosci. 34, 1148–1157 10.1523/JNEUROSCI.2377-13.2014 [DOI] [PMC free article] [PubMed] [Google Scholar]
- 46. Becker H. M., Klier M., and Deitmer J. W. (2010) Nonenzymatic augmentation of lactate transport via monocarboxylate transporter isoform 4 by carbonic anhydrase II. J. Membr. Biol. 234, 125–135 10.1007/s00232-010-9240-y [DOI] [PubMed] [Google Scholar]
- 47. Eppig J. J., and Steckman M. L. (1976) Comparison of exogenous energy sources for in vitro maintenance of follicle cell-free Xenopus laevis oocytes. In Vitro 12, 173–179 10.1007/BF02796439 [DOI] [PubMed] [Google Scholar]
- 48. Tosco M., Orsenigo M. N., Gastaldi G., and Faelli A. (2000) An endogenous monocarboxylate transport in Xenopus laevis oocytes. Am. J. Physiol. Regul. Integr. Comp. Physiol. 278, R1190–R1195 10.1152/ajpregu.2000.278.5.R1190 [DOI] [PubMed] [Google Scholar]
- 49. Claycomb W. C., and Villee C. A. (1971) Lactate dehydrogenase isozymes of Xenopus laevis: factors affecting their appearance during early development. Dev. Biol. 24, 413–427 10.1016/0012-1606(71)90089-3 [DOI] [PubMed] [Google Scholar]
- 50. Hui S., Ghergurovich J. M., Morscher R. J., Jang C., Teng X., Lu W., Esparza L. A., Reya T., Le Zhan, Yanxiang Guo J., White E., and Rabinowitz J. D. (2017) Glucose feeds the TCA cycle via circulating lactate. Nature 551, 115–118 10.1038/nature24057 [DOI] [PMC free article] [PubMed] [Google Scholar]
- 51. Faubert B., Li K. Y., Cai L., Hensley C. T., Kim J., Zacharias L. G., Yang C., Do Q. N., Doucette S., Burguete D., Li H., Huet G., Yuan Q., Wigal T., Butt Y., et al. (2017) Lactate metabolism in human lung tumors. Cell 171, 358–371.e9 10.1016/j.cell.2017.09.019 [DOI] [PMC free article] [PubMed] [Google Scholar]
- 52. Hong C. S., Graham N. A., Gu W., Espindola Camacho C., Mah V., Maresh E. L., Alavi M., Bagryanova L., Krotee P. A. L., Gardner B. K., Behbahan I. S., Horvath S., Chia D., Mellinghoff I. K., Hurvitz S. A., et al. (2016) MCT1 modulates cancer cell pyruvate export and growth of tumors that co-express MCT1 and MCT4. Cell Rep. 14, 1590–1601 10.1016/j.celrep.2016.01.057 [DOI] [PMC free article] [PubMed] [Google Scholar]
- 53. Contreras-Baeza Y., Ceballo S., Arce-Molina R., Sandoval P. Y., Alegría K., Barros L. F., and San Martín A. (2019) MitoToxy assay: a novel cell-based method for the assessment of metabolic toxicity in a multiwell plate format using a lactate FRET nanosensor, Laconic. PLoS One 14, e0224527 10.1371/journal.pone.0224527 [DOI] [PMC free article] [PubMed] [Google Scholar]


