Correction to: BMC Genomics
https://doi.org/10.1186/s12864-019-6105-3
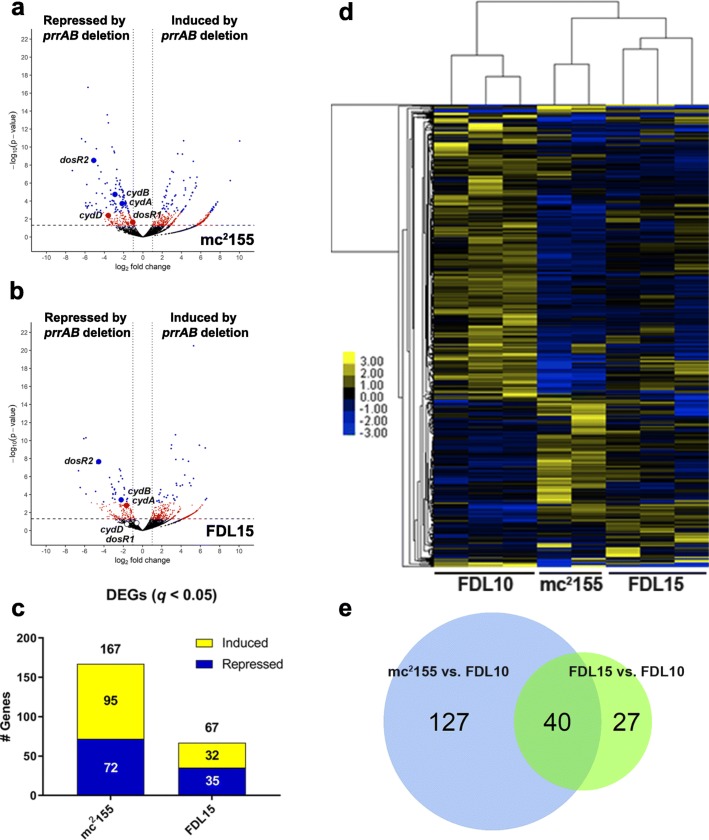
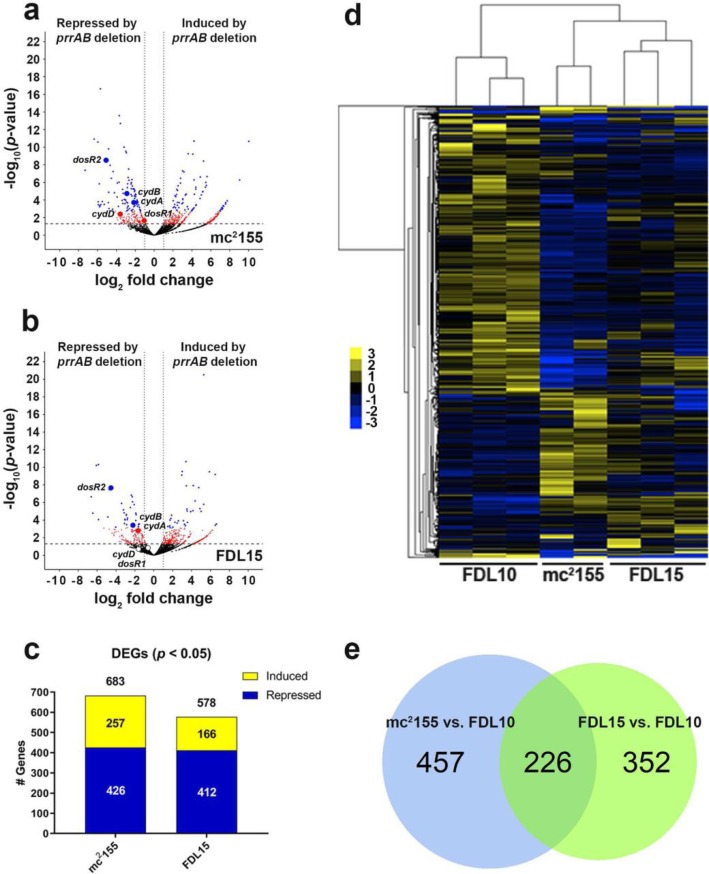
Following the publication of the original article [1], the authors reported an error in Fig. 1 of the PDF version of their article. Due to a typesetting mistake, a previous version of the figure was placed in the PDF, which therefore did not match the correct Fig. 2 given in the HTML version.
Fig. 2.
Global DEG profiles (q < 0.05) between the mc2 155 vs. FDL10 and FDL15 vs. FDL10 RNA-seq comparisons. Volcano plots of (a) FDL10 vs. mc2 155 and (b) FDL10 vs. FDL15 group comparisons with red and blue dots representing differentially-expressed genes with p < 0.05 and q < 0.05, respectively. The horizontal hatched line indicates p = 0.05 threshold, while the left and right vertical dotted lines indicate log2 fold change of − 1 and + 1, respectively. c Repressed (blue) and induced (yellow) DEGs (q < 0.05) in mc2 155 (WT) and FDL15 (prrAB complementation strain) compared to the FDL10 ΔprrAB mutant. d Average hierarchical clustering (FPKM + 1) of individual RNA-seq sample replicates. e Venn diagrams indicating 40 overlapping DEGs (q < 0.05) between mc2 155 vs. FDL10 (WT vs. ΔprrAB mutant) and FDL15 vs. FDL10 (prrAB complementation strain vs. ΔprrAB mutant) strain comparisons
The incorrect figure was:
The correct figure is:
The original article has been corrected.
Reference
- 1.Maarsingh, et al. Comparative transcriptomics reveals PrrABmediated control of metabolic, respiration, energy-generating, and dormancy pathways in Mycobacterium smegmatis. BMC Genomics. 2019;20:942. doi: 10.1186/s12864-019-6105-3. [DOI] [PMC free article] [PubMed] [Google Scholar]


