

Abstract
Objective:
We evaluated how attention deficit-hyperactivity disorder (ADHD) and learning disability (LD) are associated with concussion history and performance on standard concussion assessment measures. Based on previous reports that developmental disorders are associated with increased injury proneness and poorer cognitive performance, we anticipated that ADHD and LD would be associated with increased history of concussion and poorer baseline performance on assessment measures.
Design:
Cross-sectional study.
Setting:
Clinical research center.
Participants:
The study sample aggregated data from two separate projects: the National Collegiate Athletic Association Concussion Study and Project Sideline.
Interventions:
We analyzed preseason baseline data from 8056 high school and collegiate athletes (predominantly male football players) enrolled in prior studies of sport-related concussion.
Main Outcome Measures:
Measures included demographic/health history, symptoms, and cognitive performance.
Results:
Attention deficit-hyperactivity disorder and LD were associated with 2.93 and 2.08 times the prevalence, respectively, of 3+ historical concussions (for comorbid ADHD/LD the prevalence ratio was 3.38). In players without histories of concussion, individuals with ADHD reported more baseline symptoms, and ADHD and LD were associated with poorer performance on baseline cognitive tests. Interactive effects were present between ADHD/LD status and concussion history for self-reported symptoms.
Conclusions:
Neurodevelopmental disorders and concussion history should be jointly considered in evaluating concussed players.
Clinical Relevance:
Clinical judgments of self-reported symptoms and cognitive performance should be adjusted based on athletes’ individual preinjury baselines or comparison with appropriate normative samples.
Keywords: attention deficit, learning disability, concussion, standardized assessment of concussion
INTRODUCTION
Over the past 2 decades, increased appreciation for the prevalence and acute effects of concussions have led to dramatic increases in research, public interest, and media coverage about the short-term and possible long-term effects of concussions. Sport-related concussion has dominated discussions, perhaps because of the opportunity to garner data on large samples of concussed athletes and due to the risk some face for repeated exposure to mild head trauma. Concussion is common in contact sports across age groups,1–3 with emergency department visits for sport-related concussions doubling from 1997 to 2007 in 8-to 13-year-old children and tripling in 14 to 19 year olds.4 Fortunately, greater concern has been met with an increase in scientifically informed guidelines regarding how to identify and monitor concussed athletes. Broadly, these guidelines call for implementing standardized measures of subjective symptoms as well as cognitive and other acute deficits that commonly occur after concussion.5
Despite significant advances in concussion assessment, practitioners face challenges applying standard measures and guidelines to individual cases, particularly when individual circumstances complicate the application of normative procedures to an athlete’s assessment and treatment plan. One assumption of consensus guidelines on concussion management is that a history of developmental disorders (eg, attention deficit-hyperactivity disorder [ADHD] and learning disability [LD]) confounds assessment,5,6 perhaps because normative data regarding performance on concussion measures may not apply to such populations, or because such athletes may have unique risk profiles regarding their propensity for and response to injury. However, few studies have accumulated samples of special populations large enough to answer questions about how potential risk factors associated with neurodevelopmental disorders truly influence the prevalence of and response to concussion. By aggregating 2 prior large-scale studies, we were able to evaluate how ADHD and LD are associated with concussion history and compile baseline data on standard concussion measures for reference by practitioners involved in the assessment of concussed athletes with developmental disorders.
There is some indication that ADHD and LD could confer increased risk for concussion in athletes. For example, children with ADHD are at increased risk for numerous types of injuries and accidents (including concussions).7–9 Lower intellectual ability and achievement are also associated with increased head and non-head injuries in children,10 implying that injury proneness and achievement or intellectual deficits may share a common etiology. However, the literature on this topic is fraught with methodological weaknesses11 and contradictory findings (eg, in 1 sample, ADHD was associated with increased pedestrian injuries but fewer sports injuries),8 and some authors have suggested that other factors, such as antisocial behavior (highly comorbid with ADHD) and family psychosocial variables, are better predictors of injury proneness than is hyperactivity or ADHD.11,12
If children with developmental disorders are at increased risk for concussions, it is all the more important to have assessment tools that are validated for these populations. Assessment of concussion in children with ADHD and LD is difficult partly because many clinical markers of concussion overlap with the common sequelae of these disorders. Furthermore, little work has been published documenting how such populations respond to standard assessment tools. There is some evidence that LD and a history of multiple concussions are both associated with poorer baseline performance on neuropsychological tests and that athletes with both LD and histories of concussion perform particularly poorly on some neurocognitive tests.13 However, in this sample, the apparent association between LD and concussion history was nonsignificant (rates of LD were nearly double in those with a history of multiple vs no concussions, but cell sample sizes were small relative to this study), and rates of and associations with ADHD were not reported. A recent study reported that athletes with ADHD and/or LD report more symptoms and perform more poorly at baseline on the computerized cognitive test, ImPACT,14 although group differences (ADHD, LD, Comorbid ADHD/LD, Control) in concussion history were not significant.
This study begins to answer key questions about the relationship between 2 highly comorbid developmental disorders,15,16 ADHD and LD, and issues relevant to evaluating athletes after concussion. Our first aim was to extend the aforementioned literature on ADHD, intellectual disability, and injury proneness to determine the extent to which ADHD and LD are associated with histories of multiple concussions in athletes. A secondary aim was to demonstrate how ADHD and LD influence performance on standard concussion assessment measures (symptom ratings and neuropsychological tests). We hypothesized that ADHD and LD would be associated with increased concussion history as well as increased symptoms and poorer cognitive performance at baseline. We also explored the extent to which developmental disorders and concussion histories interact in predicting symptoms and cognitive performance.
MATERIALS AND METHODS
Participants
The study sample aggregated data from 2 separate projects: the National Collegiate Athletic Association (NCAA) Concussion Study and Project Sideline. The NCAA study enrolled 4238 male football players from 15 US colleges during the 1999, 2000, and 2001 seasons. Project Sideline began in 2000 and baseline tested 3961 high school athletes (97% male) in southeastern Wisconsin. The studies were approved by the institutional review boards of their parent institutions (University of North Carolina and Waukesha Memorial Hospital). Sports included football, hockey, and boys’ and girls’ soccer. Portions of data from these studies have been reported elsewhere.17–20
In both studies, athletes were baseline tested and followed prospectively after concussions. For the present purposes, only baseline data for participants who reported their ADHD and LD histories were analyzed, yielding 8056 available cases (with ns for select measures being lower due to missing data). This sample had a mean age of 18.00 years (SD = 2.07), was 96.0% male, was predominantly white (73.5%) and African American (21.5%), and was distributed as follows by sport: 93.4% football, 5.3% soccer, and 1.3% hockey. The sample contained 7504 (93.1%) participants without self-reported ADHD or LD, 242 (3.0%) with ADHD only, 233 (2.9%) with LD only, and 77 (1.0%) with both ADHD and LD.
Measures
History Form
Participants completed preseason baseline evaluations to gather relevant history information (via one-on-one interview) and assess performance on standard concussion assessment measures. Questions targeted various demographic, academic, and medical/psychiatric history. Concussion was described to athletes as a blow to the head causing an alteration in mental status and 1 or more of the following symptoms (prescribed by the American Academy of Neurology Guideline for Management of Sports Concussion): headache, nausea, vomiting, dizziness/balance problems, fatigue, difficulty sleeping, drowsiness, sensitivity to light or noise, blurred vision, memory difficulty, and difficulty concentrating.21,22
Graded Symptom Checklist
The graded symptom checklist (GSC) was a self-report questionnaire of symptoms rated on a 7-point Likert-type scale (from 0/absent to 6/severe). Although different versions of the questionnaire were used in the 2 study samples,19 there was a high degree of overlap among the items, with participants in this combined data set rating 16 common items (summed to create the total symptom score referenced in the results): headache, nausea, vomiting, balance problems/dizziness, fatigue, trouble sleeping, sleeping more than usual, drowsiness, sadness, numbness/tingling, feeling like “in a fog,” difficulty concentrating, difficulty remembering, sensitivity to light, feeling slowed down, and nervousness. Ratings on the full and 16-item scale correlate r = 0.98, P < 0.001.
Standardized Assessment of Concussion
The SAC23 is a brief sideline evaluation of cognitive status containing 4 components: orientation, immediate memory, concentration, and delayed recall. Scores range from 0 to 30 with lower scores indicating more severe cognitive impairment. Prior work has demonstrated the reliability and validity of the SAC for detecting the acute cognitive effects of concussion and for monitoring recovery.24,25
Neuropsychological Measures
A number of paper-and-pencil neuropsychological measures were included due to their sensitivity to concussion.13 These were administered by the research team or certified athletic trainers who were trained in the administration and scoring of these tests. These included the Hopkins Verbal Learning Test—Revised,26 Trail Making Test Part B,27 Symbol-Digit Modalities,28 the Stroop Color-Word interference test,29 and the Controlled Oral Word Association Test (FAS).30 With the exception of the Trail Making Test (where lower time to complete the task is associated with better performance), lower scores on the tests indicate more severe impairment.
Statistical Analysis
Risk ratios were computed at each level of concussion history (0, 1, 2, or 3+) to illustrate the prevalence ratios of suffering repeat concussions given a diagnosis of ADHD or LD. Analyses of baseline symptom and neuropsychological performance differences between groups were evaluated using 2-way analyses of variance (ANOVAs) with ADHD and LD entered as the independent variables. Interactions between ADHD and LD were initially entered in these ANOVA models, but because no interactions were present for the SAC and neuropsychological measures, the interaction terms were trimmed, and we reported findings only on the main effects for these measures.
Because of an interaction between ADHD and LD for symptom scores, follow-up comparisons are reported for this variable. As these follow-up tests led to secondary (exploratory) analyses of differences between subgroups (ADHD only vs none) on endorsement of specific post-concussive symptoms, we performed adjustment for multiple comparisons for these analyses (Table 2) using the false discovery rate method.31 Analyses of symptom and neuropsychological measures excluded individuals with prior histories of concussion to isolate effects of ADHD and LD. This was done to avoid any potential confound between concussion history and symptom reporting or neuropsychological test performance, although the literature on the topic remains somewhat unclear regarding the existence of any such associations (particularly for neuropsychological test data). However, after presentation of these results, exploratory analyses of the interaction between ADHD/LD and concussion history are presented on the variables (GSC, SAC) for which we had adequate sample sizes.
TABLE 2.
Item-Level Baseline Symptom Endorsement by ADHD Status
| ADHD Only (%), n = 162 | All Others (%), n = 5778 | P | |
|---|---|---|---|
| Difficulty concentrating | 34 | 10 | <0.001 |
| Fatigue | 31 | 22 | 0.007 |
| Trouble sleeping | 25 | 13 | <0.001 |
| Headache | 26 | 22 | 0.193 |
| Drowsiness | 25 | 20 | 0.173 |
| Difficulty remembering | 21 | 8 | <0.001 |
| Sleeping more | 16 | 11 | 0.064 |
| Nervous | 15 | 11 | 0.166 |
| Balance problems | 14 | 7 | 0.004 |
| Nausea | 10 | 8 | 0.334 |
| Feeling slowed down | 11 | 8 | 0.165 |
| Sensitive to light | 9 | 5 | 0.076 |
| Sadness | 9 | 5 | 0.061 |
| Numbness/tingling | 6 | 4 | 0.231 |
| Feeling like “in a fog” | 6 | 3 | 0.034 |
| Vomiting | 3 | 2 | 0.578 |
Represents a subset of the sample with no concussion history. Since participants with ADHD only reported elevated symptoms as compared with all other groups, comparisons are presented for ADHD-only versus all other participants. Items were considered to be endorsed if they were rated 1 to 6 (on a 0–6 scale). Degrees of freedom adjusted where Levene test showed unequal variance between groups. Original P values are presented but are bolded only where they remained significant after adjusting for multiple comparisons using the false discovery rate method (all significant effects except for the item “feeling like in a ‘fog’” remained significant).
RESULTS
Preliminary Analyses
Exploratory analyses of demographic differences between groups revealed that those with versus without ADHD were slightly younger, ADHD+ mean age (SD) = 17.38 (1.92) versus ADHD− 18.03 (2.07) years, t(7983) = −5.43, P < 0.001, but age was unrelated to LD status, t(7983) = 1.56, P = 0.119. However, years of play in the primary study sport was unrelated to ADHD status (±), t (4035) = 1.02, P = 0.309, or LD status (±), t(4035) = −0.97, P = 0.330. These findings rule out the possibility that any increased concussion history in athletes with ADHD or LD could be due to these participants having had more time to sustain concussions and/or receive an ADHD/LD diagnosis. Although the proportion of males was slightly higher for participants with versus without ADHD, 98.1% versus 95.9%, χ2(1) = −3.98, P = 0.046, as well as those with versus without LD, 99.0% versus 95.8%, χ2(1) = −7.83, P = 0.005, very small samples of females in the clinical groups (ns = 1–5) did not permit separate analysis of effects by gender. However, it is worth noting that the magnitude and pattern of significant effects is unchanged when considering only the male subjects.
Prior Concussions by Attention Deficit-Hyperactivity Disorder/Learning Disability Status
Risk ratios were first computed comparing all subjects with versus without ADHD (regardless of LD status), and contrastly, all subjects with versus without LD (regardless of ADHD status). Overall, there was a significant relationship between number of prior concussions and the presence of both ADHD, χ2(3) = 39.34, P < 0.001, φ = 0.070, and LD, χ2(3) = 15.11, P = 0.002, φ = 0.043. ADHD and LD were each associated with a stepwise increase in prevalence of multiple concussions (with prevalence for 3+ vs 0 concussions being 2.93 for ADHD and 2.08 for LD; Table 1). A second set of risk ratios were computed on ADHD-only (vs no ADHD/LD, or None), LD-only (vs None), and ADHD + LD (vs None) groups, which produced smaller cells sizes but arguably more distinct groups. These secondary analyses revealed a prevalence ratio for 3 or more (vs 0) concussions of 2.88 (95% CI = 1.91–4.35) for the ADHD-only (vs none) group, 1.81 (95% CI = 1.06–3.10) for LD-only (vs none), and 3.38 (95% CI = 1.76–6.51) for ADHD+LD combined (vs none).
TABLE 1.
Prevalence Ratio for Prior Concussions by ADHD and LD Status
| Concussions | n | ADHD (% of Sample) | Prevalence Ratio (vs 0) | 95% CI | LD (% of Sample) | Prevalence Ratio (vs 0) | 95% CI |
|---|---|---|---|---|---|---|---|
| 0 | 5940 | 3.6 | — | — | 3.5 | — | — |
| 1 | 1426 | 3.8 | 1.05 | 0.83–1.34 | 4.0 | 1.11 | 0.88–1.41 |
| 2 | 406 | 5.9 | 1.63 | 1.10–2.42 | 5.7 | 1.58 | 1.06–2.36 |
| 3+ | 284 | 10.6 | 2.93 | 2.05–4.19 | 7.4 | 2.08 | 1.36–3.18 |
Relationships Between Attention Deficit-Hyperactivity Disorder/Learning Disability and Baseline Symptom Reporting and Neurocognitive Test Performance
Self-Reported Symptoms
An interaction between ADHD and LD on symptom scores, F(1,5921) = 11.60, P = 0.001, seemed to be explained by an elevation in symptom ratings for the ADHD-only (ie, ADHD without comorbid LD) group relative to all other groups: for example, this group (mean = 5.76, SD = 8.26) had a significantly higher GSC score than normal controls (no ADHD or LD, labeled “None” in Table 1, mean = 3.05, SD = 5.97), t(165.939) = −4.15, P < 0.001, d = 0.32 (similarly, other pairwise tests for ADHD-only vs other groups were significant with ps < 0.01), whereas no pairwise tests between none, LD-only, and ADHD + LD groups reached statistical significance (all ps > 0.200). Follow-up analyses were performed on self-reported symptoms to identify whether particular symptoms were endorsed more highly than others by participants with ADHD-only versus all other subjects (Table 2). Intuitively, difficulty concentrating was the most highly endorsed symptom in participants with ADHD-only and was endorsed more frequently than other subjects (34% vs 10%, P < 0.001). Other symptoms that were endorsed more for participants with ADHD only were fatigue (31% vs 22%, P = 0.007), trouble sleeping (25% vs 13%, P < 0.001), difficulty remembering (21% vs 8%, P < 0.001), balance problems (14% vs 7%, P = 0.003), and feeling like in a “fog” (6% vs 3%, P = 0.034). [Since participants with ADHD were nominally but significantly younger than controls (mean age 17.38 vs 18.03, respectively) supplementary analyses were undertaken to ensure that neuropsychological deficits and enhanced symptom reporting associated with ADHD were not due to age differences between groups. Specifically, effects of ADHD on neuropsychological and symptom measures were recomputed using a control group randomly selected to be closely matched with the ADHD participants on age, P = 0.573. This reanalysis produced highly similar patterns of effects and effect sizes for both neuropsychological and symptom measures]. Because of the exploratory nature of this set of analyses, adjustment for multiple comparisons was performed using the false discovery rate method.31 All significant group differences except for that on the item “feeling like in a ‘fog’” remained significant after adjustment.
Standardized Assessment of Concussion
Table 3 displays main effects of ADHD and LD on SAC Total and subtest scores. SAC total scores were lower for individuals with ADHD (d = −0.34) and LD (d = −0.59). Follow-up analyses of subscale scores showed main effects of ADHD and LD for the Immediate Memory (ADHD d = −0.22; LD d = −0.27) and Concentration (ADHD d = −0.29; LD d = −0.54) subscales, with LD also showing an effect for Delayed Recall (d = −0.21), although raw score differences between ADHD/LD and control groups were small.
TABLE 3.
Main Effects of ADHD/LD on Baseline SAC Performance
| ADHD |
No ADHD |
LD |
No LD |
ADHD Main Effect |
LD Main Effect |
|||||||||
|---|---|---|---|---|---|---|---|---|---|---|---|---|---|---|
| N | Mean (SD) | N | Mean (SD) | N | Mean (SD) | N | Mean (SD) | F | P | d | F | P | d | |
| SAC total | 144 | 26.38 (2.08) | 3719 | 27.04 (1.96) | 122 | 25.89 (2.12) | 3741 | 27.05 (1.96) | 7.79 | 0.005 | −0.34 | 33.6 | <0.001 | −0.59 |
| Orientation | 139 | 4.76 (0.44) | 3642 | 4.84 (0.39) | 121 | 4.76 (0.48) | 3660 | 4.84 (0.39) | 3.65 | 0.056 | −0.20 | 3.22 | 0.073 | −0.20 |
| Immediate memory | 139 | 14.40 (1.07) | 3642 | 14.57 (0.79) | 121 | 14.36 (0.93) | 3660 | 14.57 (0.80) | 4.13 | 0.042 | −0.22 | 6.23 | 0.013 | −0.27 |
| Concentration | 139 | 3.24 (1.20) | 3642 | 3.59 (1.20) | 121 | 2.95 (1.23) | 3660 | 3.60 (1.20) | 5.55 | 0.019 | −0.29 | 28.2 | <0.001 | −0.54 |
| Delayed memory | 139 | 4.01 (0.99) | 3642 | 4.05 (1.07) | 121 | 3.83 (1.04) | 3660 | 4.05 (1.07) | <1 | 0.983 | −0.04 | 4.79 | 0.029 | −0.21 |
Represents a subset of the sample with no history of concussion. ADHD/LD main effects extracted from a series of 2-way ANOVAs (there were no interactions between ADHD and LD on these measures). Possible score ranges are as follows: total score (0–30), orientation (0–5), immediate memory (0–15), concentration (0–5), and delayed memory (0–5).
SAC, standardized assessment of concussion.
Neuropsychological Performance
The main effects of ADHD and LD on the neuropsychological measures are presented in Table 4. ADHD was associated with lower baseline performance on several neuropsychological tests, including Trails B (d = 0.85), HVLT Immediate Recall (d = −0.28), and the Stroop task (d = −0.35). LD was associated with poorer performance on all neuropsychological tests except HVLT Recognition (P = 0.531, d = −0.11): HVLT Immediate Recall (d = −0.53), HVLT Delayed Recall (d = −0.32), Trails B (d = 0.96), Symbol-Digit Modalities (d = −0.50), Stroop Color-Word (d = −0.62), and COWAT (d = −0.53).
TABLE 4.
Main Effects of ADHD and LD on Baseline Neuropsychological Performance
| ADHD |
No ADHD |
LD |
No LD |
ADHD Main Effect |
LD Main Effect |
|||||||||
|---|---|---|---|---|---|---|---|---|---|---|---|---|---|---|
| N | Mean (SD) | N | Mean (SD) | N | Mean (SD) | N | Mean (SD) | F | P | d | F | P | d | |
| HVLT immediate | 49 | 23.39 (4.73) | 1737 | 24.58 (4.17) | 61 | 22.41 (4.64) | 1725 | 24.62 (4.16) | <1 | 0.326 | −0.28 | 13.7 | <0.001 | −0.53 |
| HVLT delayed | 49 | 7.92 (2.56) | 1736 | 8.55 (2.32) | 61 | 7.8 (2.29) | 1724 | 8.55 (2.33) | 1.65 | 0.200 | −0.27 | 4.33 | 0.038 | −0.32 |
| HVLT recognition | 49 | 22.37 (1.85) | 1738 | 22.62 (1.75) | 61 | 22.43 (1.47) | 1726 | 22.62 (1.76) | <1 | 0.414 | −0.14 | <1 | 0.531 | −0.11 |
| Trails part B | 49 | 83.86 (31.44) | 1738 | 65.12 (21.67) | 61 | 86.00 (30.17) | 1726 | 64.92 (21.52) | 17.7 | <0.001 | 0.85 | 37.7 | <0.001 | 0.96 |
| Symbol-digit | 46 | 54.02 (8.96) | 1732 | 56.24 (10.37) | 61 | 51.26 (11.00) | 1717 | 56.36 (10.28) | <1 | 0.642 | −0.21 | 12.5 | <0.001 | −0.50 |
| Stroop color-word | 49 | 43.18 (8.04) | 1731 | 46.47 (9.34) | 61 | 40.84 (7.04) | 1719 | 46.58 (9.34) | 1.68 | 0.019 | −0.35 | 18.3 | <0.001 | −0.62 |
| COWAT | 49 | 38.31 (10.8) | 1737 | 39.2 (11.36) | 61 | 33.38 (8.77) | 1725 | 39.39 (11.38) | <1 | 0.622 | −0.08 | 16.6 | <0.001 | −0.53 |
Represents a subset of the sample with no history of concussion. ADHD/LD main effects extracted from a series of 2-way ANOVAs (preliminary analyses found no interactions between ADHD and LD on these measures). Higher scores on Trails represent worse performance. Possible score ranges are as follows: HVLT Immediate Recall (0–36), HVLT Delayed Recall and Recognition (0–12), Symbol-Digit (0 or more; number correct in 90 seconds), Stroop (0 or more; number correct in 45 seconds), Trails/COWAT (0 or higher).
COWAT, Controlled Oral Word Association Test; HVLT, Hopkins Verbal Learning Test.
Interactions Between Attention Deficit-Hyperactivity Disorder, Learning Disability, and Concussion History
Secondary analyses were also conducted to explore the interaction of ADHD, LD, and concussion history for symptom ratings and SAC scores (as data on these variables was available for the largest portion of the sample). A 3-way (ADHD × LD × concussion history) interaction was present for symptom ratings, F(1,8023) = 21.40, P < 0.001. The Figure illustrates the nature of the interaction, where a main effect of concussion history was significant and largest for individuals with ADHD (such that individuals with ADHD and multiple historical concussions reported more symptoms than those with ADHD and fewer concussions; , P < 0.001). A significant but smaller effect of concussion history was present in normal controls (, P < 0.001), whereas symptom reporting was unrelated to concussion history in participants with LD (, P < 0.159). A large effect of concussion history on symptom reporting was also present for athletes with comorbid ADHD and LD (with more historical concussions associated with increased symptom reporting in this group; , P < 0.001), but this effect is likely less stable as sample size was extremely limited in groups with comorbid ADHD/LD and 2 (n = 4) or 3+ (n = 8) concussions. There were no 2- or 3-way interactions with concussion history for the SAC total or subtest scores.
DISCUSSION
This study is one of the first to address questions about the extent to which a history of ADHD or LD is associated with athletes’ histories of concussion and responses to standard concussion assessment measures. In this large baseline sample of high school and collegiate athletes, both ADHD and LD were associated with roughly 2 to 3 times the prevalence of having experienced multiple historical concussions. This is consistent with prior work on the relationship between neurodevelopmental disorders and injury risk, suggesting that athletes with ADHD and/or LD are at increased risk for repetitive concussive injuries. The results also complement recent findings from another sample (n = 139) in which NCAA Division I athletes with self-reported ADHD more commonly reported a history of concussion than those without ADHD.32 Based on the defining characteristics and associated features of ADHD (eg, executive dysfunction, impulsivity), it is intuitive that ADHD in particular was associated with increased concussion exposure as compared with LD. To the extent that repeat concussions may result in a cumulative impact on neurologic functioning,33–36 these findings suggest that caution is warranted in managing concussion in athletes with ADHD and LD, given their elevated history of repeat injury (and possible increased risk for future reinjury). Future work directly exploring how developmental disorders may affect acute response to concussions will be useful to determine the extent to which ADHD and LD are associated with an altered course of recovery.
Another question for further study pertains to the mechanism underlying increased risk of concussion in individuals with developmental disorders. For example, could the neurocognitive underpinnings of these disorders (eg, disinhibition, impaired self-monitoring, or increased reaction time during cognitively demanding tasks) lead these athletes to high-risk situations on the field? Or, do underlying neurophysiological substrates of ADHD/LD create a lower threshold for the occurrence of concussion and clinical manifestation of concussive symptoms? Ongoing work will be important to understand what factors predict individual thresholds for concussive injury in ADHD/LD populations. The advent of newer accelerometer technologies that enable the recording of head impacts in real time and correlation of biomechanical data with clinical measures may be especially informative in this regard.
That participants with ADHD reported more symptoms at baseline (eg, 34% reported difficulty concentrating, vs 10% of controls) implies that using a uniform approach to interpret postinjury data in athletes with ADHD could mislead practitioners to overestimate the presence and severity of concussion in these athletes. Surprisingly, although ADHD alone was associated with increased symptom reporting, comorbid ADHD/LD was not. This indicates that athletes with both ADHD and LD respond to the GSC more like those with LD than those with ADHD, a finding that requires replication and further study to determine its underlying cause. Furthermore, symptom reporting in the ADHD group was related to concussion history such that athletes with both ADHD and concussive histories reported more baseline symptoms than those with ADHD and more minimal concussive histories. Additional study is required to determine whether this finding reflects chronic symptoms associated with incomplete recovery from concussions in athletes with ADHD versus cohort effects (eg, groups with ADHD and concussive histories may have more severe ADHD, which could jointly cause more symptoms and injury proneness).
Attention deficit-hyperactivity disorder and LD were also both associated with poorer baseline performance on neuropsychological tests, with LD associated broadly with reduced performance on nearly all cognitive measures and ADHD associated more selectively with decrements on measures of attention and executive control. Although current guidelines do not advocate for routine baseline testing,5 these findings underscore the potential importance of baseline testing in such special populations given the challenges in applying normative data to these individuals. Alternatively, practitioners without baseline data on athletes with ADHD/ LD can reference available studies such as this to determine how best to adjust clinical judgments for athletes with these conditions. It is unclear to what extent the small but significant group differences on the SAC (roughly 1 point lower for ADHD and LD vs control participants) are clinically meaningful, but given the measure’s small scale and prior work finding high (94%) sensitivity (to concussion) for a 1-point decline in SAC total scores,24 a 1-point difference may be meaningful for this measure.
Although these findings represent a preliminary step in demonstrating the relevance of considering developmental disorders in concussion assessment, several methodological limitations warrant mention. Most importantly, histories of developmental disorders and prior concussions were assessed at the same time (ie, cross-sectionally) through retrospective self-report. Because of lack of temporality, we cannot draw conclusions regarding causation, although we can hypothesize that ADHD/LD could increase risk of concussion given common assumptions about these disorders as rooted in early development. That rates of ADHD and LD in our sample were comparable with epidemiologic data37 and patterns of neuropsychological deficits across ADHD and LD groups consistent with prior work suggests that athletes’ self-report may be accurate. Furthermore, our sample predominantly consisted of male football players, and consequently, these results may not apply to female athletes or athletes from other sports. Nevertheless, analysis of special populations within already restricted samples of concussed athletes is challenging, and this study accumulated one of the largest available samples to date of athletes with ADHD and/or LD from which to begin to answer important questions about these populations. With several large-scale prospective studies of sport-related concussion ongoing and continued improvements to the science of concussion research, in the future, it should be possible to follow athletes with ADHD/LD as injuries occur to better understand the interplay between such individual factors and risk for and response to concussive injury.
In summary, athletes with ADHD and/or LD have a higher prevalence of self-reported prior concussion and respond differently than normal controls on concussion assessment measures. Attention deficit-hyperactivity disorder was associated with increased symptom reporting at baseline, and both ADHD and LD were associated with lower performance on baseline cognitive testing. Concussion history and ADHD also seem to interact such that athletes with ADHD and histories of multiple concussions reported higher symptom levels at baseline than those with ADHD and fewer prior injuries. The findings imply that athletes with ADHD and/or LD may represent at-risk groups and may require tailored assessment and management strategies. Preseason baseline testing, or the use of separate normative data, may be particularly important for these populations. Future work should elucidate the mechanism for possible increased injury risk and evaluate whether recovery after concussion is altered in individuals with neurodevelopmental disorders.
FIGURE.
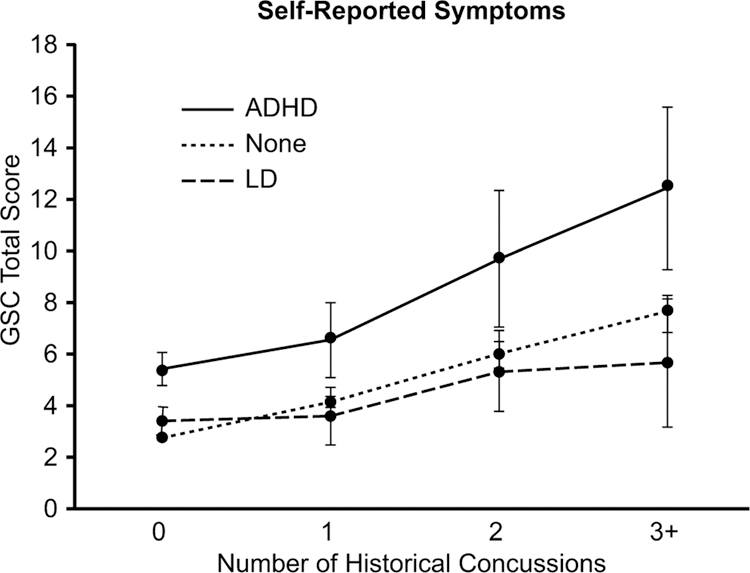
Interaction between ADHD/LD groups and concussion history for baseline symptom ratings. Error bars reflect ±1 SE.
Acknowledgments
Supported in part by funding from the National Collegiate Athletic Association (NCAA) and the National Operating Committee on Standards for Athletic Equipment (NOCSAE), Center for Disease Control’s National Center for Injury Prevention and Control, University of North Carolina Injury Prevention Research Center, Waukesha Memorial Hospital Foundation, National Academy of Neuropsychology, National Federation of State High School Associations, NFL Charities, Green Bay Packer Foundation, Milwaukee Bucks, Herbert H. Kohl Charities, Waukesha Service Club, Michael Emme, and the Medical College of Wisconsin General Clinical Research Center (M01 RR00058 from the National Institutes of Health).
Footnotes
The authors report no conflicts of interest.
REFERENCES
- 1.Guskiewicz KM, Weaver NL, Padua DA, et al. Epidemiology of concussion in collegiate and high school football players. Am J Sports Med. 2000;28:643–650. [DOI] [PubMed] [Google Scholar]
- 2.Halstead ME, Walter KD. Sport-related concussion in children and adolescents. Pediatrics. 2010;126:597–615. [DOI] [PubMed] [Google Scholar]
- 3.Powell JW, Barber-Foss KD. Traumatic brain injury in high school athletes. JAMA. 1999;282:958–963. [DOI] [PubMed] [Google Scholar]
- 4.Bakhos LL, Lockhart GR, Myers R, et al. Emergency department visits for concussion in young child athletes. Pediatrics. 2010;126:e550–556. [DOI] [PubMed] [Google Scholar]
- 5.McCrory P, Meeuwisse WH, Aubry M, et al. Consensus statement on concussion in sport: the 4th International Conference on Concussion in Sport held in Zurich, November 2012. Br J Sports Med. 2013;47:250–258. [DOI] [PubMed] [Google Scholar]
- 6.Harmon KG, Drezner JA, Gammons M, et al. American Medical Society for Sports Medicine position statement: concussion in sport. Br J Sports Med. 2013;47:15–26. [DOI] [PubMed] [Google Scholar]
- 7.Jerome L ADHD and driving safety. CMAJ. 2003;169:16. [PMC free article] [PubMed] [Google Scholar]
- 8.DiScala C, Lescohier I, Barthel M, et al. Injuries to children with attention deficit hyperactivity disorder. Pediatrics. 1998;102:1415–1421. [DOI] [PubMed] [Google Scholar]
- 9.Brehaut JC, Miller A, Raina P, et al. Childhood behavior disorders and injuries among children and youth: a population-based study. Pediatrics. 2003;111:262–269. [DOI] [PubMed] [Google Scholar]
- 10.Bijur PE, Haslum M, Golding J. Cognitive outcomes of multiple mild head injuries in children. J Dev Behav Pediatr. 1996;17:143–148. [PubMed] [Google Scholar]
- 11.Davidson LL. Hyperactivity, antisocial behavior, and childhood injury: a critical analysis of the literature. J Dev Behav Pediatr. 1987;8:335–340. [PubMed] [Google Scholar]
- 12.Christoffel KK, Donovan M, Schofer J, et al. Psychosocial factors in childhood pedestrian injury: a matched case-control study. Kid’s’n’Cars Team. Pediatrics. 1996;97:33–42. [PubMed] [Google Scholar]
- 13.Collins MW, Grindel SH, Lovell MR, et al. Relationship between concussion and neuropsychological performance in college football players. JAMA. 1999;282:964–970. [DOI] [PubMed] [Google Scholar]
- 14.Elbin RJ, Kontos AP, Kegel N, et al. Individual and combined effects of LD and ADHD on computerized neurocognitive concussion test performance: evidence for separate norms. Arch Clin Neuropsychol. 2013;28: 476–484. [DOI] [PubMed] [Google Scholar]
- 15.Gillberg C, Gillberg IC, Rasmussen P, et al. Co-existing disorders in ADHD – implications for diagnosis and intervention. Eur Child Adolesc Psychiatry. 2004;13(suppl 1):I80–I92. [DOI] [PubMed] [Google Scholar]
- 16.Wisniewska B, Baranowska W, Wendorff J. The assessment of comorbid disorders in ADHD children and adolescents. Adv Med Sci. 2007;52 (suppl 1):215–217. [PubMed] [Google Scholar]
- 17.Guskiewicz KM, McCrea M, Marshall SW, et al. Cumulative effects associated with recurrent concussion in collegiate football players: the NCAA Concussion Study. JAMA. 2003;290:2549–2555. [DOI] [PubMed] [Google Scholar]
- 18.McCrea M, Guskiewicz KM, Marshall SW, et al. Acute effects and recovery time following concussion in collegiate football players: the NCAA Concussion Study. JAMA. 2003;290:2556–2563. [DOI] [PubMed] [Google Scholar]
- 19.Randolph C, Millis S, Barr WB, et al. Concussion symptom inventory: an empirically derived scale for monitoring resolution of symptoms following sport-related concussion. Arch Clin Neuropsychol. 2009;24:219–229. [DOI] [PMC free article] [PubMed] [Google Scholar]
- 20.Guskiewicz KM, Bruce SL, Cantu RC, et al. National Athletic Trainers’ Association position statement: management of sport-related concussion. J Athl Train. 2004;39:280–297. [PMC free article] [PubMed] [Google Scholar]
- 21.Quality Standards Subcommittee of the American Academy of Neurology. Practice parameter: the management of concussion in sports (summary statement): report of the Quality Standards Subcommittee. Neurology. 1997;48:581–585. [DOI] [PubMed] [Google Scholar]
- 22.Kelly JP, Rosenberg JH. Diagnosis and management of concussion in sports. Neurology. 1997;48:575–580. [DOI] [PubMed] [Google Scholar]
- 23.McCrea M, Randolph C, Kelley KP. The Standardized Assessment of Concussion (SAC): Manual for Administration, Scoring, and Interpretation. 2nd ed. Waukesha, WI: CNS Inc.; 2000. [Google Scholar]
- 24.Barr WB, McCrea M. Sensitivity and specificity of standardized neurocognitive testing immediately following sports concussion. J Int Neuropsychol Soc. 2001;7:693–702. [DOI] [PubMed] [Google Scholar]
- 25.McCrea M Standardized mental status testing on the sideline after sport-related concussion. J Athl Train. 2001;36:274–279. [PMC free article] [PubMed] [Google Scholar]
- 26.Benedict RHB, Schretlen D, Goninger L, et al. Hopkins Verbal Learning Test—Revised: normative data and analysis of inter-form and test-retest reliability. Clin Neuropsychol. 1998;12:43–55. [Google Scholar]
- 27.Reitan RM, Wolfson D. The Halstead-reitan Neuropsychological Test Battery: Therapy and Clinical Interpretation. Tuscon, AZ: Neuropsychological Press; 1985. [Google Scholar]
- 28.Smith A Symbol Digits Modalities Test. Los Angeles, CA: Western Psychological Services; 1982. [Google Scholar]
- 29.Golden CJ, Freshwater SM. The Stroop Color and Word Test. Wood Dale, IL: Stoelting Co.; 2002. [Google Scholar]
- 30.Strauss E, Sherman EMS, Spreen O. A Compendium of Neuropsychological Tests: Administration, Norms, and Commentary. 3rd ed. New York, NY: Oxford University Press; 2006. [Google Scholar]
- 31.Benjamini Y, Hochberg Y. Controlling the false discovery rate: a practical and powerful approach to multiple testing. J R Statist Soc B. 1995;57: 289–300. [Google Scholar]
- 32.Alosco ML, Fedor AF, Gunstad J. Attention deficit hyperactivity disorder as a risk factor for concussions in NCAA Division-I athletes. Brain Inj. 2014;28:472–474. [DOI] [PubMed] [Google Scholar]
- 33.Iverson GL, Gaetz M, Lovell MR, et al. Cumulative effects of concussion in amateur athletes. Brain Inj. 2004;18:433–443. [DOI] [PubMed] [Google Scholar]
- 34.Collins MW, Lovell MR, Iverson GL, et al. Cumulative effects of concussion in high school athletes. Neurosurgery. 2002;51:1175–1179; discussion 1180–1171. [DOI] [PubMed] [Google Scholar]
- 35.Meehan WP III, Zhang J, Mannix R, et al. Increasing recovery time between injuries improves cognitive outcome after repetitive mild concussive brain injuries in mice. Neurosurgery. 2012;71: 885–892. [DOI] [PMC free article] [PubMed] [Google Scholar]
- 36.McCrea M, Nelson LD. Effects of multiple concussions. In: Iverson REG, ed. Oxford Handbook of Sport-Related Concussion. New York, NY: Oxford; in press. [Google Scholar]
- 37.Pastor PN, Reuben CA. Diagnosed attention deficit hyperactivity disorder and learning disability: United States, 2004–2006. Vital Health Stat. 2008;10(237):1–14. [PubMed] [Google Scholar]