

Abstract
Tandem calponin homology (CH1–CH2) domains are common actin-binding domains in proteins that interact with and organize the actin cytoskeleton. Despite regions of high sequence similarity, CH1–CH2 domains can have remarkably different actin-binding properties, with disease-associated point mutants known to increase as well as decrease affinity for F-actin. To investigate features that affect CH1–CH2 affinity for F-actin in cells and in vitro, we perturbed the utrophin actin-binding domain by making point mutations at the CH1–CH2 interface, replacing the linker domain, and adding a polyethylene glycol (PEG) polymer to CH2. Consistent with a previous model describing CH2 as a steric negative regulator of actin binding, we find that utrophin CH1–CH2 affinity is both increased and decreased by modifications that change the effective “openness” of CH1 and CH2 in solution. We also identified interface mutations that caused a large increase in affinity without changing solution “openness,” suggesting additional influences on affinity. Interestingly, we also observe nonuniform subcellular localization of utrophin CH1–CH2 that depends on the N-terminal flanking region but not on bulk affinity. These observations provide new insights into how small sequence changes, such as those found in diseases, can affect CH1–CH2 binding properties.
INTRODUCTION
Actin filaments are organized into diverse cytoskeletal structures by a wide range of actin-binding proteins (Michelot and Drubin, 2011; Harris et al., 2018). Tandem calponin homology (CH1–CH2) domains are common actin-binding motifs found in diverse proteins, including the actin cross-linkers α-actinin and filamin, as well as the membrane–actin linkers utrophin (utrn) and dystrophin (Bañuelos et al., 1998; Korenbaum and Rivero, 2002). Despite a conserved structural fold (Gimona et al., 2002) and regions of high sequence conservation (∼20% identity and ∼30% conservation across the tandem domain, Figure 1A), different CH1–CH2 domains bind to filamentous actin (F-actin) with affinities that can vary between closely related proteins by as much as an order of magnitude. For example, the affinity of α-actinin-1′s actin-binding domain (ABD) has Kd = 4 µM (Winder et al., 1995), while that of α-actinin-4′s ABD is > 50 µM (Lee et al., 2008). Similarly, filamin A’s ABD has Kd = 47 µM (Ruskamo and Ylänne, 2009) compared with 7 µM for filamin B’s ABD (Sawyer et al., 2009), and utrophin’s ABD has Kd = 19 µM compared with 44 µM for the ABD of its muscle homologue dystrophin (Winder et al., 1995).
FIGURE 1:

Measurement of bound fraction in live cells correlates with binding affinity in vitro. (A) Ribbon diagram of the actin-binding domain of utrophin (1QAG), colored for sequence similarity between utrophin, filamin, and plectin from blue to red. (B) Open and closed conformation of CH1–CH2 from the actin-binding domain of utrophin (1QAG, open) and the actin-binding domain of plectin (1MB8, closed). (C) Method for quantifying the relative bound fraction of proteins using live-cell imaging. Example images for the actin-binding domain of filamin A. The WT utrophin ABD channel is used to generate masks for the whole cell, for protein bound to actin, and for unbound protein, which are then used to calculate intensities in the CH1–CH2 channel of filamin A (bottom row, scale bar 20 µm). (D) Relative bound fraction measurements compared with that from utrophin for the actin-binding domains from filamin A (**p < 0.05), plectin (***p < 0.05), CH1 from utrophin (*p < 0.05), and CH2 from utrophin (****p < 0.05). (E) Comparison of measurements of relative bound fraction in cells with in vitro binding affinity measurements. The Kd for CH1 = 6 µM (Singh et al., 2014), the Kd for CH2 > 1000 µM (Singh et al., 2014), the Kd for flnA = 47 µM (Ruskamo and Ylänne, 2009), the Kd for plectin ≈ 120 µM, and the Kd for utrn = 13.8 µM (this study).
The ability of small differences in sequence to have a significant impact on function is particularly clear in disease-associated CH1–CH2 mutations. Mutations to the CH1–CH2 domain of α-actinin-4 are associated with focal segmental glomerulosclerosis, a kidney disorder (Weins et al., 2007; Ehrlicher et al., 2015; Feng et al., 2018), while mutations to the CH1–CH2 domain of filamin’s isoforms and dystrophin are associated with skeletal dysplasia (Krakow et al., 2004; Clark et al., 2009), muscular dystrophy (Norwood et al., 2000), and the migratory disorder periventricular nodular heterotopia (PVNH; Parrini et al., 2006).
Many of these diseases are a consequence of single point mutations that can result in either loss of function (decreased affinity for F-actin) or gain of function (increased affinity for F-actin). For example, the K255E mutation in α-actinin-4 (Lee et al., 2008) and the M251T mutation in filamin C increase actin-binding affinity (Duff et al., 2011), while missense mutations to filamin A in PVNH decrease binding affinity (Iwamoto et al., 2018). The K255E mutation to α-actinin-4 is associated with the disruption of an interaction between a tryptophan on the CH1 domain and a cation on CH2. This interaction is highly conserved among CH1–CH2 domains and is proposed to dominate inter–CH domain interactions and affect affinity by latching the domains into a compacted or “closed” configuration (Bañuelos et al., 1998; Galkin et al., 2010; Iwamoto et al., 2018; Figure 1B). Disruption of this interaction is proposed to allow the domains to adopt an open configuration upon binding to actin, reducing steric clash between CH2 and F-actin and increasing actin-binding affinity (Galkin et al., 2010). Physiologically, such increases in actin-binding affinity can cause excessive bundling and cross-linking of the cytoskeleton, compromising cellular function (Weins et al., 2007; Ehrlicher et al., 2015; Avery et al., 2017b) and resulting in changes to the physical properties of the cytoskeleton (Fletcher and Mullins, 2010; Yao et al., 2011; Moeendarbary and Harris, 2014; Harris et al., 2018). Consequently, precise tuning of CH1–CH2 affinity for F-actin appears to be critical for proper organization and function of the actin cytoskeleton.
Here, we focus on the actin-binding protein utrophin and show that its CH1–CH2 domain affinity for F-actin can be both increased and decreased by perturbations that affect the degree to which it can adopt an “open” or “closed” configuration in solution and reach a bound state through displacement of CH2 upon actin binding. We find that mutations distinct from the well-studied cation–π interaction impacted the affinity of utrophin CH1–CH2, showing that diverse modifications can alter the steric clash between CH2 and F-actin and allow tuning of CH1–CH2 domain affinity. We find that point mutations at the CH1–CH2 interface and replacing the utrophin CH1–CH2 linker domain with an unstructured linker lead to increased affinity, while a polyethylene glycol (PEG) modification of the CH2 domain that adds molecular size leads to decreased affinity. These perturbations are consistent with a model in which the degree to which the CH1 and CH2 domains can adopt “open” or “closed” conformations regulates affinity to F-actin. Interestingly, we also find that the N-terminal region of CH1, which was recently shown to affect F-actin–binding affinity (Avery et al., 2017a; Singh et al., 2017; Iwamoto et al., 2018), is sufficient to alter the subcellular localization of utrophin’s CH1–CH2 domain in live cells. The ability of small sequence changes in CH1–CH2 domains not only to increase and decrease affinity but also to alter subcellular localization provides new insight into disease-associated mutations and how spatial organization of the actin cytoskeleton is regulated.
RESULTS
Measurement of CH1–CH2 domain binding in vitro and in live cells
The overall goal of this study is to understand how changes to a CH1–CH2 actin-binding domain alter its affinity to F-actin, using utrophin as an initial model. To characterize the binding of CH1–CH2 domains to F-actin, we used two complementary approaches: 1) traditional in vitro cosedimentation assays using purified proteins and 2) live cell assays in which the relative fraction of protein bound to the actin cytoskeleton is quantified. While cosedimentation is a standard method for obtaining bulk affinity measurements, a live-cell assay offers a more rapid and convenient, if less quantitative, way to screen mutants for differences in enrichment on the actin cytoskeleton, as well as for localization to specific structures. We first sought to test whether CH1–CH2 binding assays in live cells would produce results consistent with traditional cosedimentation assays.
To measure the bound fraction of a fluorescent protein expressed in live cells, we developed a custom image analysis approach based on relative labeling of the actin cytoskeleton. Actin was imaged by expressing the actin-binding domain of utrophin, which is commonly used as a live-cell label of F-actin (Burkel et al., 2007), fused to green fluorescent protein (GFP). In a second fluorescence channel, the actin-binding domain of interest fused to mCherry was imaged. The average amount of the domain of interest bound to actin was then quantified using the utrophin channel to differentiate between bound and unbound populations (see Materials and Methods). An example showing the actin-binding domain of filamin A compared with utrophin ABD is given in Figure 1C.
We first quantified the binding of CH1 and CH2 domains alone in live cells and compared with previous measurements of CH1 and CH2 affinity. Affinity of tandem CH1–CH2 domains for F-actin is known to arise primarily from the CH1 domain, as CH2 alone cannot bind to actin (Singh et al., 2014). We separately expressed the minimal CH1 and CH2 domains from utrophin fused to mCherry (Supplemental Figure S1). The isolated CH1 domain of utrophin had a high relative bound fraction (0.55 ± 0.09, *p < 0.05; Figure 1D), although the isolated domain appeared partially insoluble, aggregating within cells (Supplemental Figure S1, A and B), consistent with previous observations about its stability in vitro (Singh et al., 2014). The isolated CH2 domain was soluble but distributed throughout the cytosol (Supplemental Figure S1C) with a low relative bound fraction (-0.27 ± 0.06, ****p < 0.05; Figure 1D), implying that it alone has minimal actin-binding activity. These measurements of relative bound fraction in live cells are consistent with in vitro affinity measurements for the isolated CH domains for utrophin (Figure 1E; Singh et al., 2014) and can be obtained rapidly for screening purposes.
Relative affinity of CH1–CH2 domains for F-actin can be detected in live cells
We next compared the binding of native CH1–CH2 domains in our live cell assay with cosedimentation affinity measurements. In tandem configurations, CH2 has been shown to act as a negative regulator of F-actin binding through a steric clash with the actin filament upon engagement of the CH1 with F-actin (Galkin et al., 2010). To bind with high affinity, the CH1–CH2 conformation is thought to adopt an “open” rather than a “closed” conformation, where the steric interaction of the CH2 with F-actin is reduced (Galkin et al., 2010). Native tandem CH domains have been shown to crystalize in a range of different conformations, including an “open” state for the utrophin actin-binding domain (utrophin’s ABD 1QAG; Keep et al., 1999; Figure 1B) and a “closed” state for plectin’s ABD (1MB8; García-Alvarez et al., 2003; Figure 1B).
We measured the relative bound fractions of the CH1–CH2 domains of utrophin (Supplemental Figure S1D), filamin A (Supplemental Figure S1E), and plectin (Supplemental Figure S1F) in live cells. We found that utrophin had the highest relative bound fraction (0.81 ± 0.02, Figure 1D), while plectin had the lowest (-0.09 ± 0.05, ***p < 0.05, Figure 1D), characterized by a greater cytoplasmic signal (Supplemental Figure S1F). These measurements are consistent with previous data showing that utrophin resides in an “open”’ conformation in solution, while plectin resides in a “closed” conformation that presents a significant steric barrier to interactions with F-actin (García-Alvarez et al., 2003; Galkin et al., 2010; Lin et al., 2011). To compare our relative bound fraction measurements in live cells directly with bulk affinity measurements, we purified plectin and utrophin ABDs and measured affinity to F-actin in cosedimentation assays (Figure 1E; Supplemental Figure S2). Utrophin’s ABD had a significantly higher binding affinity for actin (Kd = 13.8 µM) than that of the plectin construct, which showed little binding over the range of actin concentrations that we tested with our assay (Kd ≈ 120 µM). Together, these results show that a wide range of CH1–CH2 affinities can be captured by measuring relative bound fraction in live cells, though any differences in binding affinity due to actin isoforms could not be assessed.
Mutations targeting the inter-CH domain cation–π interaction increase the binding affinity of CH1–CH2 domains from plectin but not utrophin
The “open” and “closed” model of tandem calponin homology domain binding to F-actin has focused primarily on the role of a conserved cation–π interaction at the CH1–CH2 interface that latches the CH domains into a “closed” configuration. Typically this interaction is between a highly conserved aromatic residue, such as tryptophan, on the CH1 and a lysine on the CH2 domain (Borrego-Diaz et al., 2006). We wondered whether disrupting this interaction would broadly increase binding affinity, even of CH1–CH2 domains such as utrophin’s, which is already considered to be in an “open” configuration.
To test this, we made mutations to the CH2 domains of utrophin (K241E, Supplemental Figure S1G), filamin A (E254K, Supplemental Figure S1H), and plectin (K278E, Supplemental Figure S1I) that are predicted to lie at the interdomain interface and measured the resulting bound fractions in live cells (Figure 2A). Consistent with the “open” and “closed” model of CH1–CH2 binding, these mutations increased the binding of the filamin A (0.64 ± 0.05, p < 0.05) and plectin domains (0.62 ± 0.03, **p < 0.05) to F-actin, resulting in a bound fraction closer to that for the native utrophin CH1–CH2. However, the mutation of the equivalent residue on utrophin ABD had no effect on the apparent bound fraction, consistent with the idea that this domain already exists in an “open” conformation relative to filamin and plectin ABDs (Figure 1, A and B; 0.84 ± 0.02, p = 0.08; Lin et al., 2011). We made cosedimentation measurements of the plectin K278E mutant that confirmed that its bulk binding affinity increased significantly (Kd = 45.1 µM).
FIGURE 2:

Binding affinity to F-actin depends on conformation and inter-CH domain interactions. (A) Relative bound fraction measurements for the mutants of plectin (K278E, **p < 0.05) and utrophin (K241E, p = 0.08). (B) Binding curves of actin-binding domains to F-actin. Low binding is observed for plectin over the range of concentrations tested, implying a low-affinity interaction. The mutation K278E restores binding affinity. (C) Melting temperatures for the actin-binding domain of plectin and the K278E mutant of plectin’s actin-binding domain.
To test interdomain interactions in a different way, we measured melting temperature as a proxy for domain stability (Singh and Mallela, 2012; Singh et al., 2014; Avery et al., 2017a). As expected, the melting temperature of the plectin CH1–CH2 (Tm = 64.2 ± 0.4°C) was higher than that of the utrophin CH1–CH2 (Tm = 57.0 ± 0.4°C; Figure 2C), implying a more compact and stable conformation, while the plectin K278E mutation had a reduced melting temperature in comparison to those of the native domain (Tm = 58.2 ± 0.2°C; Figure 2C), consistent with reduced inter-CH domains.
Utrophin CH1–CH2 affinity is increased by alternate interface mutations that do not change solution “openness”
The mutation that targets the π–cation interaction reduced interdomain interactions for plectin’s CH1–CH2 domain and increased its affinity for F-actin but had no effect on utrophin’s CH1–CH2 domain. However, disease-associated mutations have been shown to change the affinity of tandem calponin homology domains by several orders of magnitude (Avery et al., 2017b), suggesting that other CH1–CH2 interactions could impact binding affinity. To test this, we focused on utrophin’s CH1–CH2 and investigated the contribution of different parts of the ABD to actin binding affinity.
We introduced the point mutations Q33A and T36A to the CH1–CH2 domain of utrophin, locations that are predicted to lie at the CH1–CH2 interface, and evaluated F-actin binding. In our live-cell assay, the relative bound fraction of this construct remained high (Figure 3A; 0.87 ± 0.05, p = 0.23), indicating a high actin-binding affinity. We then measured the mutant’s binding affinity in a cosedimentation assay and observed a significantly higher actin-binding affinity (Kd = 0.4 µM, Figure 3B) than for the native utrophin CH1–CH2. Consistent with this increase in affinity, we measured a lower melting temperature (Tm = 54.9 ± 0.3°C, Supplemental Figure S2D) for the mutant CH1–CH2 compared with the native domain, indicating reduced structural stability. We speculated that destabilization of CH1–CH2 interactions could increase binding affinity by two mechanisms. First, the mutations could shift the solution state of the domain to be “more open”—further reducing steric interactions upon initial binding to F-actin. Second, they could make transitioning to the bound state more favorable—in the absence of changes in solution openness.
FIGURE 3:

Mutations to the interdomain interface or interdomain linker region result in an increase in binding affinity. (A) Relative bound fraction measurements for interdomain interface mutants (p = 0.24), n-terminal deletion (p < 0.05), n-terminal deletion with Q33A T36A (p = 0.54), the actin-binding domain from filamin B (p = 0.62), and a chimera of the interdomain linker from filamin A and utrophin’s CH domains (p = 0.89). (B) Binding curves for the Q33A T36A mutation (black, Kd = 0.4 µM). The binding fit for WT utrn is shown in green for comparison. (C) The FRET ratio of domains in buffer and in the presence of actin (WT utrophin ABD shown in green and Q33A T36A shown in black). (D) Single molecule–binding dwell time histograms. (E) Binding curves for Δ-nterm (orange, Kd = 31.4 µM) and Δ-nterm Q33A T36A (magenta, Kd = 7.1 µM). (F) Binding curves for the utrn-fln-linker chimera (gray, Kd = 0.7 µM). The binding fit for WT utrophin ABD is shown in green for comparison. (G) Melting temperature measurements for the interdomain linker mutant and the interdomain interface mutant of utrophin’s actin-binding domain.
To investigate whether the interface mutations altered physical properties of CH1–CH2 domains, we measured radius of gyration (Rg), which captures CH1–CH2 solution “openness,” using small-angle x-ray scattering (SAXS; Hura et al., 2009; Supplemental Figure S3; see Materials and Methods). The plectin ABD construct had the smallest Rg (22.0 Å), suggesting a “closed” conformation in solution, while the Rg of utrophin ABD was larger (24.0 Å). The utrophin Q33A T36A mutant had an Rg similar to that of WT utrophin (23.5 Å), suggesting that the solution “openness” of the domains was similar. However, our SAXS data also indicated a slight increase in flexibility of the domain.
Förster resonance energy transfer and single-molecule measurements reveal changes in utrophin CH1–CH2 mutant binding kinetics
WT utrophin has been shown to undergo a conformational change when binding to F-actin through an induced-fit mechanism (Lin et al., 2011). We sought to test whether there was a similar structural change of the Q33A Q36A mutant upon binding to F-actin. We compared opening of the domains using Förster resonance energy transfer (FRET) in the presence and absence of F-actin. To do this, we installed an N-terminal GFP as the donor and engineered a single cysteine at position 168 on the CH2, which we chemically labeled with Alexa 555 maleimide as an acceptor fluorophore. Interestingly, both the WT and mutant domains showed a decrease in FRET in the presence of F-actin (Figure 3C), suggesting that both undergo an induced fit upon binding to actin.
If the mutant utrophin ABD has similar solution “openness” to WT utrophin ABD based on SAXS measurements and similar reduction in FRET upon F-actin binding, what could give rise to the difference in bulk affinity? We wondered whether comparing binding kinetics of the two ABDs could provide further insight. We measured the dwell times of single-molecule binding events of WT utrophin and the Q33A T36A mutant with TIRF microscopy (Figure 3D; Supplemental Figure S4). Interestingly, the mean dwell time of binding events from the Q33A T36A mutant was ∼10-fold longer than that of the WT binding domain (τQ33AT36A = 8.49 ± 0.14 s; τWT = 0.96 ± 0.01 s). However, the difference in binding affinity measured using cosedimentation was ∼30-fold, suggesting a difference in on-rate of approximately threefold. In summary, the Q33A T36A mutations affected both the on-rate and off-rate of binding.
Loss of utrophin CH1–CH2 affinity due to N-terminal truncation can be compensated for by the incorporation of CH1–CH2 interface mutations
The N-terminal flanking region varies significantly between CH1–CH2 domain proteins, both in sequence and in length (Singh et al., 2017; Iwamoto et al., 2018). This region has recently been shown to be important for actin-binding affinity, as its deletion in either utrophin (Singh et al., 2017) or ß-spectrin (Avery et al., 2017a) reduces actin binding. Interestingly, the N-terminal flanking region from filamin B is significantly shorter than that from ß-spectrin, despite the relatively high reported binding affinity (Kd ∼ 7 µM) of filamin B’s ABD for F-actin (Sawyer et al., 2009).
To confirm the importance of the N-terminal flanking region in CH1–CH2 affinity for F-actin, we truncated residues 1–27 of the utrophin ABD and expressed the remaining CH1–CH2 domain in live cells (Figure 3A; Supplemental Figure S5A). This construct (Δ-n-term) had a low bound fraction (0.25 ± 0.03, p < 0.05), indicating a reduced binding affinity to F-actin compared with that of the native utrophin CH1–CH2. This is consistent with previous results reporting the importance of this region for actin-binding affinity (Avery et al., 2017a; Singh et al., 2017; Iwamoto et al., 2018).
We wondered whether it would be possible to compensate for the loss in binding affinity by modifying the inter-CH domain interface of the Δ-n-term construct, as demonstrated above. To test this idea, we introduced the mutations Q33A T36A, which increased the affinity of the native utrophin CH1–CH2 domain into the n-terminal truncation construct (Δ-n-term Q33A T36A; Figure 3A). Remarkably, this mutation restored the bound fraction of the mutant Δ-n-term to F-actin in live cells (0.79 ± 0.03, p = 0.54, Figure 3A, Supplemental Figure S5B). Consistent with this, the incorporation of mutations into the inter-CH domain interface recovered the binding affinity of the n-terminal truncation as measured by cosedimentation (Figure 3E; Kd Δ-n-term = 31 µM; Kd Δ-n-term Q33A T36A = 7 µM). These findings suggest that some mechanisms controlling CH1–CH2 affinity, including contributions from inter-CH domain interactions and the N-terminal region, contribute to affinity in a separate and additive manner.
Utrophin CH1–CH2 interdomain linker structure affects binding affinity
Like the N-terminal flanking region, the interdomain linker region has a high level of sequence and structural diversity among native CH1–CH2 domain–containing proteins. The linker can be unstructured, as in the case of filamin and plectin (not resolved in the crystal structures of filamin A 2WFN, Ruskamo and Ylänne, 2009, or plectin 1MB8, García-Alvarez et al., 2003), or it can be helical, as in the case of utrophin (1QAG, Keep et al., 1999) and dystrophin (1DXX, Norwood et al., 2000). We postulated that the interdomain linker region could have a role in regulating CH1–CH2 domain “openness” in solution and thereby its affinity to F-actin. To test this, we generated chimeras containing the CH1 and CH2 domains from utrophin but the linker region from filamin A. In our live-cell assays, this chimeric protein had a high relative bound fraction (0.80 ± 0.07, p = 0.89; Figure 3A), indicating a high affinity for F-actin. We next expressed and purified this construct and found that the actin-binding affinity based on cosedimentation was significantly higher (Kd = 0.7 µM; Figure 3F) than that of the WT utrophin CH1–CH2. We also found that the chimeric protein had a significantly lower melting temperature (Tm = 50.5 ± 0.4°C; Figure 3G), indicating that the filamin A unstructured linker caused a “more open” configuration of the tandem CH domain in solution than the WT utrophin CH1–CH2.
To further test the effect of the linker on properties of the CH1–CH2, we measured the radius of gyration (Rg) and flexibility of the linker chimera CH1–CH2 using SAXS (Hura et al., 2009; Supplemental Figure S3; Materials and Methods). Compared with the “closed” plectin CH1–CH2 domain (Rg = 22 Å) and “open” utrophin CH1–CH2 domain (Rg = 24 Å), the utrophin–filamin-linker chimera had the largest Rg of the constructs we tested (41 Å), indicating that the unstructured linker from filamin A allowed the domain to adopt a conformation with a large separation between the CH1 and CH2 in solution. This construct was also the most flexible, potentially reducing any steric clash between the CH2 and actin filament upon binding, resulting in a higher affinity for F-actin.
Increasing the steric interaction of utrophin CH2 domain with F-actin can decrease F-actin–binding affinity
As seen in our measurements above and in previous studies (Galkin et al., 2010), “opening” of the CH1–CH2 interface is believed to reduce steric clash with the actin filament and provide increased access to the F-actin surface for CH1. We wondered whether it would be possible to reduce the F-actin affinity of CH1–CH2 domains that are in an “open” configuration in solution (e.g., native utrophin CH1–CH2, disease-associated gain-of-function mutants, utrophin interface mutants, or utrophin–filamin-linker chimeras) by modifying the CH2 domain to increase steric clash. Because CH2 alone has little or no binding interaction with F-actin (Figure 1D), we postulated that its steric interaction with actin could be increased by adding biologically inert bulk that simply increased the molecular size of the domain.
We increased the size of the CH2 domain of the WT utrophinn by conjugating a small PEG molecule to the surface of the domain (Figure 4A). Specifically, we mutated a serine, S158, to cysteine and performed a conjugation reaction with maleimide-750Da PEG, which has an approximate Rg of 1 nm. We found that the unconjugated mutant had a binding affinity similar to that of WT utrophin CH1–CH2 (Kd = 12.5 µM, Figure 4B), but the PEG-conjugated utrophin CH1–CH2 had a reduced binding affinity (Kd = 53.8 µM, Figure 4B). This result highlights that simply increasing the physical size of CH2 can reduce gains in affinity that arise from “open” conformation domains, supporting the idea that the CH2 steric clash with F-actin indeed modulates CH1–CH2 affinity.
FIGURE 4:
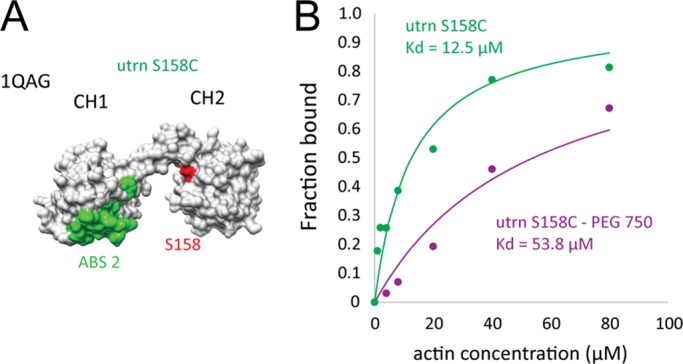
Binding affinity of CH1–CH2 to F-actin can be reduced by increasing CH2 size. (A) Surface model of the actin-binding domain of utrophin (1QAG). The F-actin–binding surface on CH1, ABS2 (Iwamoto et al., 2018), is shown in green, and residue S158 on CH2 is shown in red, which was mutated to cysteine and used for PEG conjugation. (B) Binding curves for the utrophin S158C mutant (green) and the PEG750-conjugated mutant (magenta). This size increase caused a change in binding affinity from Kd = 12.5 µM to Kd = 53.8 µM.
CH1–CH2 domain subcellular localization is affected by the N-terminal region, independent of affinity
Our live-cell assay for CH1–CH2 binding allows us to screen not only for binding affinity but also for subcellular localization to different actin structures. We quantified differences in localization by calculating the correlation coefficients relative to native utrophin CH1–CH2 and by measuring the bound amounts of proteins on different actin structures (e.g., stress fibers vs. peripheral actin networks). We first examined the utrophin–filamin CH1–CH2 linker chimera and found that its subcellular localization differed significantly from that of the WT utrophin CH1–CH2 domain. Specifically, it had a low correlation coefficient over the whole actin cytoskeleton (0.54 ± 0.04, p < 0.05, Figure 5A) and was comparatively depleted from the cell periphery (Supplemental Figure S5). However, as reported above, the CH1–CH2 linker chimera affinity was significantly higher than that of the WT utrophin ABD. This large difference in overall affinity makes it difficult to conclusively decouple the contributions of overall affinity and specificity in subcellular localization to different actin structures.
FIGURE 5:

The N-terminal flanking region plays a role in CH1–CH2 localization to different actin structures. (A) Measurements of whole-cell correlation coefficients for WT utrophin ABD, utrophin–filamin-linker (*p < 0.05), Δ-nterm (**p < 0.05), Δ-nterm Q33A T36A (***p < 0.05), and filamin B (****p < 0.05) relative to WT utrophin ABD. (B) Measurement of protein-binding density on different actin structures (stress fibers and focal adhesions) shows significant differences in binding localization for both the Δ-nterm Q33A T36A construct (magenta, *p < 0.05) and the CH1–CH2 from filamin B (blue, **p < 0.05). (C) Representative images of the different constructs. (D) Line scans sectioning a stress fiber terminating in a focal adhesion showing the intensity in each channel and the density of the construct of interest (magenta) across the line scan. Scale bars are 10 µm.
To compare subcellular localization of different CH1–CH2 domains with similar affinity, we turned to the utrophin ABD N-terminal truncation with interface mutations that we introduced previously (Δ-n-term utrn Q33A T36A). Interestingly, the subcellular localization of the mutant was significantly different from that of the WT utrophin ABD (Figure 5B; Supplemental Figure S6). The Δ-n-term Q33A T36A mutant displayed a moderate correlation with the WT utrophin ABD over the whole actin cytoskeleton (0.87 ± 0.03). Subcellularly, this mutant was distributed evenly on stress fibers and focal adhesions, while the WT utrophin CH1–CH2 was comparatively more enriched in focal adhesions (Figure 5, C and D).
Finally, we investigated the subcellular localization of filamin B’s CH1–CH2 domain, which has a short N-terminal region and a Kd = 7 µM, which is of the same order as WT utrophin ABD (Kd = 13.8 µM). Surprisingly, this domain showed preferential localization to stress fibers and was comparatively reduced at focal adhesions (Figure 5, C and D), similarly to that of the utrophin construct with N-terminal truncation (Δ-n-term Q33A T36A). These differences in localization were not a result of differences in the dynamics of the proteins as measured by fluorescence recovery after photobleaching (FRAP; Supplemental Figure S7A), indicating that the N-terminal region may play a key role in modulating specificity of CH1–CH2 domains for different actin structures, independent of bulk differences in actin-binding affinity and dynamics.
DISCUSSION
Diseases involving actin-binding proteins with CH1–CH2 mutations that exhibit a gain of function (increased actin-binding affinity) are associated with increased “openness” of the domains. This often involves the disruption of a conserved cation–π interaction that is proposed to dominate inter-CH domain interactions and hold the two globular CH domains in a compact configuration.
Consistent with this, we found that disruption of the conserved cation–π interaction increased the binding affinity of plectin to be more like that of utrophin, which is thought to reside in an “open” configuration. By making chimeras of utrophin’s CH1 and CH2 with the linker region from filamin A, we have shown that the interdomain linker region can impact binding affinity by altering the “openness” of CH1 and CH2. Previous work has compared chimeras prepared from the CH domains of utrophin and the interdomain linker region of dystrophin, which did not significantly change binding affinity (Bandi et al., 2015). Importantly, however, the linkers from utrophin and dystrophin both have a helical structure, which might not be expected to alter domain “openness.” On introducing the unstructured linker from filamin A, we observed a large increase in binding affinity. In this configuration, the CH2 can presumably move away more freely from F-actin, reducing any possible steric interactions with the filament that would hinder CH1 binding. This increased “openness” is consistent with the large Rg of the chimera in solution observed in our SAXS measurements. Furthermore, mutations to the linker region of utrophin’s native CH1–CH2 that are predicted to destabilize its helical structure had behavior similar to that of the filamin linker–utrophin chimera when expressed in cells (Supplemental Figure S5C).
If a steric clash between CH2 and F-actin is reduced when CH1–CH2 domains are in “open” configurations in solution, then increasing the steric clash should reduce binding affinity. We test this idea directly by adding size to the CH2 domain and measuring binding to F-actin. After conjugating a biochemically inert PEG molecule (Rg ∼ 1 nm) to the CH2 domain, we find that overall affinity of the domain is reduced approximately fivefold. Interestingly, this concept could present a potential therapeutic approach to diseases that result in gain of actin-binding function, where a molecule of a specific size would target the CH2 domain in order to increase the steric interaction between CH2 and F-actin, thereby reducing binding affinity. The novelty of this approach is that the interaction between CH1 and F-actin itself does not need to be disrupted, meaning that overall affinity can be reduced without completely abolishing affinity by blocking or antagonizing the CH1–to–actin binding interface.
Interestingly, we found that additional mutations to the CH1–CH2 interface of utrophin distinct from the well-studied cation–π interaction caused an increase in actin-binding affinity without altering its solution “openness.” In our measurements, WT utrophin ABD and the Q33A 36A mutant had similar Rg values and both underwent a conformational change when binding to actin, as measured by FRET. These observations suggest that mutations to the inter-CH domain interface make it easier for the protein to undergo a conformation change when binding, characterized by an approximately threefold increase in on-rate, while not having a dramatic effect on their “openness” in solution. Furthermore, we observed a change in binding off-rate of ∼10-fold for the Q33A T36A mutant. We speculate that the large difference in off-rate implies that reduced inter-CH domain interactions allow the domain to adopt a high-affinity state when bound to F-actin, potentially through reduced steric interactions between CH2 and F-actin. This notion is consistent with measurements that have shown that the CH domains from dystrophin and utrophin can adopt a range of conformations in solution, only some of which are potentially compatible with F-actin binding (Fealey et al., 2018).
Finally, we observed that the N-terminal flanking region before CH1 appears to affect CH1–CH2 domain localization to specific actin structures, independent of binding affinity. By truncating the N-terminal flanking region of utrophin (which reduces affinity) and introducing CH1–CH2 interface mutations (which increase affinity), we were able to create a construct with binding affinity similar to that of WT utrophin CH1–CH2 (Figure 3E; Figure 5A) but with significantly different subcellular localization (Figure 5, B–D). The change in localization is not the result of kinetic differences in binding, which have been proposed for the localization of myosin to the rear of migratory cells (Maiuri et al., 2015), as the kinetics of the two ABDs were similar when measured by FRAP (Supplemental Figure S7A).
These results indicate that CH1–CH2 domains could influence both the binding and the localization of full-length proteins that contain them. For example, the isoforms filamin A and filamin B have high sequence identity both across both the full-length protein (∼68%) and within the CH1–CH2 domain (∼75%), but the minimal actin-binding domains have different affinities for F-actin and different localizations, as well as different cellular functions. Filamin A plays a critical role in maintaining cortical mechanical integrity, but the presence of filamin B is not sufficient to compensate for the absence of filamin A in blebbing melanoma cells (Biro et al., 2013). Filamins also function as signaling scaffolds, interacting with more than 30 different proteins. Genetic mutations of each isoform are linked with specific filaminopathies suggesting distinct protein interactions between isoforms (Feng and Walsh, 2004). Many genetic mutations that result in filaminopathies are clustered within the actin-binding domain, and it is interesting to speculate that changes in localization could also result in differences in intracellular signaling. One region of increased diversity between these proteins is in the N-terminal flanking region. When we express the actin-binding domains from different filamin isoforms in live cells, we observe different binding characteristics. A chimera of the filamin A N-terminal flanking region with CH1 and CH2 domains from filamin B partly increased its subcellular localization to focal adhesions, but some differences in localization (compared with WT utrophin ABD) could still be observed (Supplemental Figure S8). This result implies that the N-terminal flanking region is indeed important for affinity, but also for subcellular localization of the domain. The combination of inter-CH domain and N-terminal interactions therefore creates a versatile range of actin-binding properties, including affinity to F-actin and localization to specific actin structures. While CH1–CH2 domains from different proteins share similarities in structure and sequence, small differences can be significant, affecting both binding affinity and localization and highlighting why disease-associated point mutations can have such a detrimental impact.
MATERIALS AND METHODS
Cell culture
HeLa and HEK293T cells were cultured at 37°C in an atmosphere of 5% CO2 in air in DMEM (Life Tech, #10566024) supplemented with 10% fetal bovine serum (Life Tech, #16140071) and 1% penicillin–streptomycin (Life Tech, #15140122). HEK293T cells were passaged using 0.05% trypsin and HeLa cells with 0.25% trypsin.
Generation of constructs and cell lines
To visualize the localization of different constructs with respect to WT utrophin ABD, single-expression and bicistronic-expression plasmids were generated for transient transfection, and two separate virus plasmids were generated for creating stable cell lines. PCS2+ GFP-UtrCH was a gift from William Bement (University of Wisconsin; Addgene plasmid #26737; http://n2t.net/addgene:26737; RRID:Addgene_26737; Burkel et al., 2007). cDNA for generating constructs to image WT CH domains was either amplified using PCR or synthesized directly (Integrated DNA Technologies) and inserted into the desired vector using Gibson assembly. The actin-binding domain of human filamin A corresponds to residues 1–278, and we used a construct similar to that of García-Alvarez et al. (2003) for the actin-binding domain of plectin a.a. 60–293. For dual expression, a cleavable peptide was introduced into the c terminus of GFP-UtrCH, followed by mCherry fused to the actin-binding domain of interest (Kim et al., 2011). Transient transfections were performed using Effectene (Qiagen, #301425) following the manufacturers stated protocol and imaged 24 h after transfection. To generate stable cell lines, GFP-UtrCH and the construct of interest fused to mCherry were cloned into lentiviral plasmid pHR. Lentiviruses were then generated through second-generation helper plasmids and transfected into HEK293 cells for packaging. Lentiviral supernatants were collected 48–72 h after transfection, filtered using a 0.4-µm filter, and used directly to infect the target cell line in a 1:1 ratio with normal culture media.
Protein purification and labeling
Actin was purified from rabbit muscle acetone powder (Pel Freez Biologicals, #41995-1). Actin was stored in monomeric form in G-buffer (2 mM Tris-Cl, pH 8.0, 0.2 mM ATP, 0.5 mM TCEP, 0.1 mM CaCl2) at 4°C. Petm60-Utr261 was a gift from Peter Bieling (Max Planck Institute of Molecular Physiology, Dortmund, Germany; Bieling et al., 2017). WT utrophin ABD and its associated mutants were expressed recombinantly in Escherichia coli BL21 (DE3) pLysS (Promega, #L1191) and purified using affinity chromatography followed by gel filtration. Proteins were stored in 20 mM Tris-Cl, pH 7.5, 150 mM KCl, 0.5 mM Tris(2-carboxyethyl)phosphine (TCEP) (GF-buffer) and 0.1 mM EDTA in the presence of 20% glycerol. Utrophin ABD and plectin ABD sequences included a KCK linker (GGSGKCKSA) on the C terminus for labeling. Proteins were labeled using either Alexa 555 and Alexa 488 maleimide dye (Life Technologies, #A22287 and #A20346) at the cysteine site in the KCK linker region. Briefly, proteins were reduced in 5 mM TCEP for 30 min and then buffer-exchanged over a desalting column into GF buffer without TCEP. Labeling was performed at 4°C with an approximately fivefold molar excess of dye overnight. The reaction was then quenched with dithiothreitol (DTT) and the excess dye removed by gel filtration. A typical labeling ratio was ∼75%. The actin-binding domain of plectin was purified and labeled using the same method as for utrophin, but with a reduced labelling time to yield a similar labelling ratio to utrophin. For PEG-conjugated utrophin constructs, a similar purification and labeling strategy was used, but with EGFP fused to the n-terminus of the domain so that single cysteine mutants could be used for labeling. PEG-maleimide (750 Da; Rapp Polymere) was conjugated to cysteine residues on utrophin using the same labelling strategy described above.
Spinning disk confocal imaging
Fluorescent proteins were imaged using the following excitation and emission: GFP was excited at 488 nm, and emission was collected at 525 nm; mCherry was excited at 543 nm and emission was collected at 617 nm. Live imaging experiments were performed in normal cell culture media using an OKO Labs microscope stage enclosure at 37°C in an atmosphere of 5% CO2. Cells were imaged on glass-bottomed eight-well chambers that had been coated with 10 µg/ml fibronectin. Dual-color images were used to measure differences in protein binding and localizations (Belin et al., 2014).
Relative bound fraction measurements and image difference mapping
A custom-written MatLab routine was used to calculate the relative bound fractions of different actin-binding domains, the difference maps, and correlation coefficients. Briefly, images of cells expressing GFP-utrn were thresholded and binarized to generate masks of the whole cell and actin cytoskeleton. Holes within the binary image mask were filled and this was used as an outline of the cell footprint. To generate a mask for the unbound fraction, the complementary image of the actin mask was taken, which included pixels only within the cell footprint (Figure 1C). Average pixel intensity measurements  were then made using the two masks and the relative bound amount was calculated from the equation
In some instances of very low binding, RBF was less than zero. This arises due to the geometry of the cell, where higher intensities are gathered from the cell body, where there is more cytoplasmic signal, in comparison to actin-rich regions, which are often thin and flat at the cell periphery. RBF is a convenient measure when averaging over many cells to rule out large contributions from cell geometry or F-actin abundance. For comparing the localization of different actin-binding domains, the same masking method was used to make measurements of intensity of the CH1–CH2 of interest and WT utrophin ABD. The images were normalized to their maximum values and the WT utrophin ABD image values subtracted from the CH1–CH2 image to give the difference map (Figure 5B). Pearson’s correlation coefficient was calculated from the image values to quantify whole-cell differences in localization. To measure the relative amounts of protein bound to different actin structures (stress fibers and focal adhesions), local pixel value measurements were made, background was subtracted, and measurements were normalized to the F-actin abundance within that structure (using the WT utrophin ABD channel as a reference for F-actin).
FRAP measurements
To measure the recovery rates of different proteins in live cells, we performed FRAP experiments. Measurements were made using a Zeiss LSM 880 NLO Axio Examiner using a 20× dipping objective. Cells were plated onto 6-cm plastic-bottomed dishes (Falcon) 24 h before experiments. Cells were imaged for one frame; a small circular region ∼1 µm in diameter was then bleached and imaged with a frame rate of 0.95 s/frame to monitor the fluorescence recovery. Images were analyzed using the approach of Phair et al. (2003). To calculate the proteins’ dynamics, the initial rate of recovery was measured, which was independent of the bleaching fraction or immobile fraction.
Circular dichroism and melting temperature measurements
Circular dichroism (CD) wavelength scans (250–200 nm) and temperature melts (25–80°C) were carried out using an AVIV Model 410 CD spectrometer. Temperature melts monitored absorption signal at 222 nm and were carried out at a heating rate of 4°C/min. Protein samples were prepared at ∼7.5 µM in phosphate-buffered saline in a 0.1-cm cuvette. Melting temperature data were fitted using the equation
where Tm is the melting temperature, b is the slope parameter, and T is the temperature.
Small-angle x-ray scattering measurements
Proteins were exchanged into SAXS buffer (20 mM Tris-Cl, pH 7.5, 150 mM KCl, 0.5 mM TCEP and 0.1 mM EDTA) using a 10-kDa MWCO Zeba spin desalting column (Thermo Scientific). Corresponding blanks were prepared by diluting flow-through from spin columns into appropriate buffers at the same dilution. Samples were prepared at concentrations of 3–8 mg/ml. SAXS measurements were made at the SIBYLS 12.3.1 beamline at the Advanced Light Source. The light path was generated by a superbend magnet to provide a 1012-photons/s flux (wavelength 1 Å) and detected on a Pilatus 3 2M pixel array detector. Data from each sample were collected multiple times with the same exposure length, generally 30 frames with a frame rate of 0.3 s per frame. Data were analyzed using the Scatter software.
Actin filament–binding assay
Filamentous actin was prepared by polymerizing β-actin at 162 µM for 1.5 h at room temperature. Various concentrations of F-actin were then combined with a constant concentration of fluorophore-labeled actin-binding domain (either 100 nM for utrn ABD, utrn-fil-linker ABD, utrn Q33A T36A ABD, or 1 µM plectin ABD and plectin K278E ABD) in Buffer F. Substoichiometric concentrations of actin-binding domains were used in all experiments, so that the assumption [F-actin]total ≈ [F-actin]free was valid. After incubation at room temperature for 30 min, F-actin and bound actin-binding domain were pelleted at 150,000 × g for 60 min at 4°C. The supernatants were then collected, and unbound actin-binding domain fluorescence intensity was analyzed using a fluorimeter (Biotek Instruments). Normalized bound fractions were fitted with the equation
where I is the normalized bound fraction, α is the binding stoichiometry, [F-actin] is the actin concentration, and kD is the dissociation constant. For the case of low-affinity actin-binding domains, the plectin mutant K278E and utrn-S158C-PEG, α was set equal to 1.
FRET measurements
To investigate structural changes of CH1–CH2 domains, we used FRET between GFP fused to the n-terminus of the CH1–CH2 domain of interest and Alexa 555 maleimide on CH2. S168 was mutated to cysteine for labelling with Alexa 555 maleimide (Life Tech) as described above. FRET measurements were made on a fluorescence plate reader in the presence or absence of F-actin (32 µM). FRET was determined at an excitation wavelength of 488 nm and an emission wavelength of 575 nm. Donor and acceptor bleedthrough signals were collected under identical conditions with the GFP-CH1–CH2 domain lacking the acceptor fluorophore and the free Alexa 555 dye, respectively. Bleedthrough signals were subtracted from the FRET construct fluorescence.
Single-molecule measurements
Single-molecule measurements were made as described previously (Hansen et al., 2013; Hayakawa et al., 2014). Briefly, we measured the off-rate from binding dwell-time histograms using single-molecule TIRF microscopy (Supplemental Figure S4). F-actin filaments were polymerized for 1 h to a final concentration of 5 µM at room temperature and then tethered to pegylated glass surfaces (5% biotin, peg 2k [Rapp Polymere]; Bieling et al., 2010). Surfaces were assembled in a flow chamber configuration (Bieling et al., 2010, 2017) and incubated with streptavidin followed by biotin–phalloidin (Life Technologies) to create a functional surface for tethering actin filaments. The final buffer for imaging contained 10 µg/ml β-casein (Sigma) with 0.05 nM of binding protein to obtain single-molecule dilutions in f-buffer. Images were acquired with TIRF microscopy at a frame rate of 100 ms/frame for WT utrn. Owing to the slower unbinding kinetics of the mutant Q33A T36A, a frame rate of 600 ms/frame was used. Single particles were tracked using TrackNTrace (Stein and Thiart, 2016) and analyzed with a custom-written MatLab routine.
Statistics
Error bars represent standard error for relative bound fraction and FRAP measurements. Confidence intervals for fitted data are reported melting temperature measurements. Statistical significance was determined by a two-tailed Student’s t test and assumed significant when p < 0.05.
Supplementary Material
Acknowledgments
We thank Dyche Mullins, Mohammad Mofrad, and members of the Fletcher lab for helpful discussions. This work was supported by grants from the National Institutes of Health (NIH) (D.A.F.). A.R.H. was in receipt of EMBO long-term fellowship 1075–2013 and Human Frontier Science Program fellowship LT000712/2014. B.B. was supported by a Ruth L. Kirschstein National Research Service Award fellowship from the NIH (1F32GM115091). P.J. was supported by a National Science Foundation Fellowship and the Berkeley Fellowship for Graduate Studies. A.B. was supported by the Miller Institute for Basic Research at UC Berkeley as a Miller visiting professor. We acknowledge the use of the Molecular Imaging Center core facility at UC Berkeley and the help of the Marqusee lab with the CD and melting temperature experiments. SAXS data were collected at SIBYLS beamline 12.3.1 at the Advanced Light Source (ALS). SAXS data collection at SIBYLS was funded through the Department of Energy, Biological and Environmental Research, Integrated Diffraction Analysis Technologies (IDAT) program and National Institute of General Medical Sciences Grant P30 GM124169-01, ALS-ENABLE. D.A.F. is a Chan Zuckerberg Biohub Investigator.
Abbreviations used:
- ABD
actin-binding domain
- CH
calponin homology
- F-actin
filamentous actin
- utrn
utrophin.
Footnotes
This article was published online ahead of print in MBoC in Press (http://www.molbiolcell.org/cgi/doi/10.1091/mbc.E19-06-0317) on November 6, 2019.
REFERENCES
- Avery AW, Fealey ME, Wang F, Orlova A, Thompson AR, Thomas DD, Hays TS, Egelman EH. (2017a). Structural basis for high-affinity actin binding revealed by a β-III-spectrin SCA5 missense mutation. Nat Commun , 1350. [DOI] [PMC free article] [PubMed] [Google Scholar]
- Avery AW, Thomas DD, Hays TS. (2017b). β-III-spectrin spinocerebellar ataxia type 5 mutation reveals a dominant cytoskeletal mechanism that underlies dendritic arborization. Proc Natl Acad Sci USA 201707108. [DOI] [PMC free article] [PubMed] [Google Scholar]
- Bandi S, Singh SM, Mallela KM. (2015). Interdomain linker determines primarily the structural stability of dystrophin and utrophin tandem calponin-homology domains rather than their actin-binding affinity. Biochemistry , 5480–5488. [DOI] [PubMed] [Google Scholar]
- Bañuelos S, Saraste M, Carugo KD. (1998). Structural comparisons of calponin homology domains: implications for actin binding. Structure , 1419–1431. [DOI] [PubMed] [Google Scholar]
- Belin BJ, Goins LM, Mullins RD. (2014). Comparative analysis of tools for live cell imaging of actin network architecture. BioArchitecture , 189–202. [DOI] [PMC free article] [PubMed] [Google Scholar]
- Bieling P, Hansen SD, Akin O, Li T, Hayden CC, Fletcher DA, Mullins RD. (2017). WH2 and proline-rich domains of WASP-family proteins collaborate to accelerate actin filament elongation. EMBO J e201797039. [DOI] [PMC free article] [PubMed] [Google Scholar]
- Bieling P, Telley IA, Hentrich C, Piehler J, Surrey T. (2010). Fluorescence microscopy assays on chemically functionalized surfaces for quantitative imaging of microtubule, motor, and+ TIP dynamics. Methods Cell Biol , 555–580. [DOI] [PubMed] [Google Scholar]
- Biro M, Romeo Y, Kroschwald S, Bovellan M, Boden A, Tcherkezian J, Roux PP, Charras G, Paluch EK. (2013). Cell cortex composition and homeostasis resolved by integrating proteomics and quantitative imaging. Cytoskeleton , 741–754. [DOI] [PubMed] [Google Scholar]
- Borrego-Diaz E, Kerff F, Lee SH, Ferron F, Li Y, Dominguez R. (2006). Crystal structure of the actin-binding domain of α-actinin 1: evaluating two competing actin-binding models. J Struct Biol , 230–238. [DOI] [PubMed] [Google Scholar]
- Burkel BM, Von Dassow G, Bement WM. (2007). Versatile fluorescent probes for actin filaments based on the actin-binding domain of utrophin. Cell Motil Cytoskeleton , 822–832. [DOI] [PMC free article] [PubMed] [Google Scholar]
- Clark AR, Sawyer GM, Robertson SP, Sutherland-Smith AJ. (2009). Skeletal dysplasias due to filamin A mutations result from a gain-of-function mechanism distinct from allelic neurological disorders. Hum Mol Genet , 4791–4800. [DOI] [PubMed] [Google Scholar]
- Duff RM, Tay V, Hackman P, Ravenscroft G, McLean C, Kennedy P, Steinbach A, Schöffler W, van der Ven PF, Fürst DO. (2011). Mutations in the N-terminal actin-binding domain of filamin C cause a distal myopathy. Am J Hum Genet , 729–740. [DOI] [PMC free article] [PubMed] [Google Scholar]
- Ehrlicher AJ, Krishnan R, Guo M, Bidan CM, Weitz DA, Pollak MR. (2015). Alpha-actinin binding kinetics modulate cellular dynamics and force generation. Proc Natl Acad Sci USA , 6619–6624. [DOI] [PMC free article] [PubMed] [Google Scholar]
- Fealey ME, Horn B, Coffman C, Miller R, Lin AY, Thompson AR, Schramel J, Groth E, Hinderliter A, Cembran A, Thomas DD. (2018). Dynamics of dystrophin’s actin-binding domain. Biophys J , 445–454. [DOI] [PMC free article] [PubMed] [Google Scholar]
- Feng D, Notbohm J, Benjamin A, He S, Wang M, Ang L-H, Bantawa M, Bouzid M, Del Gado E, Krishnan R. (2018). Disease-causing mutation in α-actinin-4 promotes podocyte detachment through maladaptation to periodic stretch. Proc Natl Acad Sci USA 201717870. [DOI] [PMC free article] [PubMed] [Google Scholar]
- Feng Y, Walsh CA. (2004). The many faces of filamin: a versatile molecular scaffold for cell motility and signalling. Nat Cell Biol , 1034. [DOI] [PubMed] [Google Scholar]
- Fletcher DA, Mullins RD. (2010). Cell mechanics and the cytoskeleton. Nature , 485–492. [DOI] [PMC free article] [PubMed] [Google Scholar]
- Galkin VE, Orlova A, Salmazo A, Djinovic-Carugo K, Egelman EH. (2010). Opening of tandem calponin homology domains regulates their affinity for F-actin. Nat Struct Mol Biol , 614–616. [DOI] [PMC free article] [PubMed] [Google Scholar]
- García-Alvarez B, Bobkov A, Sonnenberg A, de Pereda JM. (2003). Structural and functional analysis of the actin binding domain of plectin suggests alternative mechanisms for binding to F-actin and integrin β4. Structure , 615–625. [DOI] [PubMed] [Google Scholar]
- Gimona M, Djinovic-Carugo K, Kranewitter WJ, Winder SJ. (2002). Functional plasticity of CH domains. FEBS Lett , 98–106. [DOI] [PubMed] [Google Scholar]
- Hansen SD, Kwiatkowski AV, Ouyang C-Y, Liu H, Pokutta S, Watkins SC, Volkmann N, Hanein D, Weis WI, Mullins RD. (2013). αE-catenin actin-binding domain alters actin filament conformation and regulates binding of nucleation and disassembly factors. Mol Biol Cell , 3710–3720. [DOI] [PMC free article] [PubMed] [Google Scholar]
- Harris AR, Jreij P, Fletcher DA. (2018). Mechanotransduction by the actin cytoskeleton: converting mechanical stimuli into biochemical signals. Annu Rev Biophys , 617–631. [Google Scholar]
- Hayakawa K, Sakakibara S, Sokabe M, Tatsumi H. (2014). Single-molecule imaging and kinetic analysis of cooperative cofilin–actin filament interactions. Proc Natl Acad Sci USA , 9810–9815. [DOI] [PMC free article] [PubMed] [Google Scholar]
- Hura GL, Menon AL, Hammel M, Rambo RP, Poole Ii FL, Tsutakawa SE, Jenney FE, Jr, Classen S, Frankel KA, Hopkins RC. (2009). Robust, high-throughput solution structural analyses by small angle X-ray scattering (SAXS). Nat Methods , 606. [DOI] [PMC free article] [PubMed] [Google Scholar]
- Iwamoto DV, Huehn A, Simon B, Huet-Calderwood C, Baldassarre M, Sindelar CV, Calderwood DA. (2018). Structural basis of the filamin A actin-binding domain interaction with F-actin. Nat Struct Mol Biol . [DOI] [PMC free article] [PubMed] [Google Scholar]
- Keep NH, Norwood FL, Moores CA, Winder SJ, Kendrick-Jones J. (1999). The 2.0 Å structure of the second calponin homology domain from the actin-binding region of the dystrophin homologue utrophin. J Mol Biol , 1257–1264. [DOI] [PubMed] [Google Scholar]
- Kim JH, Lee S-R, Li L-H, Park H-J, Park J-H, Lee KY, Kim M-K, Shin BA, Choi S-Y. (2011). High cleavage efficiency of a 2A peptide derived from porcine teschovirus-1 in human cell lines, zebrafish and mice. PLoS One , e18556. [DOI] [PMC free article] [PubMed] [Google Scholar]
- Korenbaum E, Rivero F. (2002). Calponin homology domains at a glance. J Cell Sci , 3543–3545. [DOI] [PubMed] [Google Scholar]
- Krakow D, Robertson SP, King LM, Morgan T, Sebald ET, Bertolotto C, Wachsmann-Hogiu S, Acuna D, Shapiro SS, Takafuta T. (2004). Mutations in the gene encoding filamin B disrupt vertebral segmentation, joint formation and skeletogenesis. Nat Genet , 405. [DOI] [PubMed] [Google Scholar]
- Lee SH, Weins A, Hayes DB, Pollak MR, Dominguez R. (2008). Crystal structure of the actin-binding domain of α-actinin-4 Lys255Glu mutant implicated in focal segmental glomerulosclerosis. J Mol Biol , 317–324. [DOI] [PMC free article] [PubMed] [Google Scholar]
- Lin AY, Prochniewicz E, James ZM, Svensson B, Thomas DD. (2011). Large-scale opening of utrophin’s tandem calponin homology (CH) domains upon actin binding by an induced-fit mechanism. Proc Natl Acad Sci USA , 12729–12733. [DOI] [PMC free article] [PubMed] [Google Scholar]
- Maiuri P, Rupprecht J-F, Wieser S, Ruprecht V, Bénichou O, Carpi N, Coppey M, De Beco S, Gov N, Heisenberg C-P. (2015). Actin flows mediate a universal coupling between cell speed and cell persistence. Cell , 374–386. [DOI] [PubMed] [Google Scholar]
- Michelot A, Drubin DG. (2011). Building distinct actin filament networks in a common cytoplasm. Curr Biol , R560–R569. [DOI] [PMC free article] [PubMed] [Google Scholar]
- Moeendarbary E, Harris AR. (2014). Cell mechanics: principles, practices, and prospects. Wiley Interdiscip Rev Syst Biol Med , 371–388. [DOI] [PMC free article] [PubMed] [Google Scholar]
- Norwood FL, Sutherland-Smith AJ, Keep NH, Kendrick-Jones J. (2000). The structure of the N-terminal actin-binding domain of human dystrophin and how mutations in this domain may cause Duchenne or Becker muscular dystrophy. Structure , 481–491. [DOI] [PubMed] [Google Scholar]
- Parrini E, Ramazzotti A, Dobyns WB, Mei D, Moro F, Veggiotti P, Marini C, Brilstra EH, Bernardina BD, Goodwin L. (2006). Periventricular heterotopia: phenotypic heterogeneity and correlation with Filamin A mutations. Brain , 1892–1906. [DOI] [PubMed] [Google Scholar]
- Phair RD, Gorski SA, Misteli T. (2003). Measurement of dynamic protein binding to chromatin in vivo, using photobleaching microscopy. Methods Enzymol , 393–414. [DOI] [PubMed] [Google Scholar]
- Ruskamo S, Ylänne J. (2009). Structure of the human filamin A actin-binding domain. Acta Crystallogr D Biol Crystallogr , 1217–1221. [DOI] [PubMed] [Google Scholar]
- Sawyer GM, Clark AR, Robertson SP, Sutherland-Smith AJ. (2009). Disease-associated substitutions in the filamin B actin binding domain confer enhanced actin binding affinity in the absence of major structural disturbance: insights from the crystal structures of filamin B actin binding domains. J Mol Biol , 1030–1047. [DOI] [PubMed] [Google Scholar]
- Singh SM, Bandi S, Mallela KM. (2017). The N-terminal flanking region modulates the actin binding affinity of the utrophin tandem calponin-homology domain. Biochemistry , 2627–2636. [DOI] [PubMed] [Google Scholar]
- Singh SM, Bandi S, Winder SJ, Mallela KM. (2014). The actin binding affinity of the utrophin tandem calponin-homology domain is primarily determined by its N-terminal domain. Biochemistry , 1801–1809. [DOI] [PubMed] [Google Scholar]
- Singh SM, Mallela KM. (2012). The N-terminal actin-binding tandem calponin-homology (CH) domain of dystrophin is in a closed conformation in solution and when bound to F-actin. Biophys J , 1970–1978. [DOI] [PMC free article] [PubMed] [Google Scholar]
- Stein SC, Thiart J. (2016). TrackNTrace: a simple and extendable open-source framework for developing single-molecule localization and tracking algorithms. Sci Rep , 37947. [DOI] [PMC free article] [PubMed] [Google Scholar]
- Weins A, Schlondorff JS, Nakamura F, Denker BM, Hartwig JH, Stossel TP, Pollak MR. (2007). Disease-associated mutant α-actinin-4 reveals a mechanism for regulating its F-actin-binding affinity. Proc Natl Acad Sci USA , 16080–16085. [DOI] [PMC free article] [PubMed] [Google Scholar]
- Winder SJ, Hemmings L, Maciver SK, Bolton SJ, Tinsley JM, Davies KE, Critchley DR, Kendrick-Jones J. (1995). Utrophin actin binding domain: analysis of actin binding and cellular targeting. J Cell Sci , 63–71. [DOI] [PubMed] [Google Scholar]
- Yao NY, Becker DJ, Broedersz CP, Depken M, MacKintosh FC, Pollak MR, Weitz DA. (2011). Nonlinear viscoelasticity of actin transiently cross-linked with mutant α-actinin-4. J Mol Biol , 1062–1071. [DOI] [PMC free article] [PubMed] [Google Scholar]
Associated Data
This section collects any data citations, data availability statements, or supplementary materials included in this article.