Abstract
In rapidly adapting asexual populations, including many microbial pathogens and viruses, numerous mutant lineages often compete for dominance within the population1–5. These complex evolutionary dynamics determine the outcomes of adaptation, but have been difficult to observe directly. While earlier studies used whole-genome sequencing to follow molecular adaptation6–10, these methods have limited resolution in microbial populations. Here, we introduce a novel renewable barcoding system to observe evolutionary dynamics at high resolution in laboratory budding yeast. We find nested patterns of interference and hitchhiking even at low frequencies. These events are driven by the continuous appearance of new mutations that modify the fates of existing lineages before they reach substantial frequencies. We observe how the distribution of fitness within the population changes over time, finding a “traveling wave” of adaptation that has been predicted by theory11–17. We show that clonal competition creates a dynamical rich-get-richer effect: fitness advantages acquired early in evolution drive clonal expansions, which increase the chances of acquiring future mutations. However, less-fit lineages also routinely leapfrog over strains of higher fitness. Our results demonstrate that this combination of factors, which is not accounted for in any existing model of evolutionary dynamics, is critical in determining the rate, predictability, and molecular basis of adaptation.
Rapidly adapting populations have complex evolutionary dynamics. In these systems, adaptation is not mutation-limited18. Instead, numerous beneficial mutations arise simultaneously and drive competing clonal expansions7–9, often accompanied by neutral and deleterious hitchhikers6,19. Recent work has shown that this is the dominant mode of adaptation in many bacterial and viral pathogens20–22, and in the somatic evolution of cancer23 and immune repertoires24. In these contexts, clonal interference and hitchhiking have important consequences for the pace, outcomes and repeatability of evolution.
This mode of rapid adaptation cannot be described by classical evolutionary theory, because the fate of each mutation cannot be modeled in isolation11,25,26. Instead, selection acts on physically linked combinations of alleles, leading to complex co-dependency between the fates of different mutations. This limits the efficiency of selection and renders evolution less predictable: strongly beneficial mutations can be outcompeted while deleterious mutations in good genetic backgrounds can spread through the population6,13,27.
Recently, numerous studies have used whole-genome sequencing to investigate these effects in laboratory microbial populations6–10. This work has shown that clonal interference and hitchhiking are widespread. However, limitations on sequencing depth make it impractical to achieve a frequency resolution of better than a few percent, and recent barcoding-based methods5,28,29 that offer better resolution are limited to short timescales. These are critical limitations in large microbial populations, where theory suggests that the fates of mutations are often determined over long timescales by competition and hitchhiking among rare high-fitness lineages, and that the vast majority of driver mutations never reach detectable frequencies11–17.
Here, we develop a renewable barcoding approach to observe evolutionary dynamics at high resolution on long timescales, by periodically adding new barcodes to split each tracked lineage into labelled “sublineages” (Fig. 1a). Our approach uses three orthogonal Lox sites: Cre-mediated recombination occurs between sites of the same type, but not between orthogonal types. Each site can be inactivated by two specific arm disruptions (one in each of the two Cre binding regions), but retains high activity with only one disruption. We used this system to design barcoded plasmid libraries with complementary Cre/Lox architecture, which we use to integrate barcodes at a designated genomic “landing pad” locus (Fig. 1b, SI section 1). At each barcode addition, Cre-mediated recombination combines arm disruptions to inactivate an old Lox site, and adds a new orthogonal Lox site with a single arm disruption to be used for the next barcode addition with a complementary plasmid library (SI section 1). Each plasmid also contains an inactive drug marker lacking a start codon; correct integration activates this marker by combining it with a start codon in the landing pad, separated by an artificial intron.
Figure 1. Renewable barcoding system and lineage dynamics.
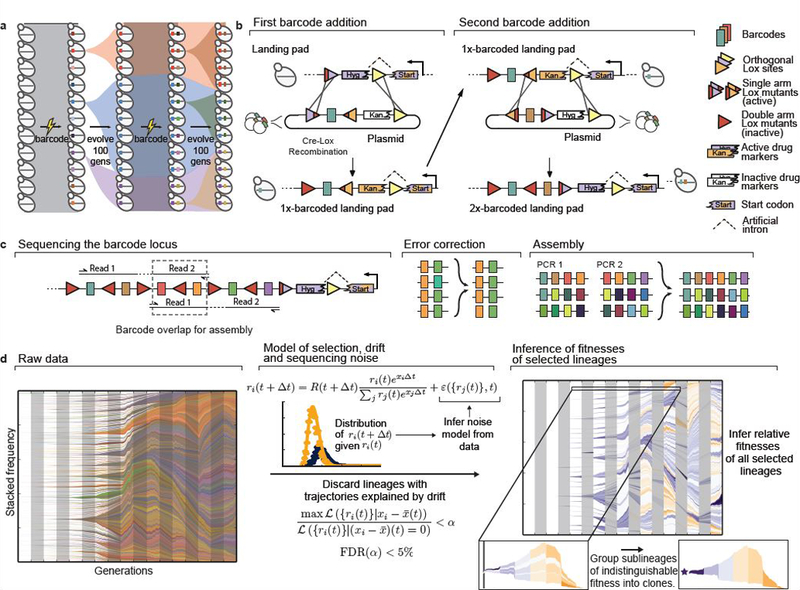
a, Experimental design. Diverse DNA barcodes are introduced into an initially clonal population; each barcode labels a small lineage. Every 100 generations, we introduce new diverse barcodes immediately adjacent to existing barcodes, subdividing each lineage into sublineages. b, Renewable barcoding system, using a novel Cre-Lox system consisting of three orthogonal Lox sites (colored triangles), each of which can be modified with two arm disruptions (red shading) that are individually tolerated but jointly inactivating (SI section 1). At each barcode addition, we combine arm disruptions to inactivate the old Lox site, while adding a new orthogonal active Lox site; alternating Lox orientations further limit undesired recombination. Drug markers contain an intron 3’ splice accepting site and must correctly integrate at the landing pad containing the 5’ splice donor to be functional. c, When the barcode locus exceeds the length of an Illumina read, we use custom priming sites to sequence overlapping sets of four consecutive barcodes. After exploiting barcode diversity to identify and correct sequencing errors, we use these overlaps to unambiguously reconstruct the full barcode locus (SI section 2). d, Inference pipeline. At left, raw barcode frequencies over time (left to right, colors chosen at random). For legibility, we only show lineages or sublineages whose frequency exceeds 0.1% in at least one timepoint; combined frequencies of lineages that do not individually reach 0.1% are shown as white space (or the color of the parent when that parent exceeds 0.1% frequency). Center panel summarizes model for identifying selected lineages. Briefly, we use the data to construct a parametric model for the strength of noise from genetic drift and sequencing and discard trajectories explained by noise alone. We then jointly infer fitnesses of all remaining lineages, and group lineages of indistinguishable fitness into clones.
This system integrates new DNA barcodes immediately downstream of existing barcodes. Each individual thus acquires a string of barcodes encoding its ancestry, which can be read by sequencing. We read four barcodes per 150bp paired-end Illumina read; when the barcode locus exceeds this length, we exploit overlapping fragments to assemble the complete locus, after using high barcode diversity to correct sequencing errors (Fig. 1c, SI sections 1.5, 2). This allows us to track the frequencies of all lineages and sublineages and hence trace the ancestry of the entire population.
We used this system to evolve two diploid yeast populations founded from identical clonal ancestors, each labelled with ~50,000 diverse barcodes. We maintained both populations in batch culture, with a 1:1024 dilution every 24h (10 generations per day with a bottleneck of ~500,000 cells, an effective size Ne~5×10⁶). An aliquot was frozen daily for analysis (SI section 1.4). One population was maintained in rich media (YPD) and the other in rich media with acetic acid at 0.3% (YPA), which leads to intracellular acidification that pilot studies suggested result in stronger selection pressures30. Our goal in studying these populations is to identify generic features of the dynamics rather than details of differences between conditions; our choice of environments maintains consistency with previous work, which suggests these conditions lead to rapid adaptation involving rich dynamics that have been impossible to observe using earlier approaches5–8.
We re-barcoded each population every 100 generations with an additional ~50,000 unique barcodes. This diversity was chosen to ensure that barcoding does not introduce a significant bottleneck: at 10% of the daily bottleneck every 10 days, it does not change the scale of genetic drift or the effective population size (SI section 4.4). It also ensures that we can detect relevant selection pressures acting on lineages once those lineages become large enough that their dynamics are not dominated by drift (SI section 4.4). However, we note that although our barcoding procedure is designed to be minimally perturbative, it does involve propagation and selection steps. Thus strictly speaking we are studying evolution in a fluctuating environment that alternates between “evolution” and “barcoding” conditions, though as we see below these fluctuations play a minor role.
After 1000 generations of evolution (ten 100-generation “epochs”), we sequenced the barcode locus at a depth of ~105 in every frozen timepoint. This yielded 110 sequenced timepoints per population (11 timepoints per epoch, at 10-generation intervals, though we excluded the final epoch of the YPD population due to barcoding failure, see SI section 1.4). We use this data to infer which lineages contain mutations beneficial in either evolution or barcoding conditions; we exploit phylogeny to infer in which epoch each mutation established (i.e. within 100-generation resolution; Fig. 1d, SI section 5). This allows us to group barcodes into “clones”, each founded by a new mutation. We then jointly infer the fitness effects of all mutations in evolution and barcoding conditions. Since we barcode frequently, the dynamics are determined by the average fitness across the two conditions (SI section 6.2). We therefore use this average fitness for the analysis below (though simply neglecting the barcoding environment leads to qualitatively similar conclusions, see SI section 6).
Our ability to detect mutations is limited primarily by genetic drift; we cannot identify mutations until they are common enough that their fitness effects lead to frequency changes larger than this stochastic force (this typically corresponds to lineages at frequencies >10−4). Because our fitness inference requires sufficient timecourse information, we are also unable to detect most mutations arising in the final 100–200 generations of the experiment (SI section 5.3). Thus our analysis only identifies a subset of beneficial mutations, and our “clones” are clonal only with respect to these.
We find that in both populations, many beneficial mutations arise early in the experiment, founding clones that compete for dominance (Fig. 2a,b). Some of these clones diversify through further beneficial mutations, and a handful obtain multiple mutations, which interfere with one another within the parent clone (Fig. 2c-d). In some cases we observe multiple nested interference events (e.g. Fig. 2c, upper left and 2d, lower left). All but the largest of these events are undetectable by metagenomic sequencing (at ~25x depth, corresponding to approximately the same total number of sequencing reads as our barcode data, Extended Data Figure 1a,b).
Figure 2. Inferred clonal dynamics.
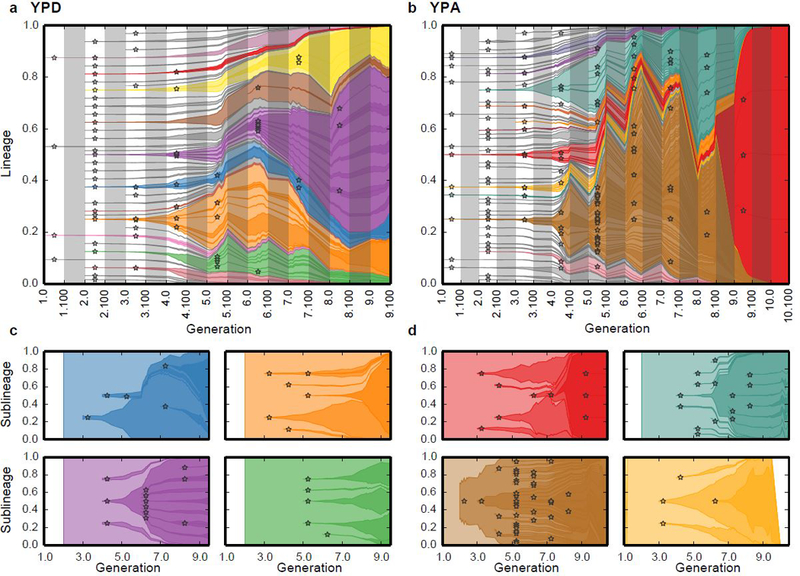
a, b, Muller diagrams showing dynamics of inferred beneficial mutations in YPD (a) and YPA (b) populations. Time is denoted by epoch and generation (e.g. 4.100 refers to the generation 100 of epoch 4). Stars denote establishment epoch of each new beneficial mutation (SI section 5). Color opacity denotes fitness of the corresponding lineage; mutant lineages that did not acquire additional beneficial mutations are grey. Grey bars denote barcoding intervals. c, d, Muller diagrams showing within-lineage dynamics in select lineages in the YPD (c) and YPA (d) populations; colors are consistent with corresponding lineages in (a,b). White space indicates periods during which the select lineage was not observed.
We can also visualize how the fitness composition of the population changes over time (Fig. 3). The population initially diversifies as numerous beneficial mutations arise on the ancestral background, creating a distribution of fitness within the population (Fig. 3a,b). As these clones expand, the mean fitness of the population increases (Fig. 3, Extended Data Figure 2), causing less-fit lineages to fall behind and begin to die out. However, diversity is maintained by new beneficial mutations, which continuously create clones of even higher fitness (Fig. 3c,d). This maintenance of diversity in the face of strong selection is an expected feature of rapid adaptation that has been predicted by theory11–17 but not previously observed directly.
Figure 3. Travelling wave dynamics.
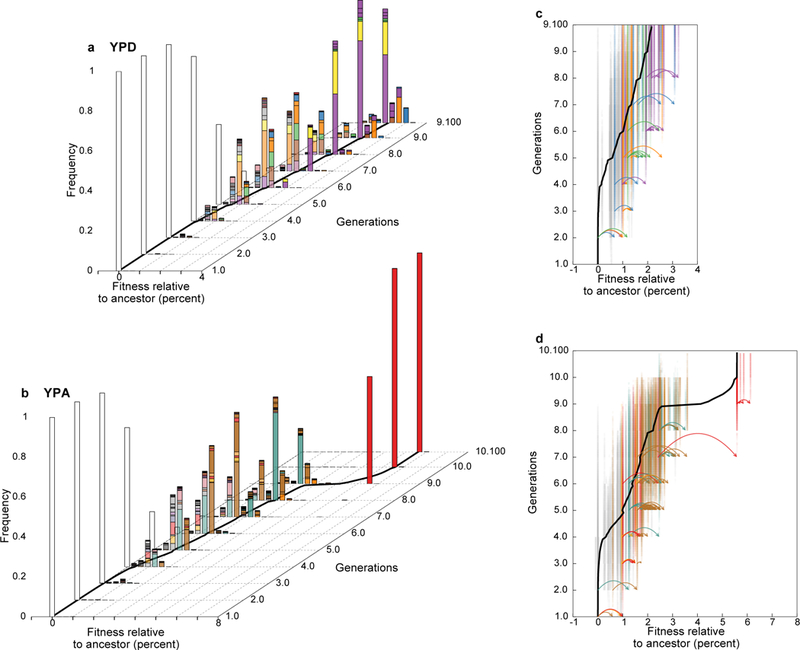
a, b Inferred distribution of fitness within the population through time. All fitnesses refer to average across evolution and barcoding conditions (SI section 6.2). Each colored bar denotes the frequency and fitness of a corresponding lineage in Fig. 2. White bar corresponds to the ancestor. Black line denotes inferred population mean fitness. c, d, Genealogical relationships among lineages show frequent leapfrogging events. Each clonal lineage is shown at its corresponding fitness; color opacity indicates lineage frequency. Colors of highlighted lineages shown in Fig. 2c, d are consistent with that figure; all other lineages are grey. Mutational events within highlighted lineages are shown as arrows; each event arises in one clonal lineage and founds a new lineage at a new fitness.
These dynamics lead to a complex picture of the determinants of success of individual lineages. In the absence of further mutations, the fitness of a lineage should be the only predictor of its success. Yet we find that the initial fitness of a mutant lineage is only a modest predictor of its fate (Fig. 4a). Another key factor is whether a lineage acquires further beneficial mutations (Fig. 4b). While this is influenced by fitness (see below), even high-fitness lineages that do not acquire further beneficial mutations are readily outcompeted, and lower-fitness lineages that acquire multiple mutations can succeed (Extended Data Figure 3). The likelihood a lineage acquires further beneficial mutations is in turn affected by two main factors (Fig. 4c). First, larger lineages have more opportunities to acquire beneficial mutations. Second, the fitness of a lineage plays a critical role: mutations arising in a highly fit and hence rapidly expanding lineage will be less likely to be lost to genetic drift. Thus highly fit backgrounds can accumulate both strong and weak-effect beneficial mutations, while only rare strong mutations can establish on lower-fitness backgrounds. Consistent with this, Fig. 4d,e show that high-fitness backgrounds acquire both weakly and strongly beneficial mutations, while low-fitness backgrounds only acquire the latter. This means that more-fit backgrounds have access to a larger number of beneficial mutations, creating a rich-get-richer effect that can lead to bursts of mutations at the expanding front of the fitness wave. These bursts arise due to dynamical considerations, and are not in themselves evidence of historical contingency due to mutator phenotypes or other modifiers of adaptability (SI section 6.5).
Figure 4. Traveling wave dynamics and factors determining the success of mutant lineages.
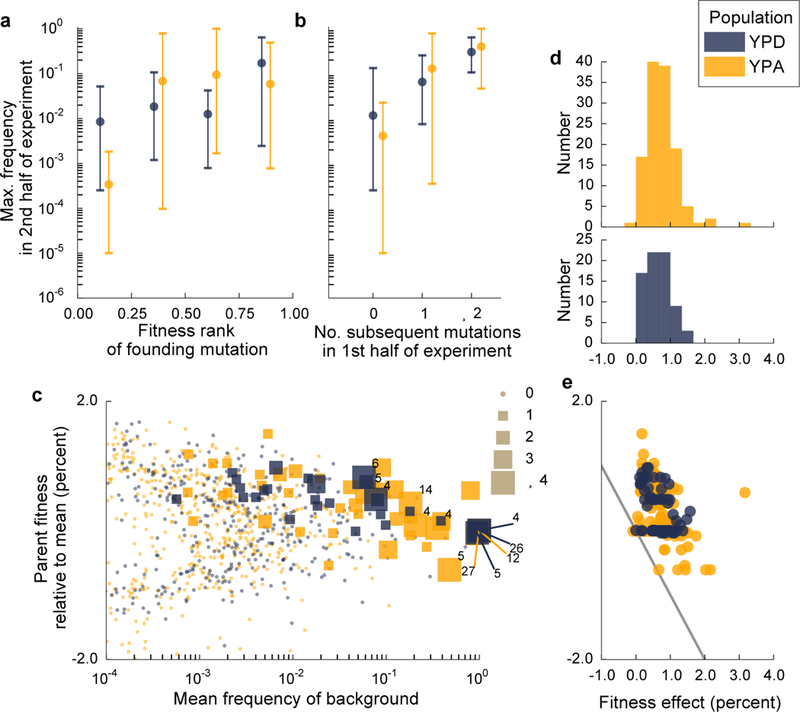
a, Relationship between initial within-population fitness rank of a mutation arising in the ancestral background and its maximum frequency in the latter half of the experiment (using latter half avoids confounding axes in b; n=35 and n=47 unique lineages in YPD and YPA respectively). Dots represent the mean, and lines show range of maximum frequencies in each founding fitness quantile. b, Relationship between the number of subsequent beneficial mutations landing on the founding clonal background of a lineage (in the first half of the experiment) to its eventual maximum frequency (in the second half of the experiment). c, Effect of lineage frequency and fitness on the likelihood of acquiring additional beneficial mutations. Each point represents the mean frequency and fitness of a lineage in a given 100-generation interval; symbol size denotes how many further beneficial mutations that lineage acquired (numbers indicate lineages that acquire >4). d, Histograms of effect sizes of all inferred mutations. e, Effect sizes of mutations arising on parental backgrounds as a function of mean parental relative fitness in the epoch each mutation arose. Region below grey line corresponds to mutations that would create lineages less fit than the current mean fitness.
These results are qualitatively consistent with recent theory suggesting that rapidly evolving populations can be described by “traveling wave” models11–17. In this picture, mutations continuously generate variation in fitness while selection destroys it by eliminating less-fit genotypes, leading to a broad distribution of fitness around an increasing mean (a “fitness wave”). However, these models have only been analyzed in parameter regimes where the future common ancestor of a population is always one of the fittest lineages (though see Ref.17). Instead, clonal competition in our experiment is characterized by routine “leapfrogging” events, where lineages of initially low relative fitness acquire strong beneficial mutations that pull them to prominence, causing dramatic reversals of fate. For example, in the YPD population (Fig. 3c) the initially fittest green lineage is leapfrogged by the orange, blue, and purple backgrounds; the blue lineage then falls behind only to later leapfrog all others. Similarly, in the YPA population (Fig. 3d), the brown lineage appears to outcompete the turquoise, red, and yellow lineages, only to be leapfrogged by two strongly beneficial mutations in an initially much less fit red lineage (replay experiments validate this event, see SI section 6.3).
Leapfrogging events not only alter fates of individual lineages, but also cause fluctuations in the fitness distribution and modulate the pace of adaptation. Both within-population fitness and genetic variation increase during initial diversification before reaching a plateau as a traveling wave is established (Figure 3, Extended Data Figure 4). However, leapfrogging can cause fluctuations in this traveling wave: the creation of an anomalously high-fitness lineage can lead to an initial reduction in diversity, but at the same time enable rapid further diversification within this lineage which later re-establishes variation (Figure 3c,d, Extended Data Figure 4). These fluctuations thus affect the success of any individual mutation and the dynamics of the traveling wave, and hence play a major role in determining the outcomes of evolution.
Previous theory has assumed that the effects of leapfrogging and fluctuations are occasional perturbations that can be largely neglected11–17. Our results suggest that they instead play a central role. Although our system involves modestly sized microbial populations, the importance of these effects is expected to depend only weakly on population size and mutation rate (because relevant timescales only depend logarithmically on these quantities; see e.g. Ref. 17 and Appendix D of Ref. 12). Thus our results suggest that leapfrogging and fluctuations may be routine in the evolution of a wide range of microbes and viruses. A new theoretical framework is essential to develop accurate models of evolution in these systems. The renewable barcoding approach we have introduced here offers the potential to test these models, and to observe evolutionary dynamics in a variety of contexts at sufficient resolution to explore the role of other factors such as frequency dependent selection or mutations that alter the adaptability of individual lineages.
Extended Data
Extended Data Figure 1: Allele frequency trajectories in the two populations, as detected from metagenomic sequencing.
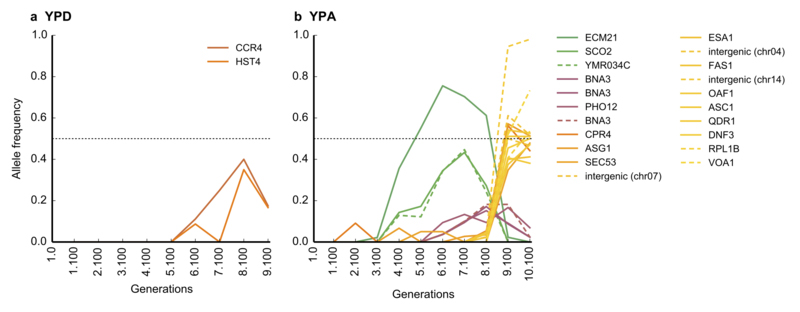
In both the YPD (a) and the YPA population (b), full lines denote missense and nonsense mutations, and dotted lines denote synonymous mutations and those falling in intergenic regions. Lines are colored according to the peak time of the trajectory. Note that a frequency of 50% (dotted line) corresponds to a mutation fixing as a heterozygote.
Extended Data Figure 2: Comparison of inferred and measured population mean fitness trajectories.
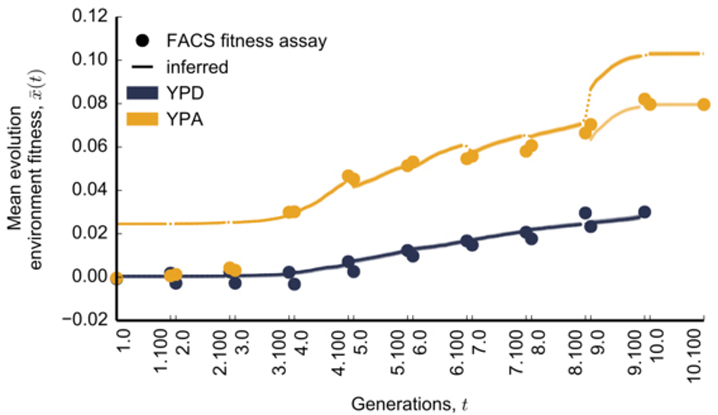
All fitness measurements and inferences refer to the evolution environment only. Trajectories have been offset to agree with the fitness assay at timepoint 3.100. Dots denote barcoding intervals. Shaded regions around the trajectories denote estimates of confidence intervals for the inferred mean fitness trajectory, which often does not exceed the width of lines (SI section 6.1). In the case of the YPA population, lighter colors denote mean fitness trajectories over the last two epochs, offset to agree with fitness assays in the last timepoint (see SI section 6.6 for a discussion of potential reasons for these discrepancies).
Extended Data Figure 3: Predictors of the success of lineages.
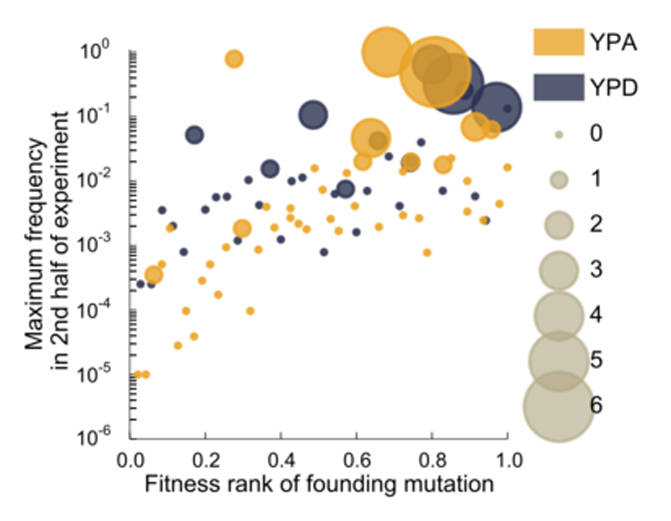
Size of each dot denotes the number of later beneficial mutations that occur in the founding clonal background of a lineage (in the first half of the experiment).
Extended Data Figure 4: Genetic variation through time.
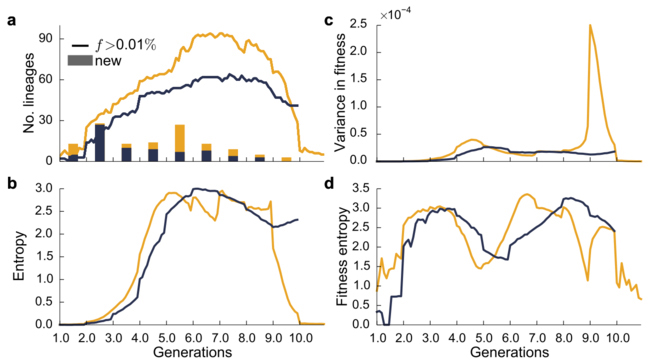
a, Total number of lineages above a threshold frequency (0.01%) through time; bars denote number of new lineages arising in each 100-generation interval. b, Genetic diversity within each population over time, as measured by entropy (SI section 6.4). c, Variance in fitness through time. d, Fitness diversity within each population over time, as measured by fitness entropy. Fitness entropy quantifies how fitness variance is distributed among lineages (SI section 6.4)
Supplementary Material
ACKNOWLEDGEMENTS
We thank Elizabeth Jerison, Alan Moses, Andrew Murray, and members of the Desai lab for comments on the manuscript. A.N.N.B. acknowledges support from NSERC. I.C. acknowledges support from the NSF-Simons Center for Mathematical and Statistical Analysis of Biology at Harvard University, supported by NSF grant no. DMS-1764269, and the Harvard FAS Quantitative Biology Initiative. K.R.L. acknowledges support from the Fannie & John Hertz Foundation Graduate Fellowship Award and the NSF Graduate Research Fellowship Program. S.F.L. acknowledges support from grants HG008354 and HL127522 from the NIH. M.M.D. acknowledges support from the Simons Foundation (Grant 376196), grant DEB-1655960 from the NSF, and grant GM104239 from the NIH. Computational work was performed on the Odyssey cluster supported by the Research Computing Group at Harvard University.
Footnotes
The authors declare no competing financial interests.
Supplementary Information is linked to the online version of the paper at www.nature.com/nature.
DATA AND CODE AVAILABILITY STATEMENT
Raw sequencing reads have been deposited in the NCBI BioProject database under accession number PRJNA559526. All associated metadata, as well as the source code for the sequencing pipeline, downstream analyses, and figure generation, are available at GitHub (https://github.com/icvijovic/lineage-tracking).
REFERENCES CITED
- 1.Gerrish P. & Lenski R The Fate of Competing Beneficial Mutations in an Asexual Population. Genetica 102/103, 127–144 (1998). [PubMed] [Google Scholar]
- 2.Desai MM, Fisher DS & Murray AW The Speed of Evolution and Maintenance of Variation in Asexual Populations. Current Biology 17, 385–394 (2007). [DOI] [PMC free article] [PubMed] [Google Scholar]
- 3.Miller CR, Joyce P. & Wichman HA Mutational Effects and Population Dynamics During Viral Adaptation Challenge Current Models. Genetics 187, 185–202 (2011). [DOI] [PMC free article] [PubMed] [Google Scholar]
- 4.de Visser J, Zeyl CW, Gerrish PJ, Blanchard JL & Lenski RE Diminishing returns from mutation supply rate in asexual populations. Science 283, 404–406 (1999). [DOI] [PubMed] [Google Scholar]
- 5.Levy SF et al. Quantitative evolutionary dynamics using high-resolution lineage tracking. Nature 519, 181–186 (2015). [DOI] [PMC free article] [PubMed] [Google Scholar]
- 6.McDonald MJ, Rice DP & Desai MM Sex speeds adaptation by altering the dynamics of molecular evolution. Nature 531, 233–236 (2016). [DOI] [PMC free article] [PubMed] [Google Scholar]
- 7.Lang GI et al. Pervasive genetic hitchhiking and clonal interference in forty evolving yeast populations. Nature 500, 571–574 (2013). [DOI] [PMC free article] [PubMed] [Google Scholar]
- 8.Kvitek DJ & Sherlock G. Whole Genome, Whole Population Sequencing Reveals That Loss of Signaling Networks Is the Major Adaptive Strategy in a Constant Environment. PLoS genetics 9, e1003972 (2013). [DOI] [PMC free article] [PubMed] [Google Scholar]
- 9.Good BH, McDonald MJ, Barrick JE, Lenski RE & Desai M. The dynamics of molecular evolution over 60,000 generations. Nature 551, 45–50 (2017). [DOI] [PMC free article] [PubMed] [Google Scholar]
- 10.Tenaillon O. et al. Tempo and mode of genome evolution in a 50,000-generation experiment. Nature 536, 165–170 (2016). [DOI] [PMC free article] [PubMed] [Google Scholar]
- 11.Neher RA Genetic Draft, Selective Interference, and Population Genetics of Rapid Adaptation. Annual Review of Ecology, Evolution, and Systematics 44, 195–215 (2013). [Google Scholar]
- 12.Desai MM & Fisher DS Beneficial Mutation-Selection Balance and the Effect of Linkage on Positive Selection. Genetics 176, 1759–1798 (2007). [DOI] [PMC free article] [PubMed] [Google Scholar]
- 13.Good BH, Rouzine IM, Balick DJ, Hallatschek O. & Desai MM Distribution of fixed beneficial mutations and the rate of adaptation in asexual populations. Proceedings of the National Academy of Sciences 109, 4950–4955 (2012). [DOI] [PMC free article] [PubMed] [Google Scholar]
- 14.Rouzine I, Brunet E. & Wilke C. The traveling-wave approach to asexual evolution: Muller’s ratchet and the speed of adaptation. Theoretical Population Biology 73, 24–46 (2008). [DOI] [PMC free article] [PubMed] [Google Scholar]
- 15.Tsimring LS, Levine H. & Kessler DA RNA virus evolution via a fitness-space model. Physical review letters 76, 4440 (1996). [DOI] [PubMed] [Google Scholar]
- 16.Hallatschek O. The noisy edge of traveling waves. Proceedings of the National Academy of Sciences 108, 1783–1787 (2011). [DOI] [PMC free article] [PubMed] [Google Scholar]
- 17.Fisher DS Asexual evolution waves: fluctuations and universality. Journal of Statistical Mechanics: Theory and Experiment 2013, P01011 (2013). [Google Scholar]
- 18.Cvijovic I, Nguyen Ba AN & Desai MM Experimental Studies of Evolutionary Dynamics in Microbes. Trends in Genetics 34, 693–703 (2018). [DOI] [PMC free article] [PubMed] [Google Scholar]
- 19.Buskirk SW, Peace RE & Lang GI Hitchhiking and epistasis give rise to cohort dynamics in adapting populations. Proceedings of the National Academy of Sciences 114, 8330–8335 (2017). [DOI] [PMC free article] [PubMed] [Google Scholar]
- 20.Zanini F. et al. Population genomics of intrapatient HIV-1 evolution. eLife 4, e11282 (2015). [DOI] [PMC free article] [PubMed] [Google Scholar]
- 21.Lieberman TD et al. Parallel bacterial evolution within multiple patients identifies candidate pathogenicity genes. Nat Genet 43, 1275–1280 (2011). [DOI] [PMC free article] [PubMed] [Google Scholar]
- 22.Strelkowa N. & Lässig M. Clonal Interference in the Evolution of Influenza. Genetics 192, 671–682 (2012). [DOI] [PMC free article] [PubMed] [Google Scholar]
- 23.Nik-Zainal S. et al. The Life History of 21 Breast Cancers. Cell 149, 994–1007 (2012). [DOI] [PMC free article] [PubMed] [Google Scholar]
- 24.Nourmohammad A, Otwinowski J, Luksza M, Mora T. & Walczak AM Clonal competition in B-cell repertoires during chronic HIV-1 infection. bioRxiv (2018). [Google Scholar]
- 25.Muller H. Some Genetic Aspects of Sex. American Naturalist 66, 118–138 (1932). [Google Scholar]
- 26.Maynard Smith J. Evolution in Sexual and Asexual Populations. American Naturalist 102, 469 (1968). [Google Scholar]
- 27.Good BH & Desai MM Deleterious passengers in adapting populations. Genetics 198, 1183–1208 (2014). [DOI] [PMC free article] [PubMed] [Google Scholar]
- 28.Blundell JR & Levy SF Beyond genome sequencing: Lineage tracking with barcodes to study the dynamics of evolution, infection, and cancer. Genomics 104, 417–430 (2014). [DOI] [PubMed] [Google Scholar]
- 29.Blundell JR et al. The dynamics of adaptive genetic diversity during the early stages of clonal evolution. bioRxiv, 170589 (2017). [DOI] [PMC free article] [PubMed] [Google Scholar]
- 30.Ludovico P, Sousa MJ, Silva MT, Leao C. & Corte-Real M. Saccharomyces cerevisiae commits to a programmed cell death process in response to acetic acid. Microbiology 147, 2409–2415 (2001). [DOI] [PubMed] [Google Scholar]
Associated Data
This section collects any data citations, data availability statements, or supplementary materials included in this article.


