. 2019 Dec 31;8:e50503. doi: 10.7554/eLife.50503

Figure 2. Pure GABAergic sPSCs and ePSCs in rescued CRs.

(A) Spontaneous PSCs (sPSCs) recorded in rescued CRs from ΔNp73cre/+;R26Kir2.1/+ at P27 (blue) and ΔNp73cre/+;Baxlox/lox mutants at P26 (green), respectively. (B) Plots of the frequency and amplitude of sPSCs (n = 11 for ΔNp73cre/+; R26Kir2.1/+ and n = 11 for ΔNp73cre/+; Baxlox/lox mice at P24-29; frequency: p=0.552, amplitude: p=0.580, Student T Test). Rise time is 2.10 ± 0.42 ms vs 1.02 ± 0.20 ms and decay time 34.26 ± 6.39 ms vs 29.14 ± 3.56 ms for ΔNp73cre/+;R26Kir2.1/+ and ΔNp73cre/+;Baxlox/lox mice, respectively. (C) Mean evoked PSCs (ePSCs) for rescued CRs respectively from a ΔNp73cre/+;R26Kir2.1/+ mutant at P29 (blue) and a ΔNp73cre/+;Baxlox/lox mutant at P26 (green) upon stimulation of LI neuronal fibers (stimulation time, arrowhead) in control conditions (top), with SR95531 (middle) and SR95531 in Mg2+-free solution (bottom). Note that ePSCs completely disappeared after bath application of SR95531. (D) Amplitudes of ePSCs in control conditions, with SR95531 and with SR95531 in Mg2+-free solution (ΔNp73cre/+;R26Kir2.1/+ mice at P24-29: ncontrol = 10, nSR95531 = 8 and nSR95531/Mg2+free=8; ΔNp73cre/+;Baxlox/lox: ncontrol = 8, nSR95531 = 5 and nSR95531/Mg2+free=5; Kruskal-Wallis test followed by a Bonferroni multiple comparison when comparing the three conditions for each mutant; Student T test for comparison of control ePSCs between ΔNp73cre/+;R26Kir2.1/+ and ΔNp73cre/+;Baxlox/lox mutants, p=0.638). To detect CRs in ΔNp73cre/+;Baxlox/lox mutants the R26mT/+ reporter line was used. Data used for quantitative analyses as well as the numerical data that are represented in graphs are available in Figure 2—figure supplement 1—source data 1.

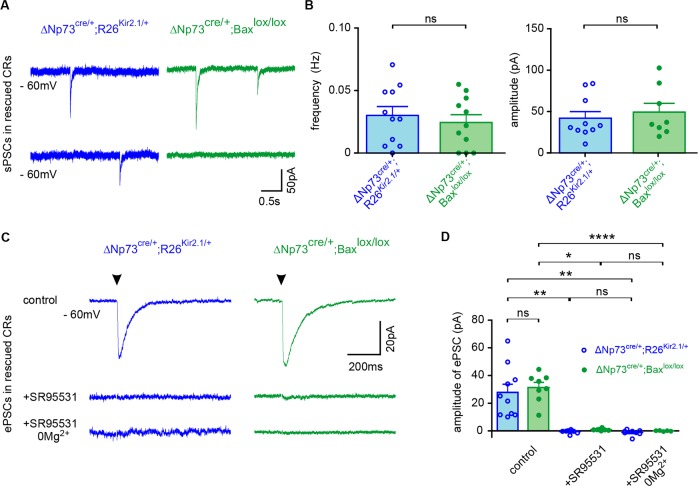
Figure 2.

Figure 2—figure supplement 1. Pure GABAergic sPSCs and ePSCs in control CRs during early postnatal development.

Figure 2—figure supplement 1.

(A) Spontaneous PSCs (sPSCs) recorded in a control CR from ΔNp73cre/+;R26mt/+ at P10. (B) Plots of the frequency and amplitude of sPSCs (n = 8) (p=0.0025 and p=0.0022 for the frequency of sPSCs of controls compared to rescued CRs of both ΔNp73cre/+;R26Kir2.1/+ and ΔNp73cre/+;Baxlox/lox;R26mT/+ mice (Figure 2A); one-way ANOVA followed by a Bonferroni post hoc test). (C) Mean evoked PSCs (ePSCs) for a control CR at P9-11 upon stimulation of LI neuronal fibers in control conditions (top), with SR95531 (middle) and SR95531 in Mg2+-free solution (bottom). Note that ePSCs completely disappeared after bath application of SR95531. Stimulation artefacts were blanked for visibility. The stimulation time is indicated (arrowheads). (D) Amplitudes of ePSCs in control conditions (p=0.0027 and p=0.0067 for the amplitude of ePSCs in controls compared to rescued CRs of ΔNp73cre/+;R26Kir2.1/+ and ΔNp73cre/+;Baxlox/lox;R26mT/+mice, (Figure 2D); one-way ANOVA followed by a Bonferroni post hoc test), in the presence of SR95531 and with SR95531 in Mg2+-free solution (ncontrol = 8, nSR95531 = 7 and nSR95531/Mg2+free=7; Kruskal-Wallis test followed by a Bonferroni multiple comparison). (E) Confocal images of a control CR at P10 in ΔNp73cre/+;TauGFP/+ mice expressing GFP (green), Gephyrin (red) and contacted by GABAergic GAD65/67-positive presynaptic terminals (blue; objective 93×; stack of 109 Z sections, each 0.07 µm, n = 11). Arrowheads show GABAergic synapses onto the CR. Note the partial co-localization of GAD65/67 and Gephyrin on the GFP+ membrane of the CR (Inset). Scale bars: 5 µm and 1 µm (inset). (F) Confocal images of a Layer I CR in the cortex and non-CR in the hypothalamus at P10 stained for DAPI (blue), KCC2 (red) and GFP (green) in ΔNp73cre/+; TauGFP/+ mice (objective 93×; single plane of 0.07 µm, n = 6). Note the low level of KCC2 expression in control CR (upper panels) compared to non-CR of ΔNp73cre/+;TauGFP/+ mice (bottom panels). Scale bar represents 5 µm. Data used for quantitative analyses as well as the numerical data that are represented in graphs are available in Figure 2—figure supplement 1—source data 1.
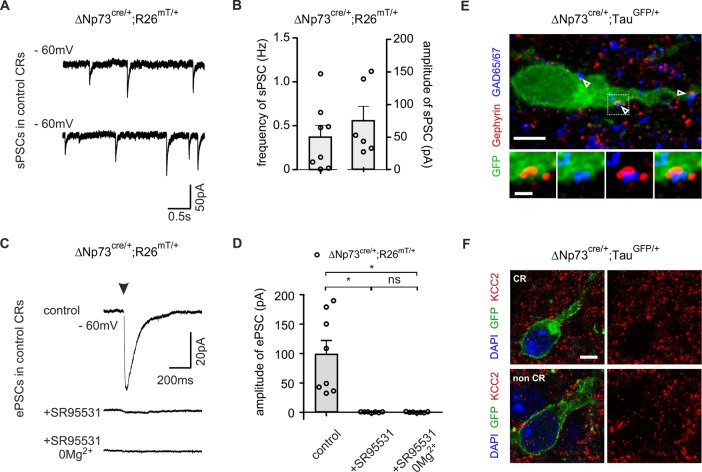
Figure 2—figure supplement 1—source data 1. Evoked and Spontaneous PSCs in rescued and developing CRs.