Abstract
Osteoporosis, low bone mass that increases fracture susceptibility, affects approximately 75 million individuals in the United States, Europe and Japan, with the number of osteoporotic fractures expected to increase by more than 3-fold over the next 50 years. Bone mass declines with age, although the mechanisms for this decrease are unclear. Aging enhances production of reactive oxygen species, which can affect bone formation and breakdown. The multiple sclerosis drug Tecfidera contains dimethylfumarate, which is rapidly metabolized to monomethylfumarate (MMF); MMF is thought to function through nuclear factor erythroid-derived-2-like-2 (Nrf2), a transcription factor activated by oxidative stress which induces the expression of endogenous anti-oxidant systems. We hypothesized that MMF-elicited increases in anti-oxidants would inhibit osteopenia induced by ovariectomy, as a model of aging-related osteoporosis and high oxidative stress. We demonstrated that MMF activated Nrf2 and induced anti-oxidant Nrf2 target gene expression in bone marrow-derived mesenchymal stem cells. Sham-operated or ovariectomized adult female mice were fed chow with or without MMF and various parameters monitored. Ovariectomy produced the expected effects, decreasing bone mineral density and increasing body weight, fat mass, bone marrow adiposity and serum receptor activator of nuclear factor-kappa-B ligand (RANKL) levels. MMF decreased fat but not lean mass. MMF improved trabecular bone microarchitecture after adjustment for body weight, although the unadjusted data showed few differences; MMF also tended to increase adjusted cortical bone and to reduce bone marrow adiposity and serum RANKL levels. Because these results suggest the possibility that MMF might be beneficial for bone, further investigation seems warranted.
Keywords: Bone, Fat Mass, Mesenchymal stem cells, Monomethyfumarate, Ovariectomy
Introduction
Osteoporosis is a disease characterized by low bone mass and bone loss commonly associated with age. Bone loss results in reduced bone strength and increased fracture risk, which is a growing problem among elderly individuals. Elderly women in particular experience a dramatic increase in fracture risk following menopause. This increased postmenopausal fracture risk is thought to be due to the decrease in estrogen and estrogen-related hormones: estrogen regulates bone mass in both men and women by suppressing osteoclast function thus reducing bone resorption and bone turnover, and as women experience menopause, the estrogen deficiency that ensues leads to increased bone resorption and loss of bone strength (reviewed in (Manolagas 2010)). According to the World Health Organization, women over the age of 50 have a lifetime fracture risk of about 40%, which is approximately twice the risk of men (Organization 2003). Although only a minor proportion of fractures are fatal, in elderly patients the risk of mortality following a major fracture becomes significant. Even in younger individuals almost all fractures hinder quality of life and the performance of daily activities.
Age is a factor that correlates strongly with osteoporotic fractures, so as the worldwide population continues to age, fracture risk will increase proportionally. Reactive oxygen species (ROS) contribute to age-related bone loss that can predispose to fractures (Almeida, et al. 2007). Increased oxidative stress correlates with lower bone mineral density because ROS promote osteoclastic bone remodeling, leading to increased bone resorption and decreased bone mass (Basu, et al. 2001). In addition, excessive reactive oxygen species (ROS) inhibit osteoblastic differentiation from bone marrow-derived mesenchymal stem cells (BMMSCs) as well as their mineralization (e.g., (Bai, et al. 2004; Hamada, et al. 2009; Kim, et al. 2010)). Moreover, differentiation of these cells results in their increased use of oxidative phosphorylation for ATP production, a change in cell metabolism that would be expected to enhance the generation of ROS (Guntur, et al. 2014). In an effort to minimize aging-related changes due to ROS, researchers are examining the effects of various endogenous antioxidant systems up-regulated by activation of nuclear factor erythroid 2-related factor (Nrf2), which is known to induce the expression of various endogenous antioxidant pathways (de Figueiredo, et al. 2015). Nrf2 binds to antioxidant response elements (ARE) leading to the up-regulation of antioxidant genes such as heme oxygenase 1 (HO-1), NAD(P)H quinone dehydrogenase 1 (NQO1), glutamate-cysteine ligase catalytic subunit (GCLC), glutathione S-transferase alpha 3 (GSTA3), and peroxiredoxin-6 (PRDX6) (Pellegrini, et al. 2017). Such genes are involved in neutralizing ROS and decreasing the effect that oxidative stress has on tissue aging. By activating endogenous pathways, the body should be able to better regulate the production of these natural antioxidant systems to combat the effects of ROS, while preserving the known physiological functions of ROS (reviewed in (Fang 2011; Reczek and Chandel 2015; Roy, et al. 2017)). For example, oxidants are known to activate multiple transcription factors important in bone formation (Kanczler, et al. 1998). The importance of oxidants as signaling molecules suggests, therefore, that global inhibition of oxidation with antioxidant supplementation might inhibit bone formation and other cell processes. Indeed, dietary supplementation with pharmacological doses of some antioxidants actually increases all-cause mortality in several large population studies and related meta-analyses (e.g., (Bjelakovic, et al. 2007; Miller, et al. 2005)). On the other hand, upregulating endogenous antioxidant systems that can be fine-tuned by the cell should allow the beneficial effects of inhibiting excess oxidative stress without the negative effects of reducing ROS required for normal cell functions.
Nrf2 is transcriptionally inactive in the cytoplasm because Kelch-like protein Keap1 associates with Nrf2 and suppresses its effects (Ma 2013). Nrf2 becomes transcriptionally active when Keap1 becomes oxidized and dissociates from Nrf2 allowing translocation of this transcription factor to the nucleus. When Nrf2 is localized to the nucleus, the antioxidant pathway is activated and cytoprotective proteins are up-regulated. Few studies have investigated the role of Nrf2 in bone function in vivo, with those that have been performed examining the effect of global loss of Nrf2 on bone parameters. In these studies ablation of Nrf2 in Nrf2 knockout mice resulted in reduced bone mass and decreased load-driven anabolic responses (Ibanez, et al. 2014; Pellegrini et al. 2017; Sun, et al. 2015). Thus, evidence points to Nrf2 deficiency resulting in increased osteoclast activity and decreased osteoblast differentiation and mineralization. These results are consistent with the idea that unopposed and excessive oxidative stress exerts negative effects on bone. Nevertheless, to date few studies have examined the impact of inducing/upregulating Nrf2 on bone biology. A previous study involving a Nrf2-activator, sulforaphane, a compound found in cruciferous vegetables, demonstrated that this agent increased osteoblast activity and decreased osteoclast bone resorption in vivo (Thaler, et al. 2016).
Recently, monomethyl fumarate (MMF) was also demonstrated to activate Nrf2 in multiple cell types (Ahuja, et al. 2016; Brennan, et al. 2017; Helwa, et al. 2017; Promsote, et al. 2014). MMF is rapidly formed from dimethylfumarate in the psoriasis treatment Fumaderm® (which also contains monoethylfumarate), as well as the Food and Drug Administration-approved drug for multiple sclerosis, Tecfidera®; these drugs are known to effectively reduce the symptoms associated with both diseases. We hypothesized that MMF could also potentially affect the bone by activating the Nrf2 pathway to lead to a reduction in ROS generation and maintained bone mass. This minimization of ROS would decrease oxidative stress, and the increase in the function of osteoclasts associated with oxidative stress would be prevented, leading to reduced bone loss. To assess the effect of MMF on bone and mesenchymal stem cells, in vitro and in vivo experiments were performed. In vitro, BMMSCs derived from 18-month-old C57BL/6 mice were treated with different concentrations of MMF in order to determine the effect that the drug has on the production of cytoprotective genes and proteins. In vivo, female C57BL/6 mice were subjected to ovariectomy to increase reactive oxygen species generation to mimic the aging process and simulate menopause (Almeida et al. 2007); the mice were then fed a diet containing MMF in order to determine if the MMF could protect from the reduced bone mass associated with a decrease in estrogen.
Methods
IN VITRO
Cells and Experimental Design.
Bone marrow mesenchymal stem cells (BMMSCs) derived from 18-month-old male C57BL/6J mice were used. These cells were purified by positive and negative selection and validated as to their ability to proliferate and retention of mesenchymal stem cell characteristics including multipotency, i.e., their ability to differentiate into osteoblasts, myocytes and adipocytes (Zhang, et al. 2008). BMMSCs were cultured in DMEM + 10% fetal bovine serum + 1% penicillin-streptomycin as described previously (Bollag, et al. 2017). Cells were transferred to a six-well plate and after two days were treated with either the control medium or medium containing 100 or 200 μM MMF. After 24 hours RNA and protein were harvested from each well and analyzed by qRT-PCR and Western blot, respectively.
qRT-PCR.
RNA was isolated using the PureLink RNA Mini Kit (Invitrogen). The concentration of RNA in each of the samples was measured using NanoDrop technology and 1000 ng of RNA was reverse-transcribed to cDNA as described previously. qRT-PCR was performed using TaqMan probes for HO-1, PRDX6, GCLC, GSTA3, NQO1, and the housekeeping gene GAPDH as previously described (Helwa et al. 2017).
Western Blot.
Protein was isolated from the BMMSCs treated with control medium, 100 μM MMF, or 200 μM MMF. Equal amounts of protein (80 μg), determined using a Bradford assay were subjected to SDS-PAGE before being transferred to a PVDF membrane. The membranes were incubated with anti-rabbit HO-1 primary antibody (obtained from Cell Signaling) overnight (dilution 1:500), washed with Tris-buffered saline containing Tween-20 (TBST), and then the Alexafluor-coupled anti-rabbit secondary antibody was added (dilution 1:10,000). β-actin (dilution 1:10,000) was monitored as the loading control.
Immunocytochemistry.
BMMSC cells were plated on cover slips in a twelve-well plate and treated for 24 hours with control medium, 100 μM MMF, or 200 μM MMF. After 24 hours, the cells were fixed in 4% paraformaldehyde and stored in 1X PBS + 0.05% sodium azide at 4°C until staining. The primary antibody recognizing Nrf2 (obtained from Cell Signaling; dilution 1:100), and the secondary antibody GAR Cy3 (dilution 1:400) was used for staining. Stained cells were visualized using confocal microscopy as previously described (Helwa et al. 2017).
IN VIVO
Animals and Experimental Design.
At 14 weeks of age, female C57BL/6J mice were randomly assigned either to sham-operation or ovariectomy (OVX). The mice were separated into four groups: sham-operated on a standard chow diet (n=9), sham-operated on a standard chow diet + 500 ppm MMF (n=9), OVX on a standard chow diet (n=9), and OVX on a standard chow diet + 500 ppm MMF (n=8). The amount of MMF to add to the diet was calculated based on the following considerations: a starting dose of Tecfidera® is 240 mg/day and a maintenance dose is 480 mg/day; assuming an average patient body weight of 60 kg, this quantity represents about a 4–8 mg/kg/day dose in humans. Based on Nair and Jacob (Nair and Jacob 2016), an equivalent mouse dose would be 12.3 times this value or roughly 49.2–98.4 mg/kg/day. Therefore, to receive a comparable dose to humans, a 25 g mouse would need to ingest 1.23–2.46 mg/day. The diet contained 500 ppm MMF, or 500 mg MMF/kg chow, which if consumed according to data in (Bachmanov, et al. 2002) (roughly 4 g/mouse/day for 9- to 11-week-old male C57BL/6 mice) would result in consumption of 2.0 mg/mouse/day.
The mice were fed their specified diet ad libitum for four weeks in a facility maintained on a 12-hour light/dark cycle. Body weight was measured and recorded before surgery and every two weeks after. Following four weeks on their respective diets, the mice were euthanized using CO2 and their uterus, femora and tibiae were harvested for further analysis. The animal protocol was approved by the Institutional Animal Care and Use Committee at Augusta University.
Surgical Procedure.
Mice were subjected to surgeries as previously described (Bollag, et al. 2018). Briefly, the mice in the OVX groups underwent the surgical removal of the ovaries to simulate post-menopausal reduction in estrogen. The mice were anesthetized using ketamine/xylazine. Ovaries were removed with double dorsolateral incisions and the incisions were closed with metal clips. The sham-operated mice underwent the same double dorsolateral incisions, but the ovaries were identified and left undisturbed.
DXA Analysis.
Immediately following euthanasia, the mice were analyzed by dual-energy X-ray absorptiometry (DXA) to measure BMD, BMC, lean tissue, fat percent, vertebral BMD, and femoral BMD (PIXImus system; GE LUNAR, Madison, WI).
μCT Analysis.
Isolated femora were scanned using an in vitro micro-CT device (Skyscan 1272, Bruker micro-CT) with scanning parameters of: source voltage = 70 kV, source current = 142 µA, exposure = 897 ms/frame, with an average of 3 frames per projection, rotation step (deg) = 0.400 and a 0.5 mm aluminum filter. The specimens were scanned at high resolution (1500 × 1500 pixels) with an isotropic nominal voxel size of 9.2 μm (778.7 µm3). Reconstructions for X-ray projections and re-alignment were performed using the Bruker micro-CT Skyscan software (NRecon, and DataViewer) (v. 1.7.3.1, Brüker micro-CT, Kontich, Belgium). Ring artefact and beam hardening corrections were applied in reconstruction. Datasets were loaded into SkyScan CT-Analyzer software for measurement of BMD. Calibration was performed with 0.25- and 0.75-mg/mL hydroxyapatite mouse phantoms provided by SkyScan. For cancellous bone analysis, the scanning regions were confined to the distal femoral metaphysis, with 100 slices obtained starting at 0.5 mm proximally from the proximal tip of the primary spongiosa. For cortical bone analysis, the region of interest was confined to the mid-shaft beginning 4.5 mm proximally from the center of intercondylar fossa. Bone properties were calculated from the microCT datasets using the manufacturer’s software, and were analyzed both as originally calculated and also after adjustment based on body mass, to negate any potential influence of increased body weight on metrics of bone architecture.
Analysis of Bone Marrow Adiposity.
Bone marrow adiposity was determined as previously described (Refaey, et al. 2017). Briefly, tibiae were decalcified in 15% EDTA, embedded in paraffin and sectioned for histology (5 microns thick). One slide per mouse was stained with hematoxylin and eosin (H&E) for visualization of adipocyte ghosts in the marrow cavity. Adipocyte area fraction normalized to marrow area (Ad.Ar/M.Ar, in %) and adipocyte spatial density in the bone marrow (N.Ad/M.Ar, in number/mm2) were quantified in the proximal tibial metaphysis with a 10x objective and image analysis software (Bioquant Osteo, Nashville TN).
ELISA.
An enzyme-linked immunosorbent assays were performed on serum collected from each mouse after sacrifice to measure the concentration of receptor activator of nuclear factor kappa-B ligand (RANKL), a ligand involved in osteoclastogenesis, osteoprotegerin (OPG), an inhibitor of RANKL action and pyridinoline crosslinks (PYD), a marker of bone breakdown, according to the supplier’s instructions. RANKL and OPG ELISA kits were purchased from R&D Systems (Minneapolis, MN) and the PYD ELISA kit from Quidel Corp. (San Diego, CA).
Statistics.
A rank transformation was used prior to analysis to stabilize the within group variance and minimize the effect of outlying observations for all parameters. A two-way ANOVA was used to test for differences among the sham-OVX groups on the two diets (Normal-Sham, Normal-OVX, MMF diet-Sham, MMF diet-OVX). None of the parameters measured showed a statistically significant interaction; therefore, interaction p values are not reported. Statistical significance was determined at alpha=0.05, and SAS 9.4 (SAS Institute, Inc., Cary, NC) was used for all analyses. Please note that similar results were obtained when the data for each parameter were statistically analyzed after omitting one animal from each of the OVX groups (control and MMF), which exhibited a minimal change in uterine weight after surgery (indicating a potentially unsuccessful OVX).
Results
IN VITRO
MMF activates Nrf2.
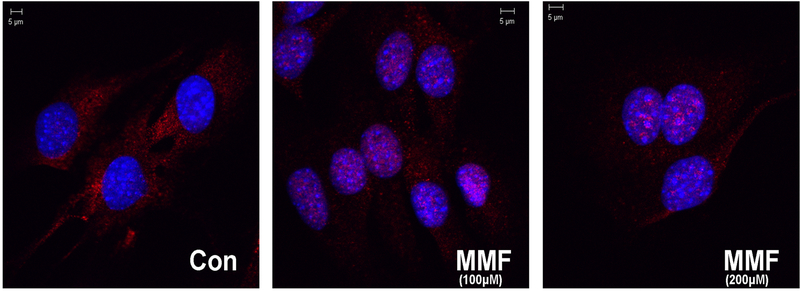
MMF has been shown to activate Nrf2 in a variety of cells systems (Ahuja et al. 2016; Brennan et al. 2017; Helwa et al. 2017; Promsote et al. 2014). In order to determine whether MMF induced Nrf2 activation also in BMMSCs, immunocytochemistry was performed on cells treated with MMF to monitor MMF-elicited Nrf2 nuclear translocation, a marker of Nrf2 activation. Figure 1 shows the localization of the Nrf2 protein (red staining) in control cells and in cells treated with MMF. In the control medium cells showed primarily cytoplasmic localization of Nrf2. Upon treatment with MMF, the nucleus transitions from a blue color (DNA staining by DAPI) to a purple color indicating that the Nrf2 localized to the nucleus. The localization of Nrf2 to the nucleus indicates that the protein becomes transcriptionally active, which in turn may induce the expression of antioxidant pathway genes to upregulate cytoprotective enzymes and protect against oxidative stress.
Figure 1: MMF activates Nrf2 as indicated by its nuclear translocation.
Fixed, permeabilized BMMSCs cultured on coverslips were exposed to Nrf2 primary antibody (dilution 1:100) for 2 hours and then to the secondary antibody goat anti-rabbit Cy3-conjugated antibody for an hour (dilution 1:400). Coverslips were mounted and the cells were examined using a confocal microscope. The cells treated with the control medium had consistently more Nrf2 in the cytoplasm (visualized as red) whereas cells treated with MMF had the Nrf2 protein localized to the nucleus (stained blue with DAPI). Thus, MMF activates Nrf2 and targets it to the nucleus.
MMF induces the mRNA expression of Nrf2 target genes.
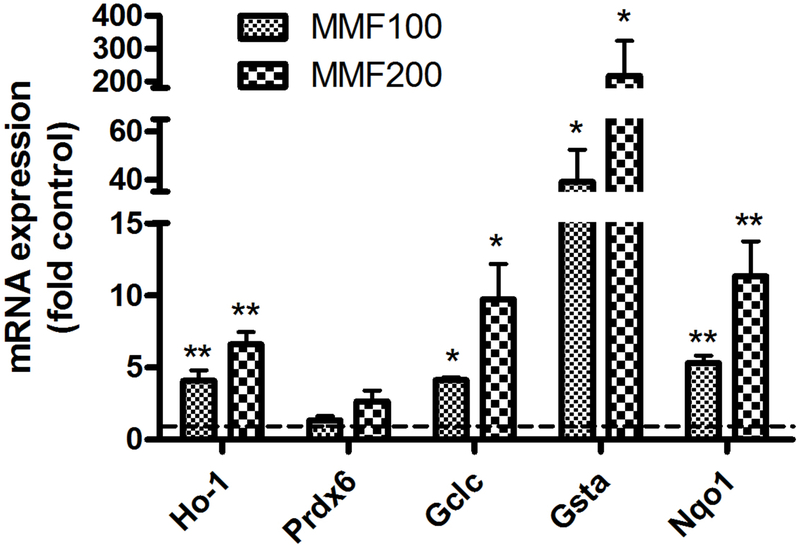
To determine if the observed nuclear translocation of Nrf2 results in increased expression of Nrf2 target genes, we measured mRNA levels of these genes, by quantitative RT-PCR. MMF dose dependently stimulated the expression of the Nrf2 target genes, glutamate-cysteine ligase catalytic subunit (GCLC, the first rate-limiting enzyme of glutathione synthesis), glutathione S-transferase alpha1 (GSTA), heme oxygenase-1 (HO-1), and NAD(P)H quinone dehydrogenase 1 (NQO1) (Figure 2). Although MMF tended to increase peroxiredoxin-6 (Prdx6) also, the data did not quite achieve statistical significance.
Figure 2: MMF induces the expression of Nrf2 target genes.
BMMSCs were incubated for 24 hours with medium containing no addition (control), 100 µM or 200 µM MMF. RNA was isolated and analyzed by quantitative RT-PCR using the ΔΔCt method with GAPDH as the housekeeping gene as described in Methods. ΔCt values were analyzed by one sample t-tests using Prism software with *p<0.05, **p<0.01 versus the control value of 1.0 and are expressed as the -fold control (i.e., using the ΔΔCt).
MMF induces the protein expression of a Nrf2 target gene.
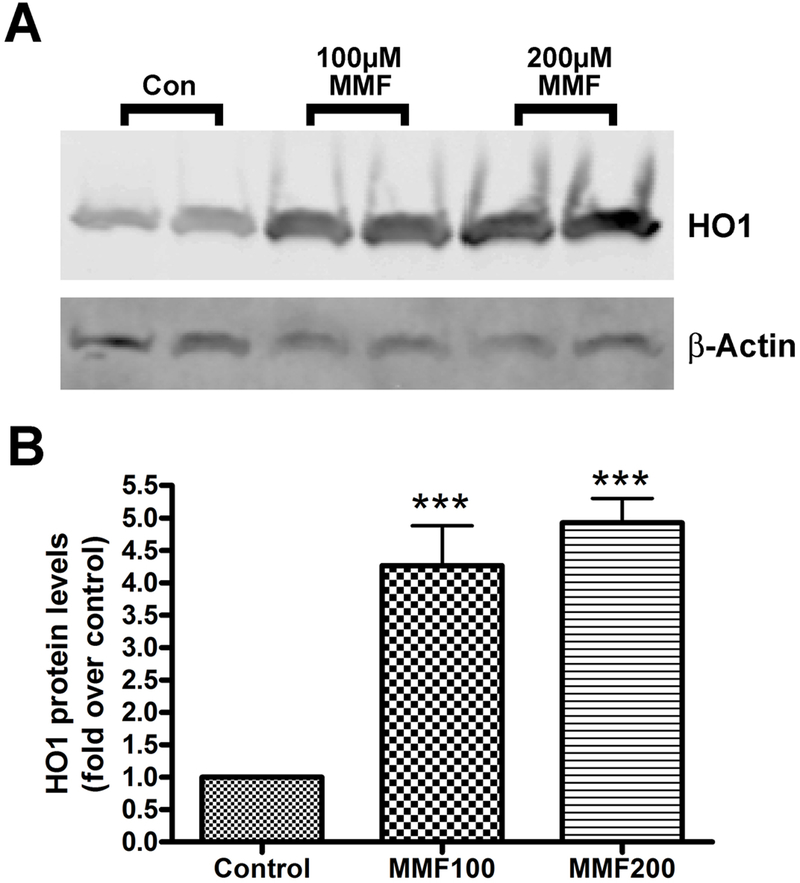
To determine if the increased mRNA levels were translated into protein, we focused on HO-1, because of the reported significance of its expression in muscle for cardioprotection (Hinkel, et al. 2015; Koleini, et al. 2017; Vecsernyes, et al. 2017). Western blots were performed on protein samples from four separate experiments. Each trial showed the same increase in HO-1 concentration with MMF treatment (Figure 3). The cells treated with MMF produced more HO-1 protein in response to the treatment. This increase is likely due to the increase in activation of Nrf2 by MMF. The Western blot data show quantitatively the increase in activity of genes associated with antioxidant pathways. The increase in expression of the HO-1 protein corresponds to the addition of MMF to the sample indicating that MMF induces the expression of genes that produce the antioxidant enzyme HO-1.
Figure 3: MMF increased HO-1 protein levels in BMMSCs.
(A) BMMSCs were incubated for 24 hours with medium containing no addition (control), 100 µM or 200 µM MMF. Protein was collected for Western analysis: separation of equal protein amounts was followed by transfer to PVDF and visualization with an antibody recognizing HO-1 (approximately 32 kDa). As evident by the representative experiment shown, MMF increases the amount of HO-1 protein in the cells relative to the control medium. β-actin served as the loading control. (B) Cumulative results from 3 separate experiments were quantified and expressed as means ± SEM. A significant difference (p <0.001) exists between the HO-1 protein levels after incubation with the control medium versus the medium containing either 100 µM or 200 µM MMF.
IN VIVO
OVX induces an increase in body weight and a decrease in uterine weight:
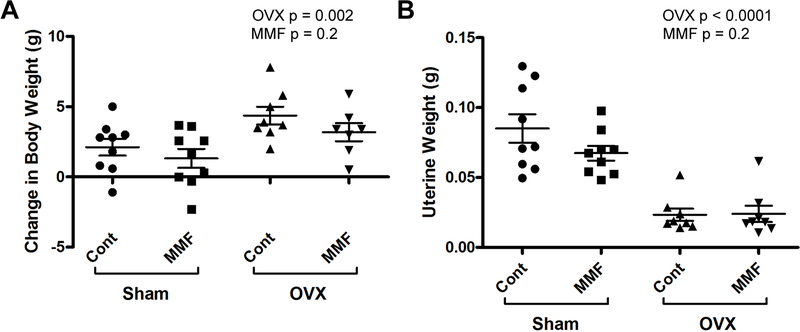
Mice were subjected to OVX or sham surgery and were then fed with chow with or without 500 ppm MMF. To examine the effect of the surgical manipulation on body mass, the weight of each mouse was recorded immediately following the surgical procedure, two weeks after the procedure, and immediately after sacrifice. Change in weight is depicted in Figure 4A. The ovariectomized mice had higher final body weights than the sham mice, as OVX mimics the excess fat storage that is seen following the post-menopausal decrease in estrogen (Beranger, et al. 2014; Iwaniec and Turner 2013). Further confirming the success of the OVX procedure, the OVX mice also showed a significant decrease in uterine weight relative to the sham-operated animals, with no differences observed in uterine weight between those ingesting chow either with or without MMF (Figure 4B).
Figure 4: OVX induced changes in body weight and uterine weight of mice in each experimental group.
(A) Mice were weighed before surgery and at sacrifice and the change in weight determined. The weight of the mice receiving OVX increased in relation to Sham operated mice. (An increase is expected as the OVX mice as the estrogen deficiency leads to excess fat storage.) (B) After sacrifice, uteri were harvested, cleaned of excess tissue and weighed. As expected with removal of the ovaries, OVX led to a significant decrease in uterine weight in both OVX groups. Each mouse is presented as an individual symbol with the lines and error bars representing the means ± SD of the group.
DXA analysis indicates that MMF inhibited the OVX-induced increase in fat mass and percentage without affecting lean mass.
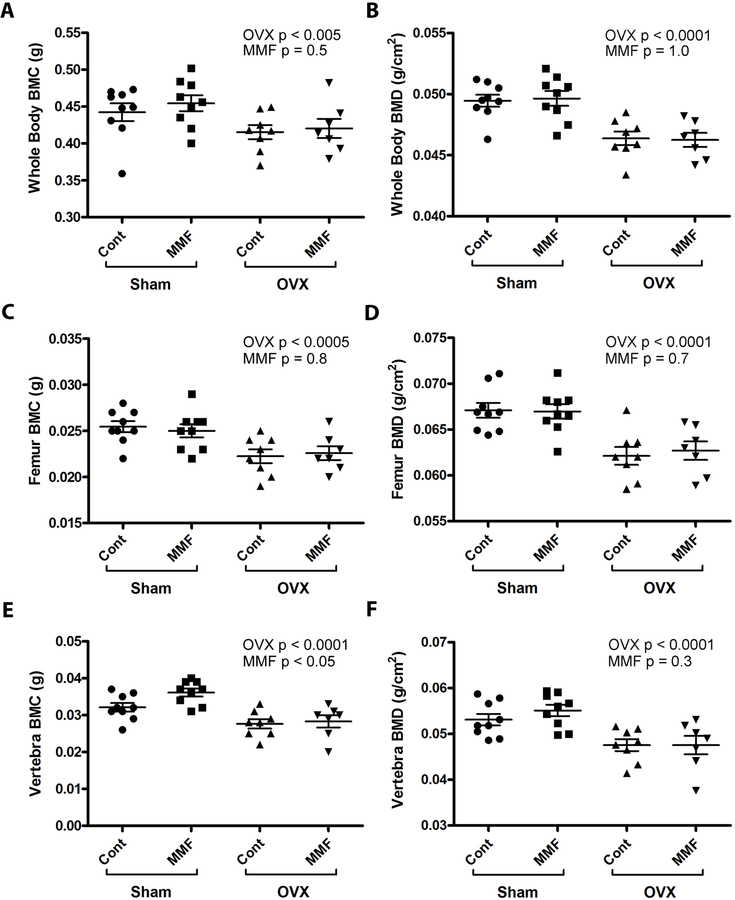
DXA scans were collected immediately following sacrifice and were used to analyze the body composition of the mice including percent fat, mass of fat tissue, mass of lean tissue, femoral BMD, vertebral BMD, whole-body BMC, and whole-body BMD. Figure 5A and B demonstrate that OVX resulted in an increased fat percentage and fat tissue mass; MMF reduced these values independent of OVX. However, neither OVX nor MMF altered lean tissue mass (Figure 5C). In terms of changes in bone parameters, the results showed that the OVX mice showed changes characteristic of estrogen deficiency from the removal of the ovaries: whole-body (Figure 6A and B), femoral (Figure 6C and D) and vertebral (Figure 6E and F) BMC and BMD values were lower in the OVX mice than in the sham-operated animals, indicating that the OVX surgeries were successful and the expected decrease in bone mass associated with estrogen deficiency was observed. However, there was no effect of MMF on this osteopenia (Figure 6).
Figure 5: MMF affected body composition.
(A) The effect of MMF on fat percentage was determined following DXA analysis. The scans showed that OVX significantly increased percent fat and that the mice fed a diet with MMF had a significantly lower percentage of fat than the mice on the control diet. (B) The effect of MMF on fat mass was monitored with DXA. The scans showed that OVX significantly increased the amount of fat tissue and that the mice fed a diet with MMF had a significantly lower mass of fat tissue than mice on the control diet. (C) The effect of MMF on lean mass was determined by DXA. No significant differences between any of the groups were observed. Each mouse is presented as an individual symbol with the lines and error bars representing the means ± SD of the group.
Figure 6. MMF had no effect on whole-body, femoral or vertebral BMD.
DXA analysis was performed as described in Methods and (A) whole-body BMC and (B) BMD, (C) femoral BMC and (D) BMD and (E) vertebral BMC and (F) BMD determined. The value for each mouse is shown as an individual symbol with the means ± SD illustrated as columns with error bars. The DXA scans showed a significant effect of OVX to decrease BMD and BMC at all sites on both diets. However, MMF had no effect on these parameters either in sham-operated or OVX animals except that there was a statistically significant effect of MMF on vertebral BMC only. Relative results for BMC at each site were similar (data not shown).
μCT Analysis Indicated that MMF Improved Trabecular Bone Microarchitecture with a Tendency to Also Increase Tissue Mineral Density in the Cortical Bone.
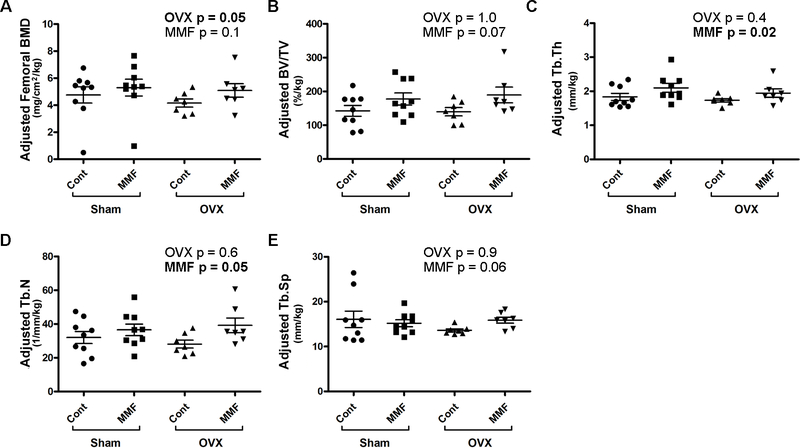
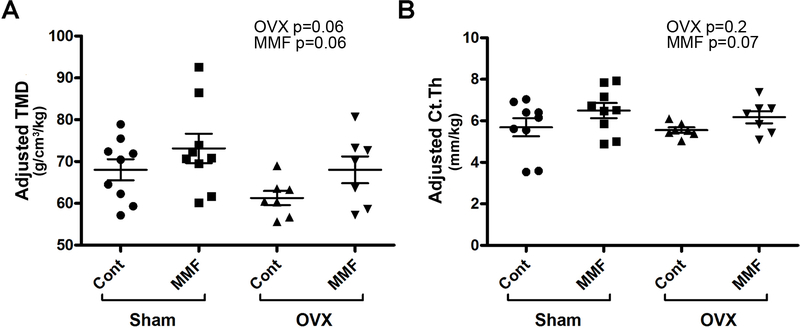
Bone parameters for trabecular bone (100 slices obtained starting 0.5 mm proximal tip of the primary spongiosa) and cortical bone (mid-shaft beginning 4.5 mm proximally from the center of the intercondylar fossa) were determined using µCT in the femora of the mice in each of the groups. We found no statistically significant differences in the femoral BMD, the trabecular bone volume fraction (BV/TV), trabecular thickness (Tb.Th) or trabecular number (Tb.N) (Supplemental Figure 1A–C). OVX significantly increased trabecular separation (Tb.Sp) but there was no effect of MMF (Supplemental Figure 1D). In cortical bone no effects of OVX were observed but MMF significantly increased the tissue bone mineral density (TMD, Supplemental Figure 2A), but not cortical thickness (Ct, Supplemental Figure 2B). Due to the adaptive nature of the bone skeleton, the observed significant change in body weight may have influenced bone geometry. Indeed, OVX significantly decreased femoral BMD (Figure 7A) when the µCT values were adjusted for body weight. Interestingly, MMF also increased weight-adjusted trabecular thickness and number (Figure 7C and D) and tended to increase femoral BMD, bone fraction and trabecular spacing (Figure 7A, B and E). MMF also tended to increase cortical tissue mineral density and cortical thickness upon adjustment of cortical bone parameters based on body weight (Figure 8A and B).
Figure 7. MMF improved trabecular bone microarchitecture.
After sacrifice femora were harvested and the trabecular bone analyzed by µCT as described in Methods. The trabecular bone parameters were adjusted based on body weight (in kg) of each mouse and are illustrated: (A) adjusted femoral BMD (in 100 slices 0.5 mm below the epiphyseal plate), (B) adjusted percentage of bone volume relative to total volume (%BV/TV), (C) adjusted trabecular thickness (Tb.Th), (D) adjusted trabecular number (Tb.N) and (E) adjusted trabecular spacing (Tb.Sp). Two-way ANOVA p values are shown with significant differences in bold. Each mouse is presented as an individual symbol with the lines and error bars representing the means ± SD of the group.
Figure 8. MMF tended to increase cortical bone tissue mineral density and thickness.
After sacrifice femora were harvested and the cortical bone analyzed by µCT as described in Methods. The cortical bone parameters were adjusted based on body weight (in kg) of each mouse and are illustrated: (A) adjusted tissue mineral density (TMD, determined in 100 slices above the distal femur region at 55% of total femur height) and (B) adjusted cortical cross-sectional thickness (Ct.Th). Each mouse is presented as an individual symbol with the lines and error bars representing the means ± SD of the group.
OVX Increased, and MMF Tended to Decrease, Bone Marrow Adiposity.
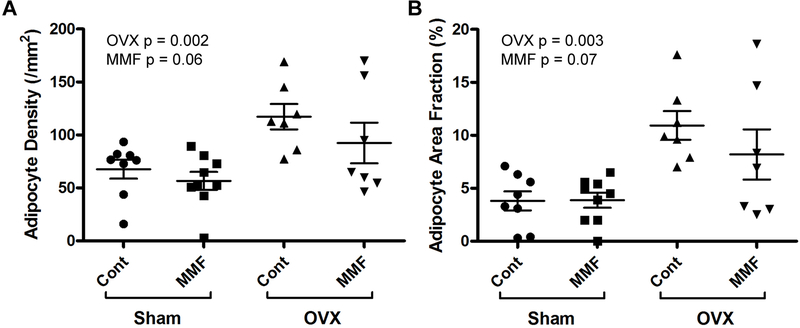
Bone marrow adiposity tends to increase with age and also following OVX (Iwaniec and Turner 2013). Consistent with these previous findings, we found that OVX increased both the adipocyte density and adipocyte fractional area in comparison with sham-operated animals independent of the diet (Figure 9). MMF tended to inhibit adipocyte density and fractional area, although the differences did not achieve statistical significance (p = 0.06 and 0.07, respectively).
Figure 9. MMF tended to prevent the OVX-induced increase in marrow adiposity.
After sacrifice tibiae were harvested, decalcified in EDTA and embedded in paraffin. Sections were stained and analyzed as described in Methods to determine (A) adipocyte density (in #/mm2) and (B) the fraction of the bone marrow area composed of adipocytes (adipocyte area fraction in %). OVX significantly increased bone marrow adiposity as shown by the increase in adipocyte density and area fraction, and MMF tended to inhibit this increase. Each mouse is presented as an individual symbol with the lines and error bars representing the means ± SD of the group.
ELISA.
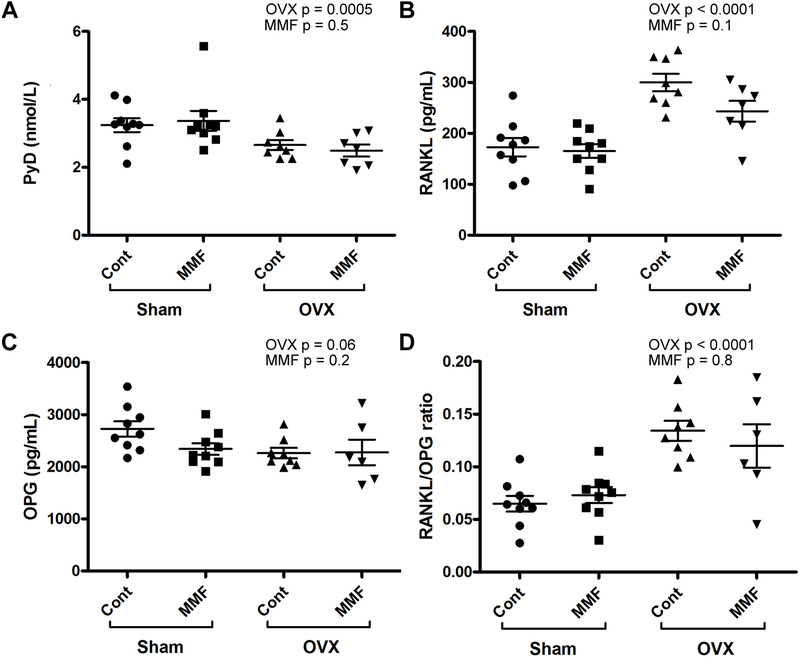
ELISAs were performed on the serum samples to determine the concentration of PYD, a marker of bone breakdown, RANKL, an activator of osteoclast function, OPG, a protein that binds RANKL and inhibits its function and the RANKL/OPG ratio. Figure 10A shows the effect of OVX and MMF on PYD: OVX significantly decreased serum PYD levels with no effect of MMF. In Figure 10B the effect of OVX and MMF on RANKL concentration was examined. OVX increased the concentration of RANKL consistent with the fact that osteoclastogenesis is known to be increased in mice with estrogen deficiency (Figure 10B). There was a trend for MMF to reduce serum RANKL levels but the difference did not achieve statistical significance. ELISA assays for OPG, a soluble inhibitor of RANKL function, indicated no significant differences among the groups, although OVX tended to decrease serum OPG levels. On the other hand, the RANKL/OPG ratios were significantly elevated with OVX, an effect that would also promote osteoclastogenesis, but there was no effect of MMF.
Figure 10. MMF tended to decrease the OVX-induced increase in serum RANKL concentration.
After sacrifice serum was collected and ELISA was performed to determine the serum levels of (A) PYD, (B) RANKL and (C) OPG as well as (D) the RANKL/OPG ratio. The PYD and OPG ELISAs showed no significant difference between the normal and MMF diet groups, or the sham surgery versus OVX groups, indicating that their concentrations were not greatly affected by the diet or surgical manipulation. For RANKL, OVX clearly elevated serum concentrations and MMF tended to prevent this increase. Each mouse is presented as an individual symbol with the lines and error bars representing the means ± SD of the group.
Discussion
Analysis of 18-mo BMMSCs treated with control medium or medium containing either 100 µM MMF or 200 µM MMF showed that MMF activated Nrf2 thereby eliciting responses associated with decreasing oxidative stress by inducing endogenous antioxidant systems. This effect was shown both by an ability of MMF to induce the expression of various known Nrf2 target genes and by its ability to elicit the nuclear translocation of Nrf2. Thus, immunocytochemical analysis demonstrated an observable difference in the localization of the Nrf2 protein in control cells and after treatment with MMF. In cells treated with the control medium, Nrf2 primarily resides in the cytoplasm, where it is transcriptionally inactive. Once the cells are treated with MMF, Nrf2 localizes to the nucleus (Figure 1) where it can function in activating antioxidant pathways to remove ROS and potentially reduce the effects of oxidative stress on bone loss. These concentrations are likely within the range of concentrations to which cells are exposed in vivo. Thus, after a single dose of 240 mg of fumaric acid esters in patients, the maximum serum concentration attained is 2.15 μg/ml or about 16.5 μM with a coefficient of variance of 44% (http://www.accessdata.fda.gov/drugsatfda_docs/nda/2013/204063Orig1s000ClinPharmR.pdf; accessed 1/29/19). However, the maintenance dose for Tecfidera is 480 mg/day and doses of Fumaderm as high as 1–2 g/day may be required to control psoriasis (Roll, et al. 2007). Since the maximum concentration of MMF is linearly related to fumaric acid ester dose (http://www.pharmacytimes.com/publications/issue/2013/June2013/Biogen-Idecs-Tecfidera; accessed 1/29/19) and if a similar coefficient of variance is assumed for the higher doses, the serum concentration of MMF may approach 200 μM in certain individuals. Nevertheless, it should be noted that patients are treated for their disease over an extended time period such that the cumulative effects of drugs might be greater than expected from a single short-term exposure. Since cells in vitro are only exposed acutely to treatment, a concentration of 100–200 μM to treat mouse BMMSCs in culture seems likely to mimic the concentrations experienced by the cells in vivo.
Quantitative RT-PCR demonstrated an ability of MMF to induce the expression of known Nrf2 target genes related to antioxidant systems. Thus, the mRNA levels of HO-1, GCLC, GSTA and NQO1 were all increased in response to MMF. GCLC and GSTA are involved in enhancing the levels and/or activity of the endogenous antioxidant glutathione in the cell, whereas NQO1 reduces quinones to hydroquinones to prevent the one electron reduction of quinones that results in the production of radicals. HO-1 catalyzes the degradation of heme to prevent heme-induced apoptosis and ROS generation. Western analysis demonstrated an increase in HO-1, a known antioxidant gene and protein with MMF treatment. Upregulation of HO-1 protein would result in an increased resistance to oxidative stress as the HO-1 protein targets ROS that otherwise could damage the cells. Nevertheless, upregulation of HO-1 would be beneficial to bone cells affected by ROS. If ROS play a role in osteoclast differentiation, minimizing the free oxygen radicals in the body could minimize osteoclastogenesis thereby inhibiting bone resorption. HO-1 is known to serve as an antioxidant gene that reduces ROS by degrading heme and might potentially minimize bone density loss in the case of diseases such as osteoporosis.
For the in vivo experiments mice were randomly assigned to one of four groups: sham-operated on a normal chow diet, sham-operated on a chow diet + 500 ppm MMF, OVX on a chow diet, or OVX on a chow diet + 500 ppm MMF. Four weeks following the surgery and ingestion of the assigned diet, the mice were sacrificed and their body composition was analyzed. OVX mice on the MMF diet had a lower fat mass than the OVX mice on the control diet (Figure 4). With estrogen deficiency induced by OVX, fat tissue is typically accumulated. Post-menopausal women also show this increase in fat with estrogen deficiency. Although OVX mice on the MMF diet showed slight increases in fat mass, these elevations were significantly less than those in the OVX mice fed the control diet. Thus, this finding implies that MMF might potentially be beneficial in minimizing fat gain associated with estrogen deficiency.
Although the initial hypothesis was that the MMF would upregulate antioxidant pathways to inhibit bone loss, the DXA analysis did not show any significant differences in bone mineral density related to diet. The lack of effect of MMF on BMD was somewhat surprising given the fact that the Nrf2 activator sulforaphane was previously found to increase anabolic bone parameters in mice (Thaler et al. 2016). However, in these studies sulforaphane was administered by intraperitoneal injection for 5 rather than 4 weeks (Thaler et al. 2016). It is possible (1) that a longer time period of treatment is needed to observe effects on BMD or (2) the concentration of MMF ingested by the mice was insufficient. Indeed, when we monitored the amount of chow consumed per mouse for four days following surgery, the number of grams ingested per mouse was less than was anticipated based on published information (Bachmanov et al. 2002) (1.9 ± 0.1 g/mouse; mean ± SEM based on cage data for 4 cages and 2 time periods over 4 days). Therefore, the expected dose of MMF may not have been achieved, and the experiment should likely be repeated for a longer period of time and/or at a higher concentration of MMF (or using MMF administration by oral gavage to ensure delivery of the desired dose).
Although OVX induced effects on bone, as indicated by the DXA analysis, MMF had few effects on these parameters. Thus, OVX significantly decreased whole body BMD, femur BMD and vertebral BMD but there was no observed effect of ingested MMF, except on vertebral BMC. On the other hand, OVX had minimal effects on the bone parameters measured by µCT, again except for femoral BMD, which was decreased by OVX when values were adjusted for the changes that occurred in body weight from experimental treatments. It should be noted that although there is a relationship between body weight and bone mass, this relationship is not uniform among skeletal sites and is unlikely to follow a direct 1:1 scaling relationship. In addition, bone length, an important determinant of bone mass, is unlikely to be altered by weight. For this reason we have elected to show both the unadjusted (Supplemental Figures 1 and 2) and adjusted (Figures 7 and 8) results. Nevertheless, it is perhaps a bit unexpected that most of the µCT parameters monitored were not altered by OVX given the changes in BMD observed; however, the C57BL/6 mouse has been shown previously to exhibit marginal (i.e., not significant) changes in many parameters measured by µCT after OVX, depending on the age, the bone site measured and the observation period post-OVX. Thus, Zhou et al. (Zhou, et al. 2018) demonstrated that in 24-week-old C57BL/6 analyzed 8 weeks post-OVX, the only femoral µCT parameters that are significantly different are volumetric BMD and Tb.Sp, but not BV/TV, Tb.N or Tb. Th (although younger 16- and 20-week-old mice do exhibit differences in some of these other bone parameters). Likewise, Klinck and Boyd (Klinck and Boyd 2008) reported no significant changes in femoral µCT parameters determined in 17-week-old C57BL/6J mice 5 weeks after surgery, consistent with our results. OVX also increased bone marrow adiposity while MMF tended to decrease this characteristic in terms of adipocyte density. On the other hand, when cortical bone was analyzed, it was found that MMF tended to increase adjusted tissue mineral density (in g/cm3/kg) whereas OVX had no effect. It is possible that our selection of microCT resolution (an isotropic nominal voxel size of 9.2 µm) might have been insufficient to properly demonstrate changes induced by OVX, although Christiansen has shown little difference in mouse vertebral bone parameters scanned using an isotropic nominal voxel size of 10 µm versus 6 µm (Christiansen 2016). On the other hand, it is possible that the few alterations in bone parameters observed with OVX could be due to relatively low bone mass in the control female mice. Indeed, Iwaniec et al. (Iwaniec, et al. 2016) have shown that C57BL/6J female mice lose cancellous bone mass between 4 and 18 weeks of age when housed at room temperature (18–23°C) in comparison to a thermoneutral temperature of 32°C. Nevertheless, MMF induced improvements in weight-adjusted µCT parameters, significantly increasing trabecular thickness and number and tending to increase femoral BMD, BV/TV and trabecular spacing. Therefore, future experiments, possibly with longer exposures to MMF and/or more controlled dosing, seem warranted to investigate this potentially important finding.
Overall, our results suggested that MMF could potentially be used as a drug to minimize bone loss as a promising alternative to oral antioxidants. MMF activates endogenous antoxidant pathways like HO-1 and Nrf2, which allow the body to modulate levels of ROS with innate gene regulation and protein localization. As ROS contribute greatly to the increased bone resorption and loss of bone strength, pathways activated by MMF to reduce the amount of ROS in the body could reduce the effects of osteoporosis, especially in post-menopausal women. Also, because MMF is a drug in current use and approved by the Food and Drug Administration, the path forward for MMF as a way to treat osteoporosis would have fewer obstacles.
Supplementary Material
Acknowledgments
Funding
This work was supported by an Augusta University Intramural Grants Program Pilot Study Research Program to WBB and CMI and by the National Institutes of Health/National Institute of Aging [P01 AG036675 (to CMI)]. The contents of this article do not represent the views of the Department of Veterans Affairs or the United States Government.
Footnotes
Declaration of Interest
The authors declare that there are no conflicts of interest regarding the publication of this paper.
References
- Ahuja M, Ammal Kaidery N, Yang L, Calingasan N, Smirnova N, Gaisin A, Gaisina IN, Gazaryan I, Hushpulian DM, Kaddour-Djebbar I, et al. 2016. Distinct Nrf2 Signaling Mechanisms of Fumaric Acid Esters and Their Role in Neuroprotection against 1-Methyl-4-Phenyl-1,2,3,6-Tetrahydropyridine-Induced Experimental Parkinson’s-Like Disease. J Neurosci 36 6332–6351. [DOI] [PMC free article] [PubMed] [Google Scholar]
- Almeida M, Han L, Martin-Millan M, Plotkin LI, Stewart SA, Roberson PK, Kousteni S, O’Brien CA, Bellido T, Parfitt AM, et al. 2007. Skeletal involution by age-associated oxidative stress and its acceleration by loss of sex steroids. J Biol Chem 282 27285–27297. [DOI] [PMC free article] [PubMed] [Google Scholar]
- Bachmanov AA, Reed DR, Beauchamp GK & Tordoff MG 2002. Food intake, water intake, and drinking spout side preference of 28 mouse strains. Behav Genet 32 435–443. [DOI] [PMC free article] [PubMed] [Google Scholar]
- Bai XC, Lu D, Bai J, Zheng H, Ke ZY, Li XM & Luo SQ 2004. Oxidative stress inhibits osteoblastic differentiation of bone cells by ERK and NF-kappaB. Biochem Biophys Res Commun 314 197–207. [DOI] [PubMed] [Google Scholar]
- Basu S, Michaelsson K, Olofsson H, Johansson S & Melhus H 2001. Association between oxidative stress and bone mineral density. Biochem Biophys Res Commun 288 275–279. [DOI] [PubMed] [Google Scholar]
- Beranger GE, Pisani DF, Castel J, Djedaini M, Battaglia S, Amiaud J, Boukhechba F, Ailhaud G, Michiels JF, Heymann D, et al. 2014. Oxytocin reverses ovariectomy-induced osteopenia and body fat gain. Endocrinology 155 1340–1352. [DOI] [PubMed] [Google Scholar]
- Bjelakovic G, Nikolova D, Gluud LL, Simonetti RG & Gluud C 2007. Mortality in randomized trials of antioxidant supplements for primary and secondary prevention: systematic review and meta-analysis. JAMA 297 842–857. [DOI] [PubMed] [Google Scholar]
- Bollag WB, Choudhary V, Zhong Q, Ding KH, Xu J, Elsayed R, Yu K, Su Y, Bailey LJ, Shi XM, et al. 2017. Deletion of protein kinase D1 in osteoprogenitor cells results in decreased osteogenesis in vitro and reduced bone mineral density in vivo. Mol Cell Endocrinol 461 22–31. [DOI] [PMC free article] [PubMed] [Google Scholar]
- Bollag WB, Ding KH, Choudhary V, Xu J, Zhong Q, Elsayed R, Bailey LJ, Elsalanty M, Yu K, Johnson MH, et al. 2018. Protein kinase D1 conditional null mice show minimal bone loss following ovariectomy. Mol Cell Endocrinol 474 176–183. [DOI] [PMC free article] [PubMed] [Google Scholar]
- Brennan MS, Matos MF, Richter KE, Li B & Scannevin RH 2017. The NRF2 transcriptional target, OSGIN1, contributes to monomethyl fumarate-mediated cytoprotection in human astrocytes. Sci Rep 7 42054. [DOI] [PMC free article] [PubMed] [Google Scholar]
- Christiansen BA 2016. Effect of micro-computed tomography voxel size and segmentation method on trabecular bone microstructure measures in mice. Bone Rep 5 136–140. [DOI] [PMC free article] [PubMed] [Google Scholar]
- de Figueiredo SM, Binda NS, Nogueira-Machado JA, Vieira-Filho SA & Caligiorne RB 2015. The antioxidant properties of organosulfur compounds (sulforaphane). Recent Pat Endocr Metab Immune Drug Discov 9 24–39. [DOI] [PubMed] [Google Scholar]
- Fang FC 2011. Antimicrobial actions of reactive oxygen species. MBio 2. [DOI] [PMC free article] [PubMed] [Google Scholar]
- Guntur AR, Le PT, Farber CR & Rosen CJ 2014. Bioenergetics during calvarial osteoblast differentiation reflect strain differences in bone mass. Endocrinology 155 1589–1595. [DOI] [PMC free article] [PubMed] [Google Scholar]
- Hamada Y, Fujii H & Fukagawa M 2009. Role of oxidative stress in diabetic bone disorder. Bone 45 Suppl 1 S35–38. [DOI] [PubMed] [Google Scholar]
- Helwa I, Choudhary V, Chen X, Kaddour-Djebbar I & Bollag WB 2017. Anti-Psoriatic Drug Monomethylfumarate Increases Nuclear Factor Erythroid 2-Related Factor 2 Levels and Induces Aquaporin-3 mRNA and Protein Expression. J Pharmacol Exp Ther 362 243–253. [DOI] [PMC free article] [PubMed] [Google Scholar]
- Hinkel R, Lange P, Petersen B, Gottlieb E, Ng JK, Finger S, Horstkotte J, Lee S, Thormann M, Knorr M, et al. 2015. Heme Oxygenase-1 Gene Therapy Provides Cardioprotection Via Control of Post-Ischemic Inflammation: An Experimental Study in a Pre-Clinical Pig Model. J Am Coll Cardiol 66 154–165. [DOI] [PubMed] [Google Scholar]
- Ibanez L, Ferrandiz ML, Brines R, Guede D, Cuadrado A & Alcaraz MJ 2014. Effects of Nrf2 deficiency on bone microarchitecture in an experimental model of osteoporosis. Oxid Med Cell Longev 2014 726590. [DOI] [PMC free article] [PubMed] [Google Scholar]
- Iwaniec UT, Philbrick KA, Wong CP, Gordon JL, Kahler-Quesada AM, Olson DA, Branscum AJ, Sargent JL, DeMambro VE, Rosen CJ, et al. 2016. Room temperature housing results in premature cancellous bone loss in growing female mice: implications for the mouse as a preclinical model for age-related bone loss. Osteoporos Int 27 3091–3101. [DOI] [PMC free article] [PubMed] [Google Scholar]
- Iwaniec UT & Turner RT 2013. Failure to generate bone marrow adipocytes does not protect mice from ovariectomy-induced osteopenia. Bone 53 145–153. [DOI] [PMC free article] [PubMed] [Google Scholar]
- Kanczler JM, Sahinoglu T, Stevens CR & Blake DR 1998. The complex influences of reactive oxgen species on rheumatoid erosions and synovitis. In Nitric Oxide in Bone and Joint Disease, pp 81–94. Eds Hukkanen VJ, Polak JM & Hughes SPF. Cambridge, UK: Cambridge University Press. [Google Scholar]
- Kim WK, Meliton V, Bourquard N, Hahn TJ & Parhami F 2010. Hedgehog signaling and osteogenic differentiation in multipotent bone marrow stromal cells are inhibited by oxidative stress. J Cell Biochem 111 1199–1209. [DOI] [PubMed] [Google Scholar]
- Klinck J & Boyd SK 2008. The magnitude and rate of bone loss in ovariectomized mice differs among inbred strains as determined by longitudinal in vivo micro-computed tomography. Calcif Tissue Int 83 70–79. [DOI] [PubMed] [Google Scholar]
- Koleini N, Nickel BE, Wang J, Roveimiab Z, Fandrich RR, Kirshenbaum LA, Cattini PA & Kardami E 2017. Fibroblast growth factor-2-mediated protection of cardiomyocytes from the toxic effects of doxorubicin requires the mTOR/Nrf-2/HO-1 pathway. Oncotarget 8 87415–87430. [DOI] [PMC free article] [PubMed] [Google Scholar]
- Ma Q 2013. Role of nrf2 in oxidative stress and toxicity. Annu Rev Pharmacol Toxicol 53 401–426. [DOI] [PMC free article] [PubMed] [Google Scholar]
- Manolagas SC 2010. From estrogen-centric to aging and oxidative stress: a revised perspective of the pathogenesis of osteoporosis. Endocr Rev 31 266–300. [DOI] [PMC free article] [PubMed] [Google Scholar]
- Miller ER 3rd, Pastor-Barriuso R, Dalal D, Riemersma RA, Appel LJ & Guallar E 2005. Meta-analysis: high-dosage vitamin E supplementation may increase all-cause mortality. Ann Intern Med 142 37–46. [DOI] [PubMed] [Google Scholar]
- Nair AB & Jacob S 2016. A simple practice guide for dose conversion between animals and human. J Basic Clin Pharm 7 27–31. [DOI] [PMC free article] [PubMed] [Google Scholar]
- Organization WH 2003. Prevention and Management of Osteoporosis World Health Organ Tech Rep Ser 921. [PubMed] [Google Scholar]
- Pellegrini GG, Cregor M, McAndrews K, Morales CC, McCabe LD, McCabe GP, Peacock M, Burr D, Weaver C & Bellido T 2017. Nrf2 regulates mass accrual and the antioxidant endogenous response in bone differently depending on the sex and age. PLoS One 12 e0171161. [DOI] [PMC free article] [PubMed] [Google Scholar]
- Promsote W, Makala L, Li B, Smith SB, Singh N, Ganapathy V, Pace BS & Martin PM 2014. Monomethylfumarate induces gamma-globin expression and fetal hemoglobin production in cultured human retinal pigment epithelial (RPE) and erythroid cells, and in intact retina. Invest Ophthalmol Vis Sci 55 5382–5393. [DOI] [PMC free article] [PubMed] [Google Scholar]
- Reczek CR & Chandel NS 2015. ROS-dependent signal transduction. Curr Opin Cell Biol 33 8–13. [DOI] [PMC free article] [PubMed] [Google Scholar]
- Refaey ME, McGee-Lawrence ME, Fulzele S, Kennedy EJ, Bollag WB, Elsalanty M, Zhong Q, Ding KH, Bendzunas NG, Shi XM, et al. 2017. Kynurenine, a Tryptophan Metabolite That Accumulates With Age, Induces Bone Loss. J Bone Miner Res [DOI] [PMC free article] [PubMed]
- Roll A, Reich K & Böer A 2007. Use of fumaric acid esters in psoriasis. Indian J Dermatol Venereol Leprol 73 133–137. [DOI] [PubMed] [Google Scholar]
- Roy J, Galano JM, Durand T, Le Guennec JY & Lee JC 2017. Physiological role of reactive oxygen species as promoters of natural defenses. FASEB J [DOI] [PubMed]
- Sun YX, Li L, Corry KA, Zhang P, Yang Y, Himes E, Mihuti CL, Nelson C, Dai G & Li J 2015. Deletion of Nrf2 reduces skeletal mechanical properties and decreases load-driven bone formation. Bone 74 1–9. [DOI] [PubMed] [Google Scholar]
- Thaler R, Maurizi A, Roschger P, Sturmlechner I, Khani F, Spitzer S, Rumpler M, Zwerina J, Karlic H, Dudakovic A, et al. 2016. Anabolic and Antiresorptive Modulation of Bone Homeostasis by the Epigenetic Modulator Sulforaphane, a Naturally Occurring Isothiocyanate. J Biol Chem 291 6754–6771. [DOI] [PMC free article] [PubMed] [Google Scholar]
- Vecsernyes M, Szokol M, Bombicz M, Priksz D, Gesztelyi R, Fulop GA, Varga B, Juhasz B, Haines D & Tosaki A 2017. Alpha-Melanocyte-stimulating Hormone Induces Vasodilation and Exerts Cardioprotection Through the Heme-Oxygenase Pathway in Rat Hearts. J Cardiovasc Pharmacol 69 286–297. [DOI] [PMC free article] [PubMed] [Google Scholar]
- Zhang W, Ou G, Hamrick M, Hill W, Borke J, Wenger K, Chutkan N, Yu J, Mi QS, Isales CM, et al. 2008. Age-related changes in the osteogenic differentiation potential of mouse bone marrow stromal cells. J Bone Miner Res 23 1118–1128. [DOI] [PMC free article] [PubMed] [Google Scholar]
- Zhou S, Wang G, Qiao L, Ge Q, Chen D, Xu Z, Shi D, Dai J, Qin J, Teng H, et al. 2018. Age-dependent variations of cancellous bone in response to ovariectomy in C57BL/6J mice. Exp Ther Med 15 3623–3632. [DOI] [PMC free article] [PubMed] [Google Scholar]
Associated Data
This section collects any data citations, data availability statements, or supplementary materials included in this article.


