Abstract
We report the effects of diffusion on fluorescence resonance energy transfer, as observed by using the frequency-domain technique. Energy transfer between indole (donor) and dansylamide (acceptor) was studied in low and high viscosity solutions. At the current level of resolution, the donor fluorescence decays were satisfactorily analyzed in terms of the theoretical function including translational diffusion proposed by Gosele et al. (Chem. Phys. Lett. 1975, 24, 519). The Forster equation, which does not consider diffusion, was found to significantly overestimate the critical transfer distance (R0) in fluid solutions and to provide an inadequate representation of the data. These results demonstrate the ability to determine mutual diffusion coefficients from the frequency response of the donor emission.
Registry No. Indole, 120-72-9; dansylamide, 1431-39-6
Introduction
The phenomenon of nonradiative resonance electronic energy transfer (RET) has been intensively studied theoretically and experimentally for several decades. Most of these investigations were performed by using steady-state measurements of fluorescence intensity or anisotropy in homogeneous systems. Such measurements have limited information due to averaging of the time-dependent processes, which are characteristic of diffusion-dependent energy transfer. Additionally, steady-state measurements require careful corrections for inner-filter effects, which are substantial at the high acceptor concentrations necessary for intermolecular energy transfer. Time-resolve fluorescence spectroscopy provide direct observation of the time-dependent decay, which are modified by the time-dependent rates of energy transfer.
Recently, several experimental studies of diffusion-dependent energy transfer were reported that used time-domain measurements.1–3 However, to our best knowledge, frequency-domain fluorometry has not yet been used for time-dependent energy-transfer measurements, except intramolecular energy transfer.4–7 Also, these studies4–7 did not consider the effect of diffusion on the energy-transfer process. High resolution of frequency-domain fluorometry has already been used in recovering distance distributions in macromolecules5–8 and transient effects in collisional quenching of fluorescence.9–11
To study diffusion-dependent energy transfer, we chose indole as a donor (D) and dansylamide as an acceptor (A). This D–A system is characterized by Forster distance R0 ≈ 25 Å and has been used in energy transfer studies of macromolecules.8,12 Furthermore, we chose to initially study intermolecular energy transfer in homogeneous solutions because of the availability of a theoretical foundation and analytical expression for this case.13,14 The measurements were performed in two solvents, in propylene glycol (high viscosity) and in methanol (low viscosity). The concentrations of acceptor were chosen to give approximately 50% quenching of the donor fluorescence.
Theory
There exist several theories describing intensity decay of a donor in the presence of energy transfer in homogeneous solution without15–17 and with diffusion,13–14,18 referring to only a few. We chose, in our opinion, the most appropriate and commonly used Forster theory,15 developed latter by Gosele et al.14 for the case when diffusion occurs.
Energy-Transfer Kinetics without Diffusion (Forster).
Assume the decay of the donor [ID(t)], in the absence of energy transfer, is a single exponential
| (1) |
where τD0 is the decay time of the donor in the absence of acceptor. In the presence of a random distributed acceptor, the donor fluorescence decays nonexponentially according to the relation
| (2) |
where γ = CA/CA0, CA is molar concentration of the acceptor, and CA0 is the molar critical concentration, given by
| (3) |
N is Avogadros number and R0 is the critical transfer distance given by Forster
| (4) |
where k2 is the orientation factor, ϕD0 the quantum yield of the donor in the absence of acceptor, n the refractive index, FD(λ) the emission spectrum of the donor with the area normalized to unity, EA(λ) the absorption spectrum of the acceptor in units of M−1 cm−1, and λ the wavelength in nm. If the molecular orientations are random due to Brownian rotation, then k2 = ⅔. In our analysis using the Forster equation (2), R0 will be the floating parameter. The influence of diffusion can be monitored in changes in the apparent value of R0.
Energy-Transfer Kinetics with Diffusion (Gosele et al.)
Yokota and Tanimoto13 used the Pade approximate method to evaluate an expression for Forster transfer in a fluid media. Gosele et al.14 pointed out that the equation of Yokota and Tanimoto overestimates the transfer rate in the longer time region and proposed an improved formulation
| (5) |
The parameter B is given by
| (6) |
Where
| (7) |
In our fitting analysis, D and/or R0 will be floating parameters.
Frequency-Domain Theory and Analysis.
We obtained the time-resolved information from the frequency response of the emission to amplitude-modulated light, which is characterized by the frequency (ω)-dependent values of the phase shift (ϕω) and the extent of demodulation (mω). The parameters describing the decay law are compared with the calculated (c) values (ϕcω and mcω). For any decay law these values are given by
| (8) |
| (9) |
Where
| (10) |
| (11) |
and ω is the modulation frequency in radian/s. The goodness-of-fit is characterized by
| (12) |
where ν is the number of degrees of freedom and δϕ and δm are the experimental uncertainties in ϕω and mω. We used values of 0.2° and 0.005, respectively, which were found to be appropriate for our instrument and measurement techniques. The parameters were determined by the method of non-linear least squares.19,20
For the t1/2-dependent decays (eqs 2 and 5) we used numerical integration to evaluate the sine and cosine transforms (eqs 10 and 11). In particular, we used an adaptive Newton–Cotes nine-point integration,21 with care to match the time range of integral to that of the intensity decay. It is important to use small time increments in the early portion of the decay because of the initial rapid decay due to the transient terms.
Materials and Method
Indole and dansylamide (Aldrich) were purified by HPLC just before the experiment. Values of R0 were calculated by using eq. 4. The quantum yields were obtained relative to tryptophan in water at 20 °C, using a value of 0.13,22 with appropriate corrections for the refractive index of water and the solvents (propylene glycol, methanol) and for the optical densities of the solutions. The quantum yields of indole at 20 °C were found to be 0.34 and 0.32 in propylene glycol and oxygen-free methanol, respectively. The R0 values are 24.3 Å in propylene glycol and 26.1 Å in methanol. The concentration of indole (donor) was about 10−4 M. The absorption spectra of the indole-dansylamide mixtures were the sum of that found for the individual chromophores, suggesting that the donor and acceptors were not interacting under our experimental conditions.
The fluorescence intensity and decay measurements were performed by using front-face geometry. Emission spectra were corrected for the inner filter effect. Frequency-domain measurements were performed by using the instrument described previously.23 The modulated excitation is provided by the harmonic content of a train of 7-ps pulses from a cavity-dumped rhodamine 6G dye laser, which was frequency doubled to 290 nm. The detector is a microchannel plate photomultiplier (Hamamatsu R1564U). The emission was observed through a 340-nm interference Filter, using magic angle polarizer conditions. For all analyses the uncertainties in the phase (δϕ) and the modulation (δm) measurements were taken 0.2° and 0.005, respectively. For the frequency-domain measurements the optical densities of the reference and sample cuvette were matched to equalize the optical path lengths.
Results
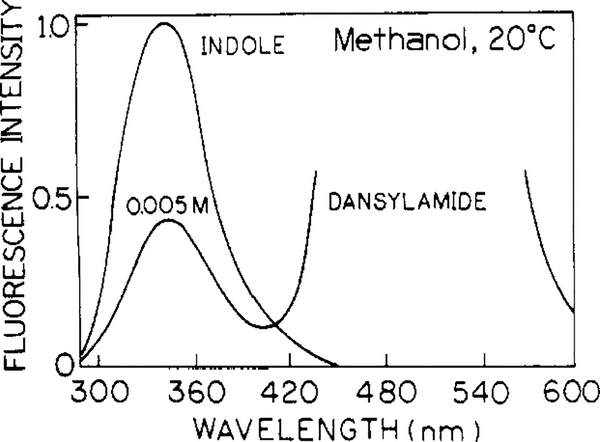
Emission spectra of indole in methanol at 20 °C in the absence and presence of dansylamide are shown in Figure 1. Fluorescence spectra of indole and dansylamide are well separated. A 340-nm interference filter was used to selectively observe only the indole fluorescence. Concentrations of dansylamide (acceptor) of 0.012 and 0.005 M in propylene glycol and methanol, respectively, resulted in about 50% quenching of indole fluorescence in each solvent. In the pure solvents without acceptor, indole displays dominantly a single-exponential fluorescence intensity decays with lifetimes 4.23 and 4.09 ns, in propylene glycol and methanol, respectively.
Figure 1.
Emission spectra of the donor indole in methanol without and with 0.005 M dansylamide, the acceptor.
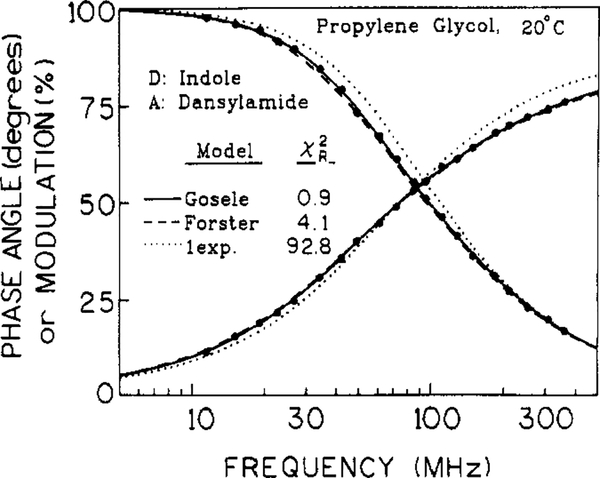
Frequency-domain data for the intensity decay of indole fluorescence in propylene glycol in the presence of 0.012 M dansylamide are shown in Figure 2. In the presence of randomly distributed acceptors, the decay became heterogeneous, compared to that found in the absence of acceptors (not shown), due to a range of D-to-A distances and a range of transfer rates. A single-exponential fit (⋯) is unacceptable, resulting in χR2 = 92.8. The Forster model (- - -) provides a 22-fold improvement in χR2 and the Gosele et al. model (- - -) gives additional 4-fold lower χR2
Figure 2.
Phase and modulation data for indole fluorescence decay in propylene glycol at 20 °C in the presence of 0.012 M dansylamide. The solid, dashed, and dotted lines are the best fits to the Gosele et al. (eqs 5 and 6), Forster (eq 2), and single-exponential (eq 1) models, respectively.
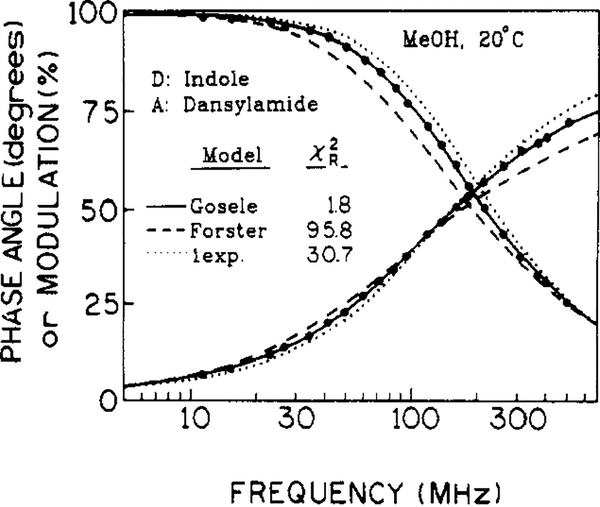
Frequency-domain data for the intensity decay of indole in methanol at 20 °C in the presence of 0.005 M dansylamide are shown in Figure 3. The single-exponential fit and the fit to the Forster equation (2) without diffusion, are unacceptable, resulting in χR2 = 30.7 and 95.5, respectively. In contrast, the data points are well matched by fit to the Gosele et al. model, resulting in χR2 = 1.8. The recovered parameters for energy transfer are presented in Table I. It should be noted that the effect of diffusion on energy transfer is to compress the donor-frequency response along the frequency axis (Figure 3), as compared to energy transfer without diffusion. That is, the frequency range from 10 to 80° of phase, or 90 to 10% modulation, is decreased by diffusion.
Figure 3.
Phase and modulation data for indole fluorescence decay in methanol at 20 °C in the presence of 0.005 M dansylamide. The solid, dashed, and dotted lines are the best fits to the Gosele et al. (eqs 5 and 6), Forster (eq 2), and single-exponential (eq 1) models, respectively.
TABLE I:
Indole Decay Times and D-to-A Diffusion Coefficients in Propylene Glycol and Methanol at 20 °C
| solvent | [A] | eq no. | τD, ns | R0, Å | 106D, cm2/s | χR2 |
|---|---|---|---|---|---|---|
| propylene glycol | 0 | 1 | 4.23 | 1.4 | ||
| 12 mM | 1 | 2.57 | 92.8 | |||
| 2 | 〈4.23〉 | 24.9 | 4.1 | |||
| 2 | 〈4.23〉 | 〈24.3〉a | 10.6 | |||
| 5 | 〈4.23〉 | 23.9 | 1.03 | 0.9 | ||
| 5 | 〈4.23〉 | 〈24.3〉 | 0.62 | 1.3 | ||
| methanol | 0 | 1 | 4.09 | 2.4 | ||
| 5 mM | 1 | 2.03 | 30.7 | |||
| 2 | 〈4.09〉 | 37.1 | 95.8 | |||
| 2 | 〈4.09〉 | 〈26.1〉 | 1152.1 | |||
| 5 | 〈4.09〉 | 27.8 | 26.4 | 1.8 | ||
| 5 | 〈4.09〉 | 〈26.1〉 | 34.0 | 3.1 |
〈 〉indicates that the parameter was held fixed during the analysis.
It is interesting to note that the Forester equation (2) provides a reasonable fit (χR2 = 4.1) in the high viscosity solvent but cannot account for the low viscosity data (χR2 = 95.8, Table I). This is because the effect of diffusion on the form of the intensity decay is to make it appear to be more like a single exponential, i.e., more compressed along the frequency axis in Figures 2 and 3. Consequently, eq 2 cannot account for the data, even though the apparent (recovered) value of R0 is increased to account for the enhanced extent of energy transfer due to translational diffusion.
The diffusion coefficients recovered from least-squares analysis with the Gosele model (eq 5) were 1.03 × 10⁻⁶ and 26.4 × l0−6 cm2/s, in propylene glycol and methanol, respectively. These are reasonable values for molecules like indole and dansylamide at these viscosities, 45 and 0.6 cP for propylene glycol and methanol, respectively. It is of interest to determine the uncertainty in the diffusion coefficients recovered from the data. This was accomplished by questioning the range of diffusion coefficients that are statistically consistent with the data. To provide the worse case analysis, we allowed R0 to be a variable, even though R0 is in fact known from the spectral data.
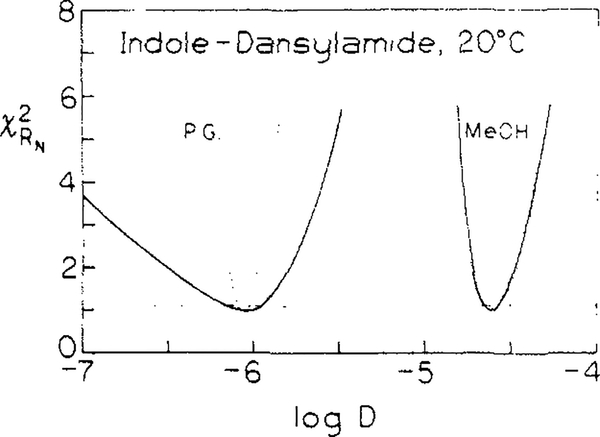
The uncertainties in the diffusion coefficients can be judged by examining the χR2 surfaces (Figure 4, —). These surfaces were calculated by holding the D fixed at the values indicated on the x axis and allowing R0 to vary so as to minimize χR2. These surfaces indicate that the diffusion coefficients are well determined from the data, even in the case of low diffusion (10−6 cm2/s) and assuming R0 is unknown. In propylene glycol, diffusion coefficients from 0.60 to 1.3 × 10⁻⁶ cm2/s are consistent with the data. The inability of changes in R0 to compensate for changes in the diffusion coefficient is probably because the shape of the frequency response, and not just its location along the frequency axis, is affected by changes in the diffusion coefficient.
Figure 4.
Dependence of χR2 on the diffusion coefficients recovered from Gosele et al. model. The dashed line indicate the highest values of χR2 consistent with random noise in 67% of repetitive measurements. The dotted lines show χR2 dependence on the diffusion coefficients if R0 are kept constant in analysis.
In the case of methanol, the χR2 surface is steeper, and D values can range only from 23.4 to 27.2 × 10⁻⁶ cm2/s. This relatively greater certainty of D is because of the increased contributions of diffusion to the transfer process in this low viscosity solvent. Of course, the Forster distance R0 is known from the optical properties of the chromophores. If R0 is held constant, then the values of D are determined with still greater certainty (Figure 4, ⋯)
It should be noted that it is possible to interpret the donor decay data in terms of distance distributions and that the effect of diffusion is to displace the apparent distribution toward the donor.24 However, this model does not provide a correct molecular description of the system, and the recovered distributions are only apparent distributions.
Discussion
In the presence of randomly distributed acceptors, the fluorescence decay of the donor becomes heterogeneous due to a range of D-to-A distances and rates of energy transfer. This is seen from the attempt to fit the data in Figure 2 to the single-exponential model. In propylene glycol, where the mean displacement of molecules during the fluorescence lifetime () is not significant, the difference between fits to Forster or Gosele et al. models is small. In contrast, in methanol (Figure 3) this difference becomes larger and the fit to the Forster model not acceptable. The Forster model provides a poor fit (χR2 = 95.8) and significantly overestimates critical transfer distance (R0 = 37.1 Å). The heterogeneity of the donor decay (given by χR2 obtained for single-exponential fit) in methanol is lower than that in propylene glycol (Table I) but in both solvents single-exponential fits are not acceptable.
In a fluid solutions the mean diffusion distance during the lifetime of the donor is given by
| (13) |
Diffusion coefficients may be estimated by the Stokes-Einstein relationship (right), where k is the Boltzmann constant, η the viscosity, and r the molecular radius. In the D–A system, D is the sum of the diffusion coefficients of the donor and acceptor (D = DA + DD). Calculated values for the indole–dansylamide system (using rD = rA = 4 Å) are approximately 2 and 20 Å in propylene glycol and methanol, respectively. These displacements are much smaller than the R0 value in propylene glycol and comparable to R0 in MeOH solutions. The present study has shown that even in solutions in which the diffusion lengths are considerably smaller than the critical transfer distance, frequency-domain measurements provide data for a precise analysis of the energy-transfer kinetics in solution (see Figure 4). The estimated values of D (Table I) are reasonable. It should also be noted that the R0 values recovered from the Gosele et al. model are in surprisingly good agreement with that estimated from eq 4.
The capability of measuring diffusion coefficients from the energy-transfer data can have widespread applications in chemistry and biophysics. In homogeneous solvents, the data may allow comparison of the data with various models for diffusion. In macromolecules and macromolecular assemblies, the data may allow determination of the dynamics of ions around polyelectrolytes, rate of lipid transport within membranes, and comparison with the molecular dynamics between sites on a protein molecule.
Acknowledgment.
This work was supported by grants GM 35154 and GM 39617 from the National Institutes of Health and grants DIR-8710401 and DMB-8502835 from the National Service Foundation. J.R.L. and W.W. express appreciation for support from the Medical Biotechnology Center and the University of Maryland.
References
- (1).Porter G; Tredwell CJ Chem. Phys. Lett 1978, 56, 278. [Google Scholar]
- (2).Tamai N; Yamazaki T; Yamazaki I; Mataga N Chem. Phys. Lett 1985, 120, 24. [Google Scholar]
- (3).Lu PY; Yu ZX; Alfano RR; Gerstenn JI Phys. Rev 1982, A26, 3610. [Google Scholar]
- (4).Mugnier J; Veluer B; Gratton E Chem. Phys. Lett 1985,119, 217. [Google Scholar]
- (5).Lakowicz JR; Johnson ML; Wiczk W; Bhat A; Steiner RF Chem. Phys. Lett 1987, 138, 587. [DOI] [PMC free article] [PubMed] [Google Scholar]
- (6).Lakowicz JR; Gryczynski I; Cheung HC; Wang CK; Johnson ML Biopolymers 1988, 27, 821. [DOI] [PubMed] [Google Scholar]
- (7).Lakowicz JR; Gryczynski I; Cheung HC; Wang CK; Johnson ML Biochemistry 1988, 27, 9149. [DOI] [PMC free article] [PubMed] [Google Scholar]
- (8).Lakowicz JR; Gryczynski I; Wiczk W; Laczko G; Prendergast FC; Johnson ML Biophys. Chem In press. [DOI] [PubMed] [Google Scholar]
- (9).Lakowicz JR; Johnson ML; Joshi N; Gryczynski I; Laczko G Chem. Phys. Lett 1986, 131, 343. [Google Scholar]
- (10).Lakowicz JR; Johnson ML; Gryczynski I; Joshi N; Laczko GJ Phys. Chem 1987, 91, 3277. [DOI] [PMC free article] [PubMed] [Google Scholar]
- (11).Lakowicz JR; Joshi N; Johnson ML; Szmacinski H; Gryczynski IJ Biol. Chem 1987, 262, 10907. [PubMed] [Google Scholar]
- (12).Gryczynski I; Wiczk W; Johnson ML; Cheung HF; Wang CK; Lakowicz JR Biophys. J 1988, 54, 577. [DOI] [PMC free article] [PubMed] [Google Scholar]
- (13).Yokota M; Tanimoto OJ Phys. Soc. Jpn 1967, 22, 779. [Google Scholar]
- (14).Gosele U; Hauser M; Klein UKA; Frey R Chem. Phys. Lett 1975, 24, 519. [Google Scholar]
- (15).Forster T Ann. Phys. (Leipzig) 1948, 2, 55. [Google Scholar]
- (16).Galanin MD Soviet Phys. JETP 1955, 1, 317. [Google Scholar]
- (17).Blumen A Nuovo Cimento 1981, B63, 50. [Google Scholar]
- (18).Allinger K; Blumen AJ Chem. Phys 1980, 72 4608. [Google Scholar]
- (19).Johnson ML; Frasier SG Methods Enzymol 1985, 117, 301. [Google Scholar]
- (20).Lakowicz JR; Gratton E; Laczko G; Cherek H; Limkeman M Biophys. J 1984, 46, 463. [DOI] [PMC free article] [PubMed] [Google Scholar]
- (21).Forsythe GE; Malcolm MA; Moler CB Computer methods for mathematical computations; Prentice Hall: Englewood Cliffs, 1977. [Google Scholar]
- (22).Chen RF Anal. Lett 1967, 1, 35. [Google Scholar]
- (23).Lakowicz JR; Laczko G; Gryczynski I Rev. Sci. Instrum 1986, 57, 2499. [Google Scholar]
- (24).Lakowicz JR; Wiczk W; Gryczynski I; Szmacinski H Biophys. Chem In press. [DOI] [PubMed] [Google Scholar]


