Abstract
Background
Esophageal squamous cell carcinoma (ESCC) is one of the most lethal malignancies. Latest studies report that long noncoding RNAs (LncRNAs) play an essential role in diversified pathological processes of ESCC, although the mechanism by which they do so remains unknown. This study aimed to explore the parts of lncRNA taurine upregulated gene 1 (TUG1) in ESCC tissues and cells, its biofunctional effect and its underlying regulatory mechanism in ESCC.
Methods
The levels of TUG1 and miR‐148a‐3p were detected by quantitative real‐time polymerase chain reaction (qRT‐PCR) in ESCC cells and tissues. The biofunctional effects were examined by MTT, flow cytometry, and transwell assay. The protein expression levels of epithelial‐mesenchymal transition (EMT)‐related proteins and MCL‐1 were determined by western blot analysis. The binding sites between miR‐148a‐3p and TUG1 or MCL‐1 were predicted by online software starBase and confirmed by dual luciferase reporter assay.
Results
The mRNA expression of TUG1 was significantly upregulated in ESCC tissues or cells, and was negatively correlated to miR‐148a‐3p expression in tissues. Knockdown of TUG1 inhibited the proliferation, migration, and invasion, promoted apoptosis, and relieved the EMT progression in EC9706 and OE19 cells. Besides, knockdown of miR‐148a‐3p inverted positive effects from TUG1 deletion on ESCC cells. Besides, MCL‐1 reversed the inhibitive effects from TUG1 deletion on expression of EMT‐associated proteins (Wnt1, C‐myc, CyclinD1, and β‐catenin) above subsequently.
Conclusion
TUG1 regulated the biofunction and EMT progression of ESCC by mediating miR‐148a‐3p/MCL‐1/Wnt/β‐catenin axis in vitro.
Keywords: Biofunction, ESCC, MCL‐1, miR‐148a‐3p, TUG1
Introduction
Esophageal squamous cell carcinoma (ESCC) is a well‐known form of cancer globally and is the sixth leading cause of cancer mortality.1, 2 Although much has been achieved in the treatment of this illness, its patient survival rate within five‐years remains extremely poor as at present the only available treatment options are surgery, radiotherapy, and chemotherapy.3 In addition, it is difficult to slow down the progression of ESCC and it is therefore of great importance to explore an effective treatment to prevent disease progression.
Long noncoding RNAs (lncRNAs) are a class of molecules with more than 200 nucleotides (nts) in length and without any encoding protein ability.4 Emerging evidence suggests that lncRNAs act as tumor‐suppressors or enhancers and widely participate in the process of tumorigenesis.5, 6 Taurine‐upregulated gene 1 (TUG1) was initially identified as a transcript that upregulated in response to taurine.7 The study by Jiang et al. proved that dysregulated expression of TUG1 was correlated to poor prognosis in ESCC.8 Xu et al. observed that TUG1 deletion facilitated DDP sensitivity of DDP‐resistant ESCC cells.9 By loss‐functional experiment, Wang et al. found that knockdown of TUG1 limited the proliferation and migration of ESCC cells and arrested the cell cycle progression.10 However, the possible roles and regulatory mechanism of TUG1 contributing to the development of ESCC have not been widely reported.
In this study, our data unraveled that TUG1 was increased in both ESCC tissues and cells. In addition, its enhanced expression was negatively correlated with that of miR‐148a‐3p. TUG1 knockdown significantly promoted cell apoptosis, decreased cell proliferation, migration, invasion, and EMT progression in vitro. Mechanically, we proved that TUG1 exerted oncogene function by regulating MCL‐1 via sponging miR‐148a‐3p in ESCC succession. In conclusion, this study aimed to explore the role of TUG1 in ESCC, its functional effects in vitro, and its mechanism in ESCC development.
Methods
Clinical specimens
The experiment was authorized by the Ethics Committee of Zhangjiagang Hospital of Traditional Chinese Medicine and executed according to the Declaration of Helsinki Principles. A total of 49 paired specimens of the tumor and tumor‐adjacent part from ESCC patients were collected from Zhangjiagang Hospital of Traditional Chinese Medicine. Informed consent was provided by all participants. All ESCC specimens were preserved at –80°C for further investigation.
Cell culture and transfection
HEEC, TE1, EC9706, ECA109, and OE19 cell lines were obtained from JNO Biotechnology (Guangzhou, China) and cultured as previously described.11 Sh‐RNA targeting TUG1 (sh‐TUG1), TUG1 overexpression plasmid (pcDNA‐TUG1), and miR‐148a‐3p mimics (miR‐148a‐3p), miR‐138a‐3p inhibitor (anti‐miR‐138a‐3p) and counterpart controls (sh‐NC, pcDNA‐NC, miR‐NC, inhibitor‐NC) were all obtained from GenePharm (Shanghai, China). Lipofectamine 3000 (Thermo Fisher Scientific, Waltham, MA, USA) kit was used for transfection according to the manufacturer's instructions. Additionally, 1 μm XAV939 (Millipore Co, Ltd., Billerica, MA, USA) was added into the Wnt inhibitor group and 20 μm SKL2001 (Millipore Co, Ltd., Billerica,MA, USA) was added to the Wnt agonist group.
Quantitative real‐time polymerase chain reaction (qRT‐PCR)
RNA from ESCC tissues specimens and cells was extracted by using TRIzol reagent (Thermo Fisher Scientific) and reverse‐transcribed using All‐in‐One miRNA Prime ScriptRT reagent kit (Takara, Shiga, Osaka, Japan). QPCR was performed using the qRT‐PCR Detection Kit (GeneCopoeia, Inc., RockVile, MD, USA) and SYBR mix (TaKaRa, Dalian, China) on the 7500 Fast Real‐Time PCR system (Thermo Fisher Scientific). U6 or GAPDH was usage as internal reference gene. Relative expression of TUG1, miR‐148a‐3p, MCL‐1 was calculated by the 2‐ΔΔCt method. The primers were designed and obtained from Sangon Biotech (Shanghai, China), and sequences of primers for TUG1, MCL‐1, GAPDH, miR‐148a‐3p and U6 and used in qPCR reactions were listed: TUG1 forward (5′‐TAGCAGTTCCCCAATCCTTG‐3′), TUG1 reverse (5′‐CACAAATTCCCATCATTCCC‐3′); MCL‐1 forward (5′‐CGGCAGTCGCTGGAGATTAT‐3′), MCL‐1 reverse (5′‐GTGGTGGTGGTTGGTTA‐3′); GAPDH forward (5′‐GAGTCAACGGATTTGGTCGT‐3′), GAPDH reverse (5′‐TTGATTTTGGAGGGATCTCG‐3′); miR‐148a‐3p forward (5′‐TCAGTGCACTACAGAACTTTGT‐3′), miR‐148a‐3p reverse (5′‐GAATACCTCGGACCCTGC‐3′); U6 forward (5′‐CTCGCTTCGGCAGCACA‐3′), U6 reverse (5′‐AACGATTCACGAATTTGCGT‐3′).
3‐(4, 5‐dimethyl‐2‐thiazolyl)‐2, 5‐diphenyl‐2‐H‐tetrazolium bromide (MTT)
MTT reagent (Sigma, St Louis, MO, USA) was added to each 96‐well plate and cells (5 × 10³/well) were maintained for 24 hours, 48 hours, 72 hours and then incubated for a further four hours. After that, cell supernatant was discarded, and 200 μL of DMSO (Solarbio, Beijing, China) was added to dissolve intracellular formazan crystals in each well.11 Cell proliferation was determined at 490 nm using a microplate reader (Thermo Fisher Scientific).
Flow cytometry
Cells were collected and digested with pancreatin before being centrifuged. Cells were subsequently resuspended with 1 × binding buffer after being washed with iced phosphate‐buffered saline (PBS). Annexin V‐fluorescein isothiocyanate propidium iodide (Annexin V‐FITC/PI) kit (BD Pharmingen, San Diego, CA, USA) was then utilized following the manufacturer's instructions. Apoptotic cells were examined using a flow cytometer (BD Biosciences, Franklin Lakes, NJ, USA), and the apoptosis rate was then calculated.
Transwell migration and invasion assay
Cell migration and invasion rate was investigated by transwell chamber with or without Matrigel matrix (Corning Life Sciences, Corning, NY, USA). RPMI‐1640 medium with 10% FBS was added to the lower chamber, while the transfected EC9706 and OE19 cells were injected into the upper chamber with 100 μL of serum‐free medium. This process was carried out according to the experiment instructor. Finally, paraformaldehyde (PFA; Sigma) was used to attach cells located on the lower surface of the upper chamber and these were analyzed under a microscope before being stained with crystal violet.
Western blot
RIPA buffer (Solarbio, Beijing, China) was used to isolate total proteins in cells and proteins were quantified by a NanoDrop 3000 (Thermo Fisher Scientific). Sodium dodecyl sulfate‐polyacrylamide gel electrophoresis (SDS‐PAGE) was used to separate proteins, and proteins were then transferred onto polyvinylidene fluoride (PVDF) membranes. After that, membranes were blocked in skim milk for two hours at 37°C and then incubated with primary antibodies at 4°C overnight. Following two hours incubation with secondary antibody marked with horseradish peroxidase (HRP) (1:2000; Cell Signaling Technology, Danvers, MA, USA). Chemiluminescence was performed using an ECL detection kit (Beyotime, Shanghai, China). The primary antibodies were as follows: anti‐N‐cadherin (1:1500; Cell Signaling Technology, Danvers, MA, USA), anti‐E‐cadherin (1:1000; Cell Signaling Technology), anti‐Vimentin (1:1000; Cell Signaling Technology), anti‐Snail (1:1000; Cell Signaling Technology), anti‐MCL‐1 (1:1000; Cell Signaling Technology), anti‐Wnt1 (1:1000; Cell Signaling Technology), anti‐C‐myc (1:1000; Cell Signaling Technology), anti‐CyclinD1 (1:1000; Cell Signaling Technology), anti‐β‐catenin (1:1000; Cell Signaling Technology) and anti‐GAPDH (1:4000; Cell Signaling Technology).
Dual luciferase assay
The putative binding sites of miR‐148a‐3p and TUG1 or MCL‐1 were predicted by starBase software online. The amplified wild‐type and the mutant fragment of TUG1 and MCL‐1 3'UTR were inserted into pMIR‐REPOR luciferase vector (OBio Biology, shanghai, China) to construct luciferase reporters, namely WT‐TUG1, MUT‐TUG1, WT‐MCL‐1, and MUT‐MCL‐1. The cotransfection of luciferase reporter and miRNA was performed as prescribed. The luciferase activity was tested using Dual‐Lucy Assay Kit (Promega, Madison, WI, USA).
Statistical analysis
All data were expressed as mean ± standard deviation (SD) and analyzed by SPSS 21.0 software. Comparisons among different groups were analyzed using one‐way ANOVA analysis of variance. A P‐value less than 0.05 was regarded as statistically significant.
Results
Expression of TUG1 elevated in ESCC tissues and cells
To explore the role of TUG1 in ESCC tissues and cells, we detected mRNA expression of TUG1 in 40 pairs of ESCC tissues and tumor‐adjacent corresponding tissues. The qRT‐PCR data showed that the expression of TUG1 was upregulated in ESCC tissues compared with adjacent counterparts (Fig 1a). The bar chart showed that the relative expression of TUG1 performed a high pattern in TE1, EC9706, ECA109, and OE19 cells compared with that in HEEC cells (Fig 1b). Besides, cells (EC9706 and OE19) were selected for further studies.
Figure 1.
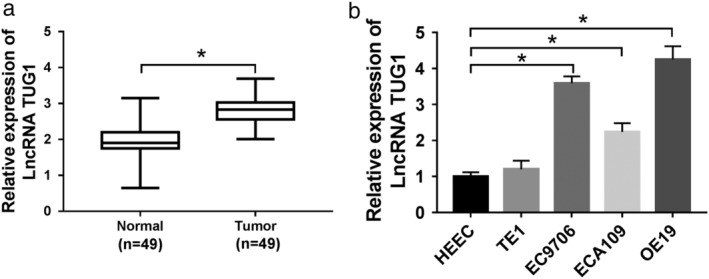
The expression of TUG1 was elevated in ESCC tissues and cells. (a,b) qRT‐PCR assay used to detect the mRNA expression level of TUG1 in ESCC tissues (a) and cells (b). *P < 0.05.
TUG1 mediated functional effects of ESCC in vitro
To figure out how TUG1 exerting potential function effects in ESCC, sh‐RNA and sh‐NC were constructed for further knockdown experiment. (Fig 2a) qPCR was used to confirm the efficiency of knockdown, and results showed that mRNA level of TUG1 was down‐regulated in silencing group, compared to sh‐NC group, in both EC9706 and OE19 cells. MTT assay (Fig 2b,c) or flow cytometry (Fig 2d) was conducted to detect the proliferation or apoptosis rate of ESCC cells with TUG1 knockdown, respectively. These data demonstrated that deletion of TUG1 inhibited proliferation and promoted apoptosis of ESCC in vitro. Moreover, termination of TUG1 downregulated the rate of migration (Fig 2e) and invasion (Fig 2f) in ESCC cells, which was conducted by transwell assay. In addition, the expression of epithelial‐mesenchymal transition (EMT) marker protein was detected, and the results (Fig 2g,h) showed that TUG1 deletion markedly upregulated E‐cadherin, but downregulated expression of N‐cadherin, Vimentin, and Snail in two different cells. These results confirmed that TUG1 suppressed the EMT process of ESCC cells.
Figure 2.
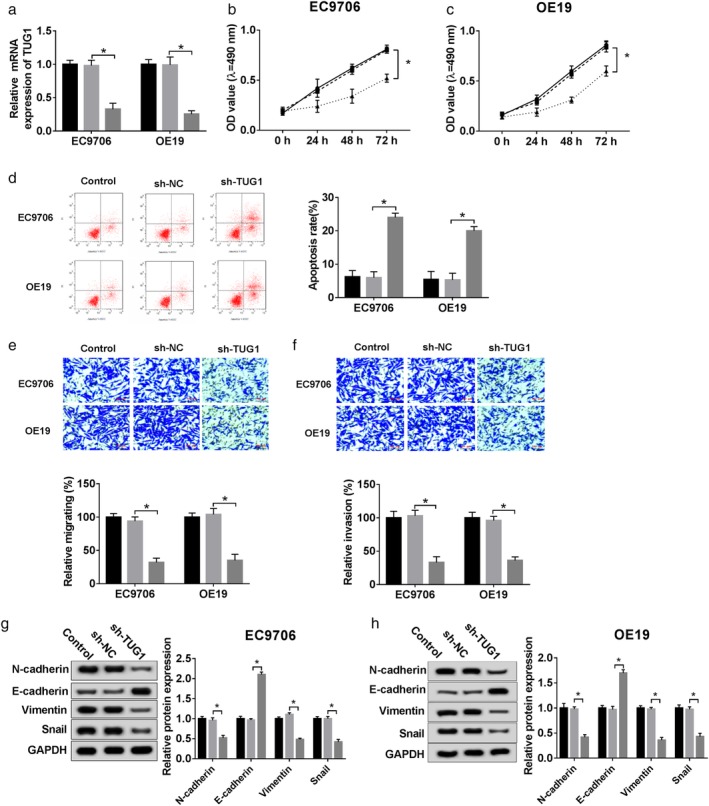
TUG1 mediated functional effects on ESCC cells in vitro. sh‐NC and sh‐TUG1 were synthesized and transfected into ESCC cells for further experiment. (a) Identification of knockdown efficiency was analyzed qRT‐PCR. ( ) Control, (
 ) sh‐NC, and (
 ) sh‐TUG1. (b,c) The cell viability at determined times (0 hours, 24 hours, 48 hours, 72 hours) was analyzed by MTT assay in EC9706 and OE19 cells. (
 ) Control, (
 ) sh‐NC, and (
 ) sh‐TUG1. (d) The apoptosis rate was confirmed by flow cytometry. (
 ) Control, (
 ) sh‐NC, and (
 ) sh‐TUG1. (e,f) Cell migration and invasion were evaluated by transwell assay. (
 ) Control, (
 ) sh‐NC, and (
 ) sh‐TUG1. (g,h) The epithelial mesenchymal transition (EMT)‐related protein levels of N‐cadherin, E‐cadherin, Vimentin, and Snail were explored by western blot. Scale bars are 100 μm. *P < 0.05. (
 ) Control, (
 ) sh‐NC, and (
 ) sh‐TUG1.
TUG1 directly targeted miR‐148a‐3p
StarBase was ultilized to identify the potential target of miR‐148a‐3p. We assumed that miR‐148a‐3p might have a binding site with TUG1 (Fig 3a). Furthermore, dual luciferase reporter assay was performed and confirmed that the luciferase activity of pMIR‐REPOR‐WT‐TUG1 was decreased by miR‐148a‐3p, while the pMIR‐REPOR‐MUT‐TUG1 activity did not change (Fig 3b,c). After that, by the loss‐gain‐functional experiment, transfection of sh‐TUG1 facilitated the expression of miR‐148a‐39, whereas overexpression of TUG1 impeded the miR‐148a‐39 expression compared with its negative controls (Fig 3d,e). In addition, qRT‐PCR analysis used to observe the potential relationship between miR‐148a‐3p and TUG1, and data demonstrated that a decreased expression of miR‐148a‐3p in tumor tissues (Fig 3e), which was negatively correlated with that of TUG1 (Fig 3g). Besides, the similarity of low appearance of miR‐148a‐3p could be observed in EC9706 and OE19 cells (Fig 3h).
Figure 3.
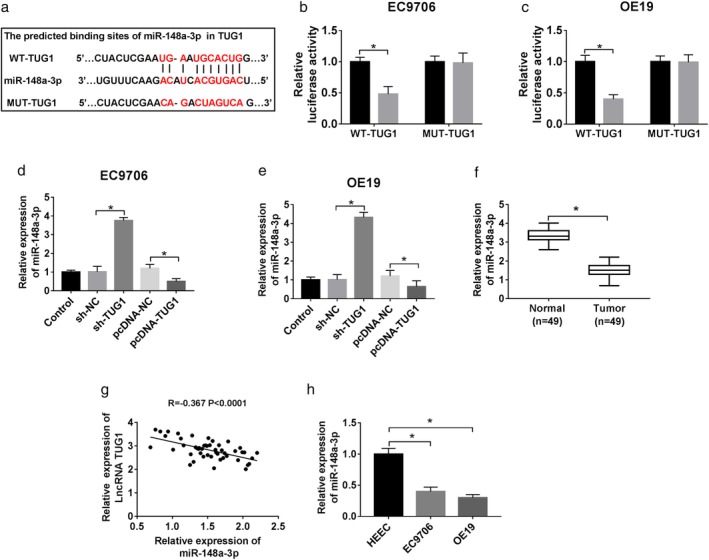
Identification of TUG1 targeting miR‐148a‐3p. (a) The putative binding site of miR‐148a‐3p and TUG1. (b,c) The prediction sites were identified by dual‐luciferase reporter assay. ( ) miR‐NC and (
 ) miR‐148a‐3p. (d,e) pcDNA‐NC and pcDNA‐TUG1 were designed to explore the effect of miR‐148a‐3p by loss‐and‐gain functional experiment on ESCC cells. QRT‐PCR was used to detect miR‐148a‐3p level in each group. (f,h) miR‐148a‐3p expression in tissues (f) and cells (h). (G) A correlation analysis between TUG1 and miR‐148a‐3p expression. *P < 0.05.
Knockdown of miR‐148a‐3p inverted functional effects from TUG1 deletion in ESCC in vitro
To further explore the biofunctional effect of miR‐148a‐3p, sh‐NC, sh‐TUG1, sh‐TUG1 + inhibitor‐NC, sh‐TUG1 + miR‐148a‐3p inhibitor were transfected into ESCC cells. QRT‐PCR assay assessed that miR‐148a‐3p expression was suppressed after cells cotransfected with sh‐TUG1 and miR‐148a‐3p inhibitor (Fig 4a,b). MTT assay showed that knockdown of miR‐148a‐3p inverted the positive effect on proliferation caused by deletion of TUG1 (Fig 4c,d). In addition, si‐TUG1 and miR‐148a‐3p inhibitor cotransfection facilitated the high rate of cells apoptosis resulted from si‐TUG1 transfection solely (Fig 4e). From these results we concluded that the migration and invasion were aggravated in cells knocked down in si‐TUG1 and miR‐148a‐3p inhibitor compared with si‐TUG1 only (Fig 4f,g). Moreover, the expression of marker protein for EMT was detected and the results exhibited that miR‐148a‐3p deletion obviously downregulated E‐cadherin, but upregulated expression of N‐cadherin, Vimentin, and Snail (Fig 4h,i). These data suggested that knockdown of miR‐148a‐3p promoted the EMT process, and reversed the positive effect from TUG1 deletion in ESCC cells.
Figure 4.
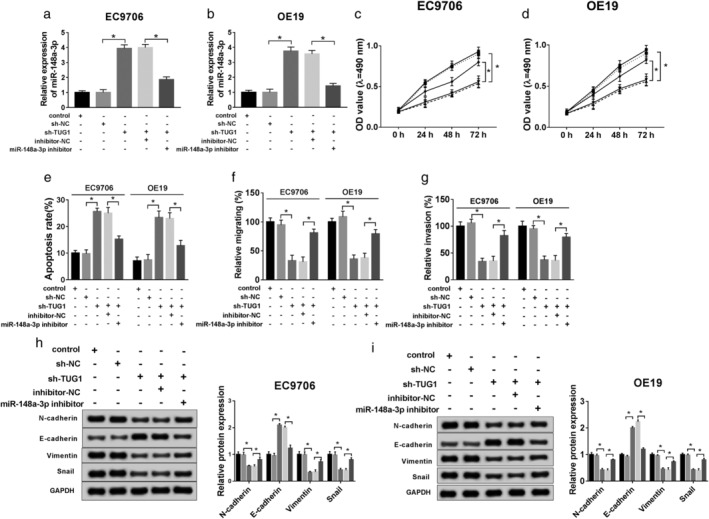
Knockdown of miR‐148a‐3p inverted functional effects from TUG1 deletion in ESCC in vitro. sh‐NC, sh‐TUG1, sh‐TUG1 + inhibitor‐NC, sh‐TUG1 + miR‐148a‐3p inhibitor was transfected into ESCC cells for subsequent experiment, separately. (a,b) QRT‐PCR was used to confirm the level of miR‐148a‐3p. (c,d) Cell viability was analyzed by MTT assay at stated times (0 hours, 24 hours, 48 hours, 72 hours) in EC9706 and OE19 cells. ( ) Control, (
 ) sh‐NC, (
 ) sh‐TUG1, (
 ) sh‐TUG1 + inhibitor‐NC, and (
 ) sh‐TUG1 + miR‐148a‐3p inhibitor. (e) Flow cytometry was conducted to analyze cell apoptosis rate. (f,g) Cell migration and invasion were evaluated by transwell assay. (h,i) The EMT‐related protein levels of N‐cadherin, E‐cadherin, Vimentin, and Snail were explored by western blot. *P < 0.05.
MCL‐1 a target of miR‐148a‐3p
StarBase was used to identify the potential target of miR‐148a‐3p. We assumed that miR‐148a‐3p might have a binding site with MCL‐1 (Fig 5a). Dual luciferase reporter assay was performed and confirmed that the luciferase activity of pMIR‐REPOR‐WT‐MCL‐1 was decreased by miR‐148a‐3p minic, while the pMIR‐REPOR‐MUT‐MCL‐1 activity did not change (Fig 5b,c). In addition, we examined the mRNA and protein expression of MCL‐1 by loss‐and‐gain function experiment. The qRT‐PCR results showed that miR‐148a‐3p deletion achieved two‐fold expression of MCL‐1 nearly whereas miR‐148a‐3p enhanced expression only obtained half of the expression of MCL‐1 almost (Fig 5d,e). Similar results could be observed in the western blot data (Fig 5f,g).
Figure 5.
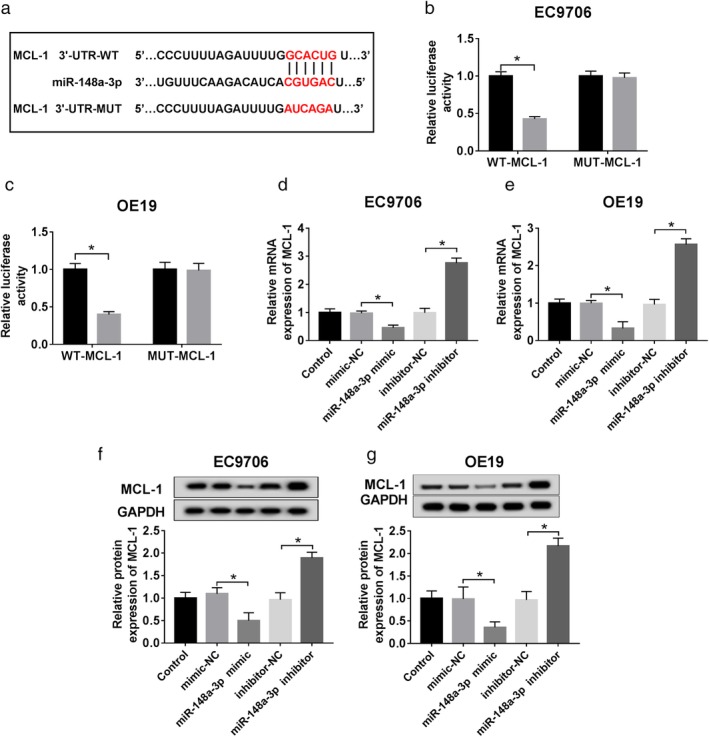
Identification of miR‐148a‐3p targeting MCL‐1. (a) The putative binding site of miR‐148a‐3p and MCL‐1. (b.c) The target relationship was identified by dual‐luciferase reporter assay. Mimic‐NC and miR‐148a‐3p mimic were designed to explore the effect of MCL‐1 by loss‐and‐gain functional experiment on ESCC cells. ( ) mimic control and (
 ) miR‐148a‐3p mimic. (d,e) QRT‐PCR was used to detect miR‐148a‐3p level in each group. (f,g) Western blot was used to detect miR‐148a‐3p level in each group. *P < 0.05.
Overexpression of MCL‐1 inverted functional effects from miR‐148a‐3p ectopic expression in ESCC cells in vitro
To further explore the molecular mechanism of MCL‐1 regulating the biological processes in ESCC cells, qRT‐PCR or western blot was used to detect the mRNA or protein level of MCL‐1 in ESCC cells treated with minic‐NC, miR‐148a‐3p minic, miR‐148a‐3p minic+pcDNA or miR‐148a‐3p minic+MCL‐1, separately. The results demonstrated that MCL‐1 upregulation improved its low expression resulted from miR‐148a‐3p minic (Fig 6a–c), and it eliminated the positive effect on cell viability (Fig 6d,e) triggered by miR‐148a‐3p high‐expression. In addition, compared with the negative control, the promotion of MCL‐1 impeded the cell apoptosis rate (Fig 6f), and as the data indicates in Fig 6g,h, the migratory and invasive rates were enlarged by MCL‐1 overexpression in the presence of miR‐148a‐3p. Additionally, the expression of EMT‐related proteins was detected by western blot assay, and the results suggested that improvement of MCL‐1 obviously downregulated E‐cadherin, but upregulated expression of N‐cadherin, Vimentin, and Snail (Fig 6i,j). These data suggested that enhanced MCL‐1 facilitated the EMT process, and reversed the positive effect induced by ectopic expression of miR‐148a‐3p in ESCC cells.
Figure 6.
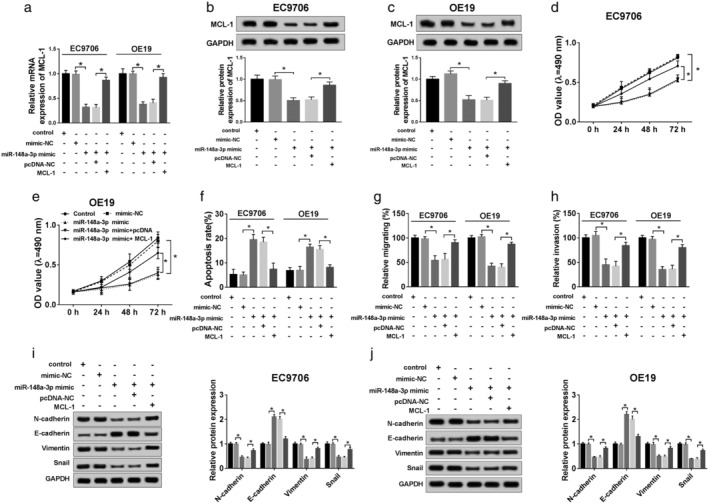
Overexpression of MCL‐1 inverted functional effects from miR‐148a‐3p ectopic expression in ESCC in vitro. Mimic‐NC, miR‐148a‐3p mimic, miR‐148a‐3p mimic+pcDNA, miR‐148a‐3p mimic+MCL‐1 were separately transfected into ESCC cells, for subsequent experiment. (a,b) QRT‐PCR was used to confirm the level of MCL‐1. (c,d) The cell viability was analyzed by MTT assay at different times (0 hours, 24 hours, 48 hours, 72 hours) in EC9706 and OE19 cells. ( ) Control, (
 ) mimic‐NC, (
 ) miR‐148a‐3p mimic, (
 ) miR‐148a‐3p mimic + pcDNA, and (
 ) miR‐148a‐3p mimic + MCL‐1. (e) Flow cytometry was conducted to analyze cell apoptosis rate. (
 ) Control, (
 ) mimic‐NC, (
 ) miR‐148a‐3p mimic, (
 ) miR‐148a‐3p mimic + pcDNA, and (
 ) miR‐148a‐3p mimic + MCL‐1. (f,g) cell migration and invasion were evaluated by transwell assay. (h,i) The EMT‐related protein levels of N‐cadherin, E‐cadherin, Vimentin, and Snail were explored by western blot. *P < 0.05.
TUG1 enhanced expression of MCL‐1 by sponging miR‐148a‐3p
To determine how TUG1 regulates the level of MCL‐1, ESCC EC9706 and OE1 cells were divided into four groups (miR‐NC, miR‐148a‐3p, miR‐148a‐3p + pcDNA, miR‐148a‐3p + TUG1). QRT‐PCR or western blot was used to confirm the relative expression level of MCL‐1 in ESCC cells cotransfected with miR‐148a‐3p and TUG1. The data above proved that TUG1 upregulation enhanced expression of MCL‐1, either at mRNA (Fig 7a,b) or protein level (Fig 7c,d).
Figure 7.
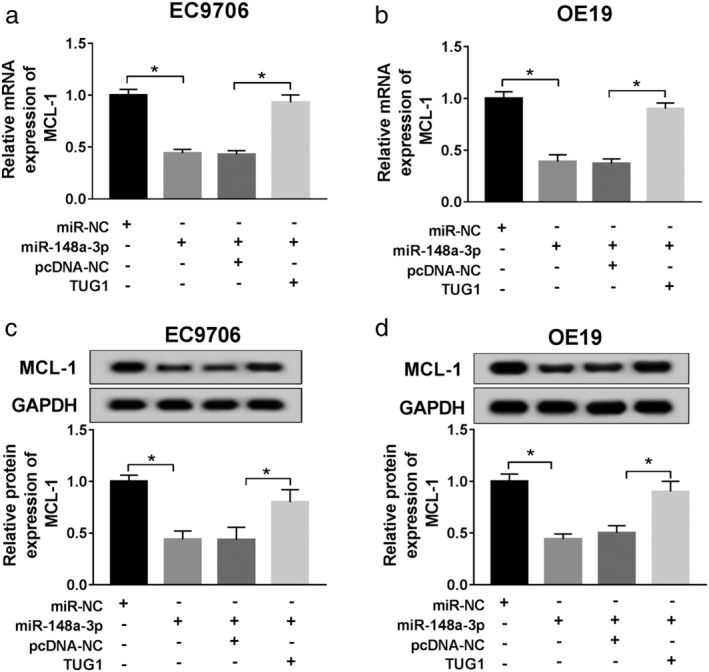
TUG1 upregulation enhanced expression of MCL‐1 by targeting miR‐148a‐3p. Two ESCC cells were transfected with miR‐NC, miR‐148a‐3p mimic, miR‐148a‐3p + pcDNA, miR‐148a‐3p + TUG1 separately for subsequent management. (a,b) QRT‐PCR was used to detect MCL level in each group. (c,d) Western blot was used to detect MCL level in each group. *P < 0.05.
TUG1 regulated Wnt/β‐catenin pathway via miR‐148a‐3p/MCL‐1 axis
Furthermore, we addressed the regulator mechanism of TUG1 on functional effect by exploring the activity of the Wnt/β‐catenin signaling pathway in ESCC cells with knockdown of TUG1 or miR‐148a‐3p, and overexpression MCL‐1. In EC9706 and OE19 cells, using western blot assay (Fig 8a,b), we observed that the expression of MCL‐1 and Wnt/β‐catenin pathway‐associated proteins markers, namely Wnt1, C‐myc, CyclinD1, β‐catenin were reduced by TUG1 deletion. Notably, sh‐TUG1 and miR‐138a‐3p inhibitor cotransfection possessed a higher expression of these proteins, along with sh‐TUG1 transfection only. After that, its positive results could be inverted by overexpression of MCL‐1. These results confirmed that TUG1 regulated Wnt/β‐catenin signaling via miR‐148a‐3p/MCL‐1 axis in ESCC cells.
Figure 8.
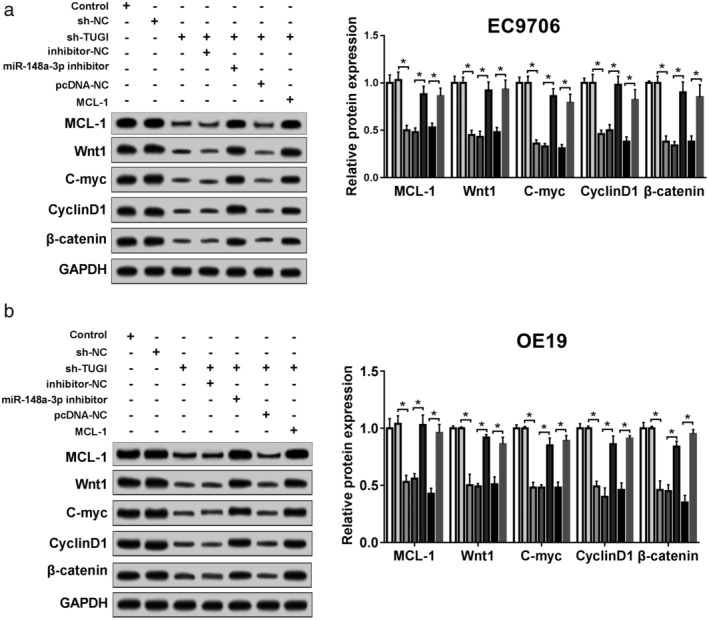
TUG1 regulated Wnt/β‐catenin pathway via miR‐148a‐3p/MCL‐1 axis. (a,b) The expression of MCL‐1, Wnt1, C‐myc, CyclinD1, and β‐catenin in EC9706 (a) and OE19 (b) cells in different groups was determined by western blot assay. *P < 0.05. ( ) Control, (
 ) sh‐NC, (
 ) sh‐TUG1, (
 ) sh‐TUG1 + inhibitor‐NC, (
 ) sh‐TUG1 + miR‐148a‐3p inhibitor, (
 ) sh‐TUG1 + pcDNA‐NC, and (
 ) sh‐TUG1 + MCL‐1.
Downexpression of TUG1 restrained activation of the Wnt/β‐catenin signaling pathway in ESCC cells
To further explore whether the decrease of TUG1 inhibited ESCC growth via the Wnt/β‐catenin signaling pathway, the activator (SKL2001) or inhibitor (XAV939) of Wnt/β‐catenin signaling pathway was used. As shown in Fig 9a,b, the cell viability was accelerated by SKL2001 administration and decreased by XAV939 exposure in TUG1‐knocked out ESCC cells. Also, SKL2001 limited the rate of apoptosis, with XAV939 enhancing the cell apoptosis (Fig 9c). Meanwhile, the SKL2001 promoted the abilities upon migration and invasion in the EC9706 and OE19 cells treated with sh‐TUG1, and the opposite results could be seen in cells stimulated with XAV939 (Fig 9d,e). With regard to the Wnt/β‐catenin signaling‐related expression, western blot assay confirmed that in the EC9706 and OE19 cells, SKL2001 facilitated the expression of in N‐cadherin, Vimentin, and Snail in the sh‐TUG1 + SKL2001, and abolished the expression of E‐cadherin, compared with the sh‐TUG1 group, individually. Additionally, reversed data could be observed in XAV939 of cells (Fig 9f,g). The results showed that decrease of TUG1 inhibited the activation of Wnt/β‐catenin signaling pathway, thereby inhibiting the proliferation, apoptosis, invasion, and migration in ESCC cells.
Figure 9.
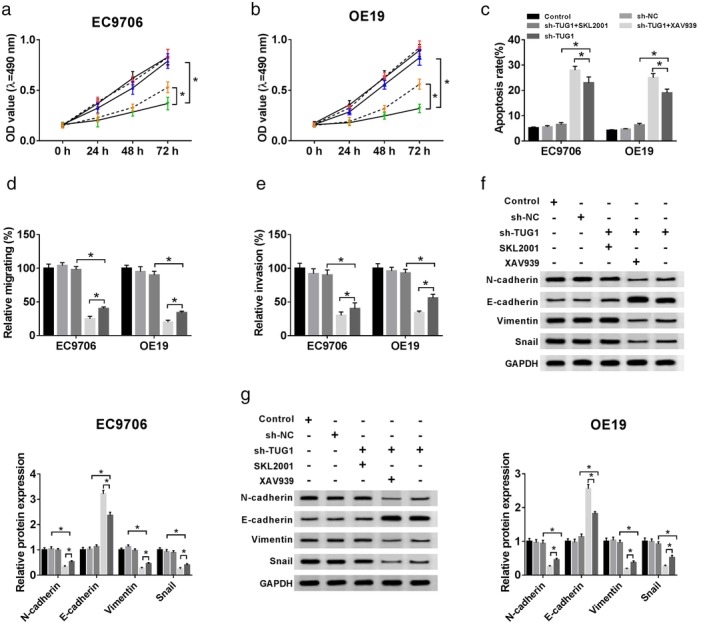
Effects of activating or blocking the Wnt/β‐catenin signaling pathway on cell proliferation, apoptosis, invasion, and migration in EC9706 and OE19 cells after sh‐TUG1 transfection. (a,b) After sh‐TUG1 transfection or combining SKL2001 and XAV939 in EC9706 and OE19 cells, cell proliferation activity was detected by MTT assay, ( ) Control, (
 ) sh‐NC, (
 ) sh‐TUG1 + SKL2001, (
 ) sh‐TUG1 + XAV939, and (
 ) sh‐TUG1. (c) the cell apoptosis ability was measured by flow cytometry, (
 ) Control, (
 ) sh‐NC, (
 ) sh‐TUG1 + SKL2001, (
 ) sh‐TUG1 + XAV939, and (
 ) sh‐TUG1, (d,e) the cell invasive abilities were detected by Transwell assays. (
 ) Control, (
 ) sh‐NC, (
 ) sh‐TUG1 + SKL2001, (
 ) sh‐TUG1 + XAV939, and (
 ) sh‐TUG1. (f,g) Western blot assay was carried out to explore the expression of N‐cadherin, E‐cadherin, Vimentin, and Snail in cells. (
 ) Control, (
 ) sh‐NC, (
 ) sh‐TUG1 + SKL2001, (
 ) sh‐TUG1 + XAV939, and (
 ) sh‐TUG1.
Discussion
Long noncoding RNAs (LncRNAs) have been reported as multifunctional factors in esophageal squamous cell carcinoma (ESCC). For example, Wu et al. claimed that CASC9 expression was not only positively associated with tumor size and stage of murine tumor model, but also could predict poor prognosis in ESCC patients.12 In the report by Hu et al. the three different circulating lncRNAs (Linc00152, CFLAR‐AS1, and POU3F3) served as potential biomarkers for predicting the early stage for ESCC.13 Zhang et al. found that antisense lncRNA EZR‐AS1 was positively correlated with EZR expression in both human ESCC tissues and cells. In addition, the results of their experiment in vivo or in vitro also revealed that EZR‐AS1 facilitated the ability of migration by upregulating EZR expression,14 whereas little information on molecular mechanisms of lncRNAs was elaborated in ESCC.
Taurine upregulated gene 1 (TUG1) has been initially observed in developing murine retinal cells.7 Pervasive studies indicated that TUG1 participated in multiple cancers, such as osteosarcoma,15 bladder cancer,16 non‐small cell lung carcinoma,17 colorectal cancer18 and glioma.19 In recent years, TUG1 has been found to participate in the regulation of ESCC progression. Xu et al.10 reported that enhanced TUG1 levels could be detected in ESCC tissues, thereby silencing TUG1 abolished biological processes and the progression of the cell cycle in ESCC cells.18 However, previous research has failed to entirely focus on the potential role of TUG1 in ESCC.
In line with the results of previous studies,18 our data showed that lncRNA TUG1 exhibited a high expression in ESCC tissues, and the opposite for low expression of miR‐148a‐3p. In addition, high TUG1 expression was negatively correlated with that of miR‐148a‐3p. MTT assay showed that downregulated TUG1 significantly inhibited the viability of both EC9706 and OE19 transfected with sh‐TUG1. Flow cytometry assay confirmed that the apoptosis was suppressed in cells transfected with sh‐TUG1 compared with the sh‐NC group. Transwell assay demonstrated that sh‐TUG1 inhibited migration and invasion abilities when compared with cell knockdown in the negative control. Also, western blot assays confirmed that TUG1 deletion relieved development of EMT of ESCC in vitro. Moreover, luciferase assay confirmed that miR‐148a‐3p could specially bind to TUG1. In addition, functional analysis uncovered that miR‐148a‐3p knockdown reversed the regulatory effects of TUG1 on cells. These results confirm that TUG1 could exert an essential role in proliferation, apoptosis, migration, invasion, and EMT in ESCC progression in vitro and miR‐148a‐3p could invert the positive biofunction effect from sh‐TUG1.
Myeloid leukemia‐1 (MCL‐1) belongs to the Bcl‐2 family, and participates in a wide range of activities and functions. It also plays a critical role in tumor progression and is connected with poor prognosis in patients. In addition, in several reports, MCL‐1 has been shown to be highly overexpressed in various cancers,20 such as stomach cancer,21 liver cancer,22 pancreas cancer,23 prostate cancer24 and lung cancer.25 The cellular expression of MCL‐1 is closely mediated by a series of mechanical network.26 MCL‐1 level of human ESCC is regulated by the activation of NF‐κB signaling pathway.27 UMI‐77 (a kind of selective MCL‐1 inhibitor) led to dissociation of MCL‐1 from the pro‐apoptotic protein BAX and BAK, and aggravated apoptosis in cisplatin‐induced ESCC cells.28 Hence, the accumulated knowledge and understanding of human ESCC could provide mechanistic insights into diagnosis and treatment.
In our study, we identified MCL‐1 as a potential target of miR‐148a‐3p. Both qRT‐PCR and western blot showed that MCL‐1 expression was decreased in ESCC cells knocked down in miR‐148a‐3p mimics, whereas its expression was increased after knockdown in miR‐148a‐3p inhibitor. Besides, MCL‐1 was upregulated in coexpression of both TUG1 and miR‐148a‐3p cells by comparison with expression of miR‐148a‐3p solely. In addition, function assays demonstrated that MCL‐1 ectopic expression inverted the positive effects of miR‐148a‐3p overexpression or TUG1 silencing.
In conclusion, ur study confirmed that TUG1 worked as an oncogene, promoted cell proliferation, suppressed cell apoptosis, facilitated migration, invasion, and EMT by sponging with miR‐148a‐3p in ESCC progression in vitro. Additionally, this paper also revealed a different miR‐148a‐3p/MCL‐1/Wnt/β‐catenin axis, which offers a novel therapeutic method for ESCC treatment.
Disclosure
The authors declare that they have no financial conflicts of interest.
Acknowledgment
None.
References
- 1. Ferlay J, Shin HR, Bray F et al Estimates of worldwide burden of cancer in 2008: GLOBOCAN 2008. Int J Cancer 2010; 127: 2893–917. [DOI] [PubMed] [Google Scholar]
- 2. Enzinger PC, Mayer RJ. Esophageal cancer. N Engl J Med 2003; 349: 2241–52. [DOI] [PubMed] [Google Scholar]
- 3. Pohl H, Welch HG. The role of overdiagnosis and reclassification in the marked increase of esophageal adenocarcinoma incidence. J Natl Cancer Inst 2005; 97: 142–6. [DOI] [PubMed] [Google Scholar]
- 4. Mercer TR, Dinger ME, Mattick JS. Long non‐coding RNAs: Insights into functions. Nat Rev Genet 2009; 10: 155–9. [DOI] [PubMed] [Google Scholar]
- 5. Fatica A, Bozzoni I. Long non‐coding RNAs: New players in cell differentiation and development. Nat Rev Genet 2014; 15: 7–21. [DOI] [PubMed] [Google Scholar]
- 6. Gibb EA, Brown CJ, Lam WL. The functional role of long non‐coding RNA in human carcinomas. Mol Cancer 2011; 10: 38. [DOI] [PMC free article] [PubMed] [Google Scholar]
- 7. Young TL, Matsuda T, Cepko CL. The noncoding RNA taurine upregulated gene 1 is required for differentiation of the murine retina. Curr Biol 2005; 15: 501–12. [DOI] [PubMed] [Google Scholar]
- 8. Jiang L, Wang W, Li G et al High TUG1 expression is associated with chemotherapy resistance and poor prognosis in esophageal squamous cell carcinoma. Cancer Chemother Pharmacol 2016; 78: 333–9. [DOI] [PubMed] [Google Scholar]
- 9. Xu C, Guo Y, Liu H et al TUG1 confers cisplatin resistance in esophageal squamous cell carcinoma by epigenetically suppressing PDCD4 expression via EZH2. Cell Biosci 2018; 8: 61. [DOI] [PMC free article] [PubMed] [Google Scholar]
- 10. Xu Y, Wang J, Qiu M et al Upregulation of the long noncoding RNA TUG1 promotes proliferation and migration of esophageal squamous cell carcinoma. Tumour Biol 2015; 36: 1643–51. [DOI] [PubMed] [Google Scholar]
- 11. Liu Q, Liu H, Cheng H et al Downregulation of long noncoding RNA TUG1 inhibits proliferation and induces apoptosis through the TUG1/miR‐142/ZEB2 axis in bladder cancer cells. Onco Targets Ther 2017; 10: 2461–71. [DOI] [PMC free article] [PubMed] [Google Scholar]
- 12. Wu Y, Hu L, Liang Y et al Up‐regulation of lncRNA CASC9 promotes esophageal squamous cell carcinoma growth by negatively regulating PDCD4 expression through EZH2. Mol Cancer 2017; 16: 150. [DOI] [PMC free article] [PubMed] [Google Scholar]
- 13. Hu HB, Jie HY, Zheng XX. Three circulating LncRNA predict early progress of esophageal squamous cell carcinoma. Cell Physiol Biochem 2016; 40: 117–25. [DOI] [PubMed] [Google Scholar]
- 14. Zhang XD, Huang GW, Xie YH et al The interaction of lncRNA EZR‐AS1 with SMYD3 maintains overexpression of EZR in ESCC cells. Nucleic Acids Res 2018; 46: 1793–809. [DOI] [PMC free article] [PubMed] [Google Scholar]
- 15. Zhang Q, Geng PL, Yin P et al Down‐regulation of long non‐coding RNA TUG1 inhibits osteosarcoma cell proliferation and promotes apoptosis. Asian Pac J Cancer Prev 2013; 14: 2311–5. [DOI] [PubMed] [Google Scholar]
- 16. Han Y, Liu Y, Gui Y et al Long intergenic non‐coding RNA TUG1 is overexpressed in urothelial carcinoma of the bladder. J Surg Oncol 2013; 107: 555–9. [DOI] [PubMed] [Google Scholar]
- 17. Zhang EB, Yin DD, Sun M et al P53‐regulated long non‐coding RNA TUG1 affects cell proliferation in human non‐small cell lung cancer, partly through epigenetically regulating HOXB7 expression. Cell Death Dis 2014; 5: e1243. [DOI] [PMC free article] [PubMed] [Google Scholar]
- 18. Sun J, Ding C, Yang Z et al The long non‐coding RNA TUG1 indicates a poor prognosis for colorectal cancer and promotes metastasis by affecting epithelial‐mesenchymal transition. J Transl Med 2016; 14: 42. [DOI] [PMC free article] [PubMed] [Google Scholar]
- 19. Li J, Zhang M, An G, Ma Q. LncRNA TUG1 acts as a tumor suppressor in human glioma by promoting cell apoptosis. Exp Biol Med 2016; 241: 644–9. [DOI] [PMC free article] [PubMed] [Google Scholar]
- 20. Perciavalle RM, Stewart DP, Koss B et al Anti‐apoptotic MCL‐1 localizes to the mitochondrial matrix and couples mitochondrial fusion to respiration. Nat Cell Biol 2012; 14: 575–83. [DOI] [PMC free article] [PubMed] [Google Scholar]
- 21. Lee WS, Park YL, Kim N et al Myeloid cell leukemia‐1 regulates the cell growth and predicts prognosis in gastric cancer. Int J Oncol 2015; 46: 2154–62. [DOI] [PubMed] [Google Scholar]
- 22. Sieghart W, Losert D, Strommer S et al Mcl‐1 overexpression in hepatocellular carcinoma: A potential target for antisense therapy. J Hepatol 2006; 44: 151–7. [DOI] [PubMed] [Google Scholar]
- 23. Miyamoto Y, Hosotani R, Wada M et al Immunohistochemical analysis of Bcl‐2, Bax, Bcl‐X, and Mcl‐1 expression in pancreatic cancers. Oncology 1999; 56: 73–82. [DOI] [PubMed] [Google Scholar]
- 24. Dash R, Richards JE, Su ZZ et al Mechanism by which Mcl‐1 regulates cancer‐specific apoptosis triggered by mda‐7/IL‐24, an IL‐10‐related cytokine. Cancer Res 2010; 70: 5034–45. [DOI] [PMC free article] [PubMed] [Google Scholar]
- 25. Whitsett TG, Mathews IT, Cardone MH et al Mcl‐1 mediates TWEAK/Fn14‐induced non‐small cell lung cancer survival and therapeutic response. Mol Cancer Res 2014; 12: 550–9. [DOI] [PMC free article] [PubMed] [Google Scholar]
- 26. Thomas LW, Lam C, Edwards SW. Mcl‐1; the molecular regulation of protein function. FEBS Lett 2010; 584: 2981–9. [DOI] [PubMed] [Google Scholar]
- 27. Liu H, Yang J, Yuan Y et al Regulation of Mcl‐1 by constitutive activation of NF‐kappaB contributes to cell viability in human esophageal squamous cell carcinoma cells. BMC Cancer 2014; 14: 98. [DOI] [PMC free article] [PubMed] [Google Scholar]
- 28. Yu X, Li W, Xia Z et al Targeting MCL‐1 sensitizes human esophageal squamous cell carcinoma cells to cisplatin‐induced apoptosis. BMC Cancer 2017; 17: 449. [DOI] [PMC free article] [PubMed] [Google Scholar]


