

Abstract
The transport of N‐methyl‐d‐aspartate receptors (NMDARs) is crucial for neuronal plasticity and synapse formation. Here, we show that KIF3B, a member of the kinesin superfamily proteins (KIFs), supports the transport of vesicles simultaneously containing NMDAR subunit 2A (NR2A) and the adenomatous polyposis coli (APC) complex. Kif3b +/− neurons exhibited a reduction in dendritic levels of both NR2A and NR2B due to the impaired transport of NR2A and increased degradation of NR2B. In Kif3b +/− hippocampal slices, electrophysiological NMDAR response was found decreased and synaptic plasticity was disrupted, which corresponded to a common feature of schizophrenia (SCZ). The histological features of Kif3b +/− mouse brain also mimicked SCZ features, and Kif3b +/− mice exhibited behavioral defects in prepulse inhibition (PPI), social interest, and cognitive flexibility. Indeed, a mutation of KIF3B was specifically identified in human SCZ patients, which was revealed to be functionally defective in a rescue experiment. Therefore, we propose that KIF3B transports NR2A/APC complex and that its dysfunction is responsible for SCZ pathogenesis.
Keywords: KIF3B, neuronal plasticity, NMDAR, NR2A, schizophrenia
Subject Categories: Membrane & Intracellular Transport, Molecular Biology of Disease, Neuroscience
Simultaneous vesicular transport of NMDAR subunit 2A and the adenomatous polyposis coli (APC) complex in neuronal dendrites depends on Kif3b and is disrupted by schizophrenia‐linked mutations.
Introduction
Neurons are highly polarized cells. They transmit and receive signals via their dendrites, axons, and synapses, which are fundamental for brain functions. To maintain neuronal functions, essential neurotransmitter receptors must be transported to synapses (Guillaud et al, 2003). Some kinds of receptors are carried by kinesin superfamily proteins (KIFs), which move along microtubules powered by the hydrolysis of adenosine triphosphate (ATP) (Hirokawa et al, 2010). For instance, N‐methyl‐d‐aspartate receptor (NMDAR) subunit 2B is transported by KIF17 to synapses, which is essential for NMDAR‐related functions such as learning and memory (Wong et al, 2002; Yin et al, 2011, 2012).
NMDAR channels consist of NR1, NR2 (A, B, and C), and NR3, which serve as a switch for memory formation by gating synaptic plasticity (Nakanishi, 1992; Lau & Zukin, 2007). Indeed, the activation of NMDARs is required for both long‐term potentiation (LTP) and long‐term depression (LTD) (Hrabetova & Sacktor, 1997; Bartlett et al, 2007). The dynamic regulation and the combination of NR2A and NR2B subunits are critical to determine the biophysical properties of NMDARs (Monyer et al, 1994; Yashiro & Philpot, 2008). NR2A is known to compose a complex with PSD95 and APC (Yanai et al, 2000), and APC is required for the clustering of PSD95 in hippocampal neurons (Shimomura et al, 2007). Although it is suggested that NR2A is transported via a pathway different from that of NR2B (Barria & Malinow, 2002; Yin et al, 2012), the responsible molecular motor is still elusive.
Schizophrenia (SCZ) is one of the most common neurodevelopmental disorders and is tightly linked to a variety of genetic factors. SCZ‐associated genes detected by genome‐wide research encode molecules related to synaptogenesis, synaptic transmission, and synaptic plasticity (Gilman et al, 2012; Papaleo et al, 2016), suggesting that the dysregulation of synaptic function underlies the phenotypes of SCZ (Lee & Green, 2016). Indeed, decreased NMDAR expression is known to cause a SCZ‐like phenotype (Dean et al, 1999).
KIF3B is a member of the KIFs (Miki et al, 2001) and forms a heterodimer with KIF3A (Yamazaki et al, 1995; Takeda et al, 2000; Hirokawa et al, 2009). This heterodimer binds to kinesin superfamily‐associated protein 3 (KAP3), thus forming a heterotrimeric (KIF3A/KIF3B/KAP3) complex (KIF3 complex) (Yamazaki et al, 1996; Ichinose et al, 2015). Loss of function of the KIF3 complex results in randomized left‐right determination in mouse embryos at 8.5 days postcoitum (d.p.c) (Nonaka et al, 1998; Takeda et al, 1999) and the development of brain tumors in embryos (Teng et al, 2005). Moreover, recently, KIF3B mutations were identified in SCZ patients (Fromer et al, 2014; Purcell et al, 2014). However, little is known about its function and the cargoes transported in neuronal axons and dendrites despite its abundant expression in neurons. Thus far, adenomatous polyposis coli (APC) has been reported to be a binding partner of the KIF3B complex (Jimbo et al, 2002; Teng et al, 2005) and is essential for the development of neuronal circuits (Senda et al, 2005; Votin et al, 2005; Sweet et al, 2011; Mohn et al, 2014).
In this study, we provide evidence suggesting that KIF3B transports NR2A and APC‐containing vesicles in hippocampal neurons. We demonstrate that attenuation of normal KIF3B levels in brain leads to critical changes in neuronal structure and function, which was failed to be restored by the tail‐truncated KIF3B protein identified in human SCZ patients. Importantly, this altered structure and function of synapses caused by a reduction in KIF3B result in defects in behaviors, which broadly share characteristic features of SCZ.
Results
The KIF3 molecular motor interacts with NR2A and APC
We have previously reported that the NR2B subunit of NMDA receptors is transported by a molecular motor KIF17 along microtubules in dendrites (Setou et al, 2000; Yin et al, 2011, 2012). Transport of NR2A has been shown to be intact even in the absence of KIF17, which suggests that NR2A is transported by a different mechanism from that mediated by KIF17. Here, using mouse brain lysates, we found that NR2A was specifically immunoprecipitated by an anti‐KIF3B antibody (Fig 1A), and KIF3A, KIF3B, and KAP3A were specifically immunoprecipitated by an anti‐NR2A antibody (Fig 1B). These data suggested that KIF3A/KIF3B/KAP3 complex dominantly interacted with NR2A, rather than NR2B, proposing that KIF3B transports NR2A. We also found that KIF3B, KIF3A, KAP3A, NR2A, and PSD95 were all immunoprecipitated by an anti‐APC antibody (Fig 1C), which suggested an interaction of these proteins with APC as a complex. Throughout the following experiments, we used Kif3b +/− mutant mice to investigate the function of KIF3B because Kif3b −/− mutant mice lack adequate levels for analysis of neuronal function due to their lethality at 10.5 d.p.c. (Nonaka et al, 1998).
Figure 1. KIF3B binds to the NR2A complex.
-
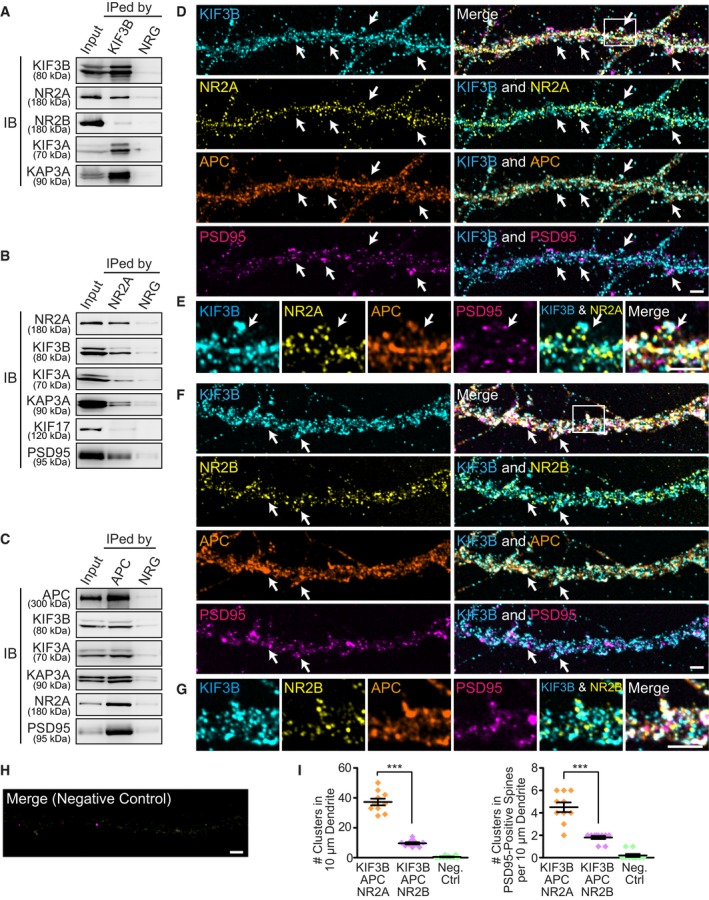
A–CCo‐immunoprecipitation (IP) of mouse whole brain extracts with an anti‐KIF3B antibody (A); and their vesicle co‐IP with an anti‐NR2A antibody (B) and an anti‐APC antibody (C); with normal rabbit IgG (NRG) as a control, immunoblotted (IB) against the indicated antibodies. n = 4. See Source data for Figure 1.
-
D–IImmunofluorescence microscopy showing the intracellular colocalization of KIF3B, APC, and NR2A (D and E) or NR2B (F and G) in PSD95‐positive spines of the dissociated hippocampal neurons with a negative control (H) and statistics (I). Arrows, positions of colocalization. Squares in (D) and (F), magnified regions in (E and G), respectively. Scale bars, 2 μm. Center and error bars show mean ± SEM. n = 10. ***P < 0.001; Student's t‐test.
Source data are available online for this figure.
Immunocytochemistry using cultured hippocampal neurons of Kif3b +/+ mice showed that KIF3B puncta were colocalized with APC and NR2A in dendritic shafts (Fig 1D) and in PSD95‐positive spines (Fig 1E). The number of colocalizing puncta containing KIF3B, APC, and NR2A in a 10 μm Kif3b +/+ dendrite was significantly higher than that containing KIF3B, APC, and NR2B (Fig 1F–I).
KIF3B is essential for the postsynaptic localization of NR2A and NR2B in hippocampal neurons
Immunoblotting of crude extracts of the Kif3b +/− mouse brains showed a decrease in the expression levels of KIF3B, NR2A, NR2B, APC, and PSD95 and an increase in that of β‐catenin, compared with those of the Kif3b +/+ brains (Fig 2A), suggesting the involvement of KIF3B function in both NR2A and NR2B. Levels of β‐actin, α‐tubulin, and KIF5B did not differ between the genotypes (Fig 2A).
Figure 2. Decreased expression of NR2A, NR2B, and APC in Kif3b +/− hippocampal neurons.
-
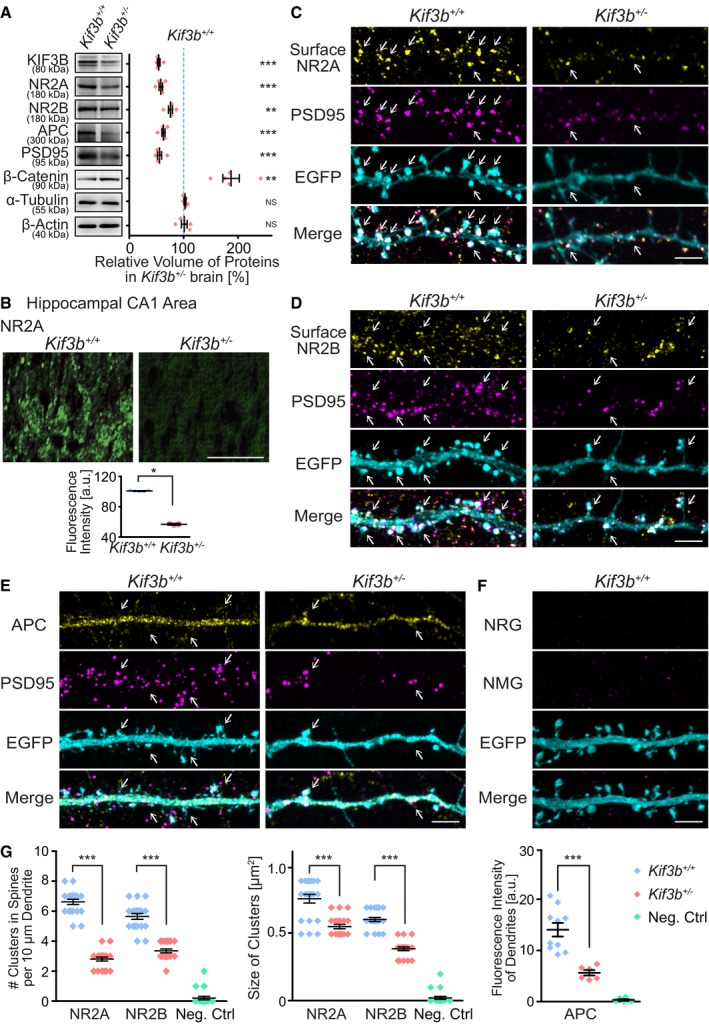
AImmunoblotting of adult mouse lysates of Kif3b +/+ and Kif3b +/− mice using the indicated antibodies with statistics. Protein volumes in Kif3b +/− brains were normalized with those in Kif3b +/+ brains and are expressed as the % of the control. Note that the expression levels of plasticity‐related proteins (NR2A, NR2B, and PSD95) and a KIF3‐associated protein (APC) were decreased, whereas that of β‐catenin was increased. Center and error bars show mean ± SEM. n = 5. NS, P ≥ 0.05; **P < 0.01; ***P < 0.001; one‐way ANOVA. See Source data for Figure 2.
-
BImmunofluorescence histochemistry of the hippocampal CA1 apical area of Kif3b +/+ and Kif3b +/− mouse brain coronal sections using an anti‐NR2A antibody and statistics for the fluorescence intensity. Scale bar, 50 μm. Center and error bars show mean ± SEM. n = 5. *P < 0.05; paired t‐test.
-
C–GRepresentative micrographs of distal dendrites of dissociated hippocampal neurons at DIV 16–18, immunostained against surface NR2A (C), surface NR2B (D), and cytoplasmic APC (E), accompanied by a negative control with normal rabbit and mouse IgGs (NRG and NMG, respectively in F), and statistics for the density and size of the surface NR2A‐ and NR2B‐positive clusters and the fluorescence intensity of APC (G). Neurons were permeabilized only in APC staining (E). Note that in Kif3b +/− neurons, the cluster size and density of both NR2A and NR2B, and the APC expression level were affected compared with Kif3b +/+ neurons. Arrows, signals at PSD95‐positive spines. Scale bars, 5 μm. Center and error bars show mean ± SEM. n = 20–21. ***P < 0.001; Student's t‐test. See Fig EV1.
Source data are available online for this figure.
The expression of NR2A was significantly decreased in the hippocampal CA1 apical dendritic area of Kif3b +/− mouse brains, suggesting that KIF3B was involved in the postsynaptic localization of NR2A (Fig 2B).
Therefore, we further investigated the localization of NR2A, NR2B, and APC using semi‐superresolution immunocytochemistry of dissociated hippocampal neurons. In a non‐permeabilized condition, we clearly visualized NR2A‐ or NR2B‐containing patches located on the surface of dendritic spines that were counter‐labeled by EGFP and an anti‐PSD95 antibody (Fig 2C and D). The density and size of these patches in Kif3b +/− dendrites were significantly smaller than those in Kif3b +/+ control dendrites (Fig 2C, D and G). This reduction in surface NR2A levels in Kif3b +/− neurons was reproduced by a Kif3b knockdown experiment using wild‐type dissociated hippocampal neurons (Fig EV1). In a permeabilized condition, APC expression level in Kif3b +/− spines was also significantly smaller than that in Kif3b +/+ neurons (Fig 2E–G).
Figure EV1. Cellular knockdown of Kif3b gene reduced surface NR2A expression (Related to Figs 2 and 7).
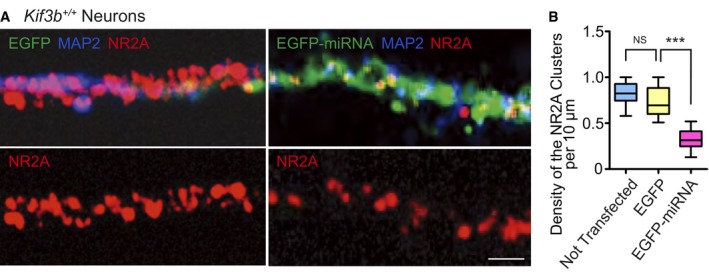
Representative micrographs of dissociated hippocampal neurons transfected with EGFP or EGFP‐tagged Kif3b‐miRNA vector, immunostained for NR2A and MAP2 (A), with statistics for the density of NR2A clusters (B). Scale bar, 10 μm. Boxplots represent median, first, and third quartiles, and whiskers represent minimum to maximum. n = 32 neurons from 12 mice. NS P ≥ 0.05; ***P < 0.001; one‐way ANOVA. See Figs 2C and G, and 7C and D.
Role of KIF3B in the dynamics of NR2A and NR2B in dendrites
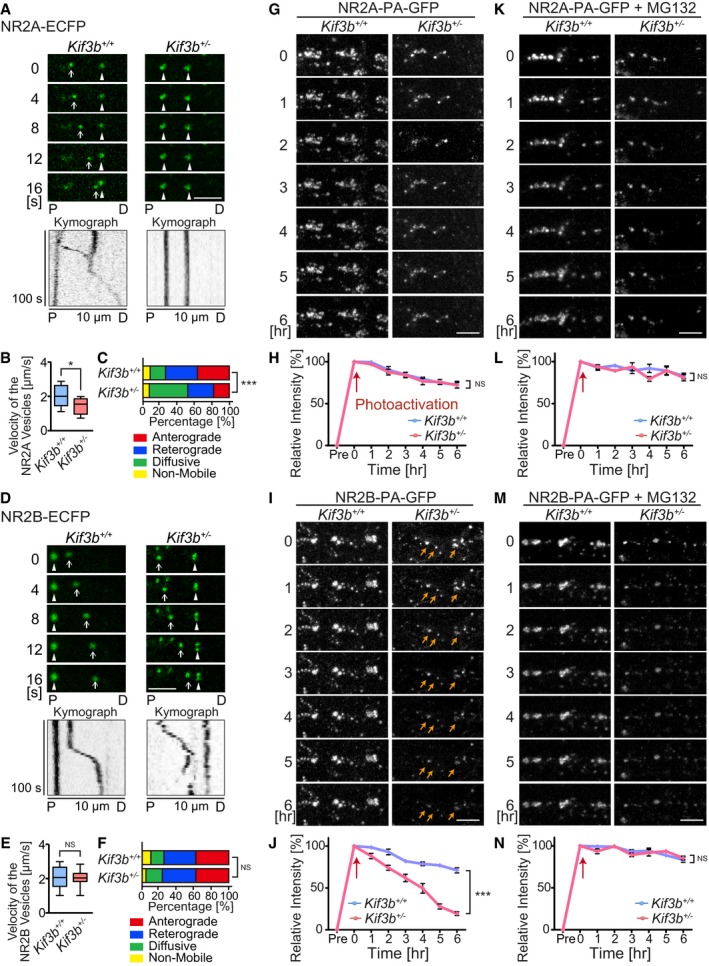
To examine the possible changes in dynamics of NR2A and NR2B in Kif3b +/− neurons, fluorescently tagged NR2A and NR2B were, respectively, introduced into Kif3b +/+‐ and Kif3b +/−‐dissociated hippocampal neurons and observed by time‐lapse live imaging (Fig 3A–F). The mean velocity of NR2A‐ECFP vesicles was decreased, but that of NR2B‐ECFP vesicles remained unchanged in Kif3b +/− dendrites (Fig 3B and E). The percentage of anterogradely or retrogradely moving vesicles labeled by NR2A‐ECFP was significantly decreased in Kif3b +/− neurons, but that of NR2B‐ECFP remained largely unchanged (Fig 3C and F). These data suggested that KIF3B was involved in the transport of NR2A rather than that of NR2B.
Figure 3. KIF3B transports NR2A, but not NR2B.
-
A–FTime‐lapse imaging of NR2A‐ECFP (A–C) and NR2B‐ECFP (D–F) along dendrites of dissociated hippocampal neurons, represented by the kymographs (A and D), and statistics for the velocity (B and E) and directionality of the vesicles (C and F). Note that the transport of NR2A vesicles, but not that of NR2B vesicles, was affected in Kif3b +/− neurons. Scale bars, 5 μm. P, proximal; D, distal region of the dendrite. Arrows, anterogradely moving vesicles; arrowheads, non‐mobile or diffusing vesicles. Boxplots in (B and E) represent median, first, and third quartiles, and whiskers represent minimum to maximum. n = 240–316 vesicles from 18 neurons. NS P ≥ 0.05; *P < 0.05; ***P < 0.001; Student's t‐test (B and E) and chi‐square test (C and F).
-
G–NTime‐lapse fluorescence images of NR2A (G and K)‐ or NR2B‐PA‐GFP‐expressing dissociated hippocampal neurons (I and M), in the absence (G and I) or in the presence of proteasome inhibitor, MG132 (K and M), and statistics showing the time course of degradation along dendrites at 1‐h intervals after photoactivation at time 0 (H, J, L, and N). Note that this proteasomal degradation of NR2B‐PA‐GFP, but not NR2A‐PA‐GFP, in Kif3b +/− dendrites, occurred in a significantly faster rate than in Kif3b +/+ dendrites. Orange arrows in micrographs, degrading clusters stimulated by photoactivation; red arrows in statistics, time point of photoactivation. Scale bars, 5 μm. Error bars show mean ± SEM. n = 10. ***P < 0.001; two‐way ANOVA. See Fig EV2.
Next, to investigate the possible reason for the decreased levels of NR2A and NR2B in Kif3b +/− neurons (Fig 2), we compared the stability of both NR2A and NR2B between Kif3b +/+ and Kif3b +/− neurons using NR2A/2B expression vectors tagged with photoactivatable green fluorescent protein (PA‐GFP). We introduced NR2A‐PA‐GFP or NR2B‐PA‐GFP into hippocampal neurons and examined the changes in signal intensities of clusters along dendrites or in the cell body every hour after photoactivation at time 0 (Figs 3G–N and EV2). In Kif3b +/− dendrites, the decay time course of fluorescence intensity of NR2B‐PA‐GFP clusters was significantly and specifically accelerated (Fig 3G–J). Because this decay was inhibited by the application of the proteasome inhibitor MG132, it was considered due to ubiquitin‐proteasomal degradation (Fig 3K–N). Its acceleration in Kif3b +/− dendrites might be explained by mistargeting of free NR2B proteins to the degradation pathway due to the significant decrease in NR2B binding partners including NR2A, APC, and PSD95 (Fig 2; Kim et al, 2005; Sheng et al, 1994; Yanai et al, 2000). In Kif3b +/− neuronal cell bodies, the decay time course of fluorescence intensity of NR2A‐PA‐GFP signal was significantly and specifically decelerated (Fig EV2). This may be because the accumulation of non‐transported NR2A in Kif3b +/− neuronal cell bodies saturates the degradation machinery. Due to these possible mechanisms, specific decrease in NR2A transport in Kif3b +/− neurons may provide site‐specific changes in degradation kinetics of each NMDA receptor in a differential manner. Interestingly, a complementary phenotype was previously observed in the case of NR2B‐transporting KIF17‐deficient neurons (Yin et al, 2011), assuring the universality and consistency of this phenomenon.
Figure EV2. Degradation analysis of NR2A‐ or NR2B‐PA‐GFP in cell body (Related to Fig 3).
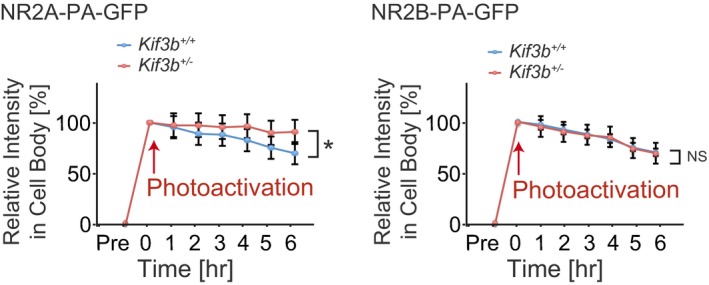
Time‐lapse fluorescence statistics of NR2A‐ or NR2B‐PA‐GFP‐expressing dissociated hippocampal neurons showing the time course of degradation in cell body at 1‐h intervals after photoactivation at time 0. Red arrows, time point of photoactivation. Error bars show mean ± SEM. n = 10. NS P ≥ 0.05; *P < 0.05; two‐way ANOVA. See Fig 3G–N.
Altered spine morphology and synapse function of Kif3b +/− neurons
Because NR2A, NR2B, and APC are firmly connected to the morphology and function of dendritic spines (Rao & Craig, 1997; Lau & Zukin, 2007; Akashi et al, 2009), we examined the influence of KIF3B deficiency on spine morphology. We examined dissociated hippocampal neurons transfected with EGFP (Fig 4A) and classified the spine morphology into stubby, mushroom, long‐thin, and filopodia spines as described previously (Kasai et al, 2003; Haws et al, 2014; Fig 4B). In Kif3b +/− neurons, the density of stubby spines was significantly decreased, but that of a mushroom spine was slightly increased (Fig 4A and B). The number of spinules on top of the head of mushroom spines was significantly increased in Kif3b +/− neuronal dendrites, and the mean head size and length of the neck were also increased in Kif3b +/− mushroom spines (Fig 4C).
Figure 4. KIF3B is essential for synaptic plasticity.

-
A–CFluorescence micrographs of EGFP‐expressing Kif3b +/+ and Kif3b +/− dendrites of dissociated hippocampal neurons at DIV 17 (A), accompanied by the statistics for the total and classified spine numbers per 40 μm dendrite (B) and morphological features including the number of spinules, head size, and neck size (C). Note that the number of stubby and filopodial spines was decreased and that of mushroom spines was increased in Kif3b +/− neurons. Scale bars, 10 μm. Center and error bars show mean ± SEM. n = 446–642 spines of 18 neurons from five mice. NS P ≥ 0.05; *P < 0.05; **P < 0.01, ***P < 0.001; Student's t‐test.
-
D–GElectrophysiological analysis of Schaffer collateral–CA1 synapses in acute hippocampal slices from Kif3b +/+ and Kif3b +/− mice. (D and E) Synaptic NMDA currents over AMPA currents recorded at +40 mV and −90 mV EPSCs, respectively with the representative traces (D) and current–voltage relationships of NMDAR channel currents recorded in Kif3b +/+ and Kif3b +/− slices (E). Current amplitudes were normalized to the values at +40 mV EPSC. Note that the synaptic NMDA currents were reduced in Kif3b +/− slices. Center and error bars show mean ± SEM. n = 12 cells from six mice. NS P ≥ 0.05; ***P < 0.001; Student's t‐test (D) and two‐way ANOVA (E). (F and G) Synaptic plasticity indicated by time course of the fEPSP slopes, with induction of LTP by high‐frequency stimulation (F) and of LTD by low‐frequency stimulation (G). Error bars show mean ± SEM. n = 9 slices from nine mice. ***P < 0.001; two‐way ANOVA.
Next, we conducted electrophysiological analysis to examine the possible changes in synaptic function of Kif3b +/− mutant mice. Schaffer collateral–CA1 synapses of acute slices of the hippocampus of both genotypes were tested. The NMDAR‐mediated excitatory postsynaptic currents (EPSCs) expressed as the ratio of NMDA to AMPA amplitudes were significantly reduced in Kif3b +/− slices (Fig 4D). The current–voltage relationships of NMDAR channel currents were not different between Kif3b +/+ and Kif3b +/− slices (Fig 4E). We compared two types of NMDAR‐dependent forms of synaptic plasticity in field excitatory postsynaptic potentials (fEPSPs): long‐term potentiation (LTP) and long‐term depression (LTD). The extent of LTP was increased and that of LTD was significantly decreased in Kif3b +/− slices compared with Kif3b +/+ slices (Fig 4F and G). Such a pattern of alteration of activity‐dependent synaptic plasticity, a combination of higher levels of LTP and lower levels of LTD, was quite similar to the previously reported phenotypes in animal models of SCZ (Savanthrapadian et al, 2013; Bhandari et al, 2016; Morimura et al, 2017; Thaxton et al, 2018).
Schizophrenia‐like behavioral abnormalities in Kif3b +/− mice
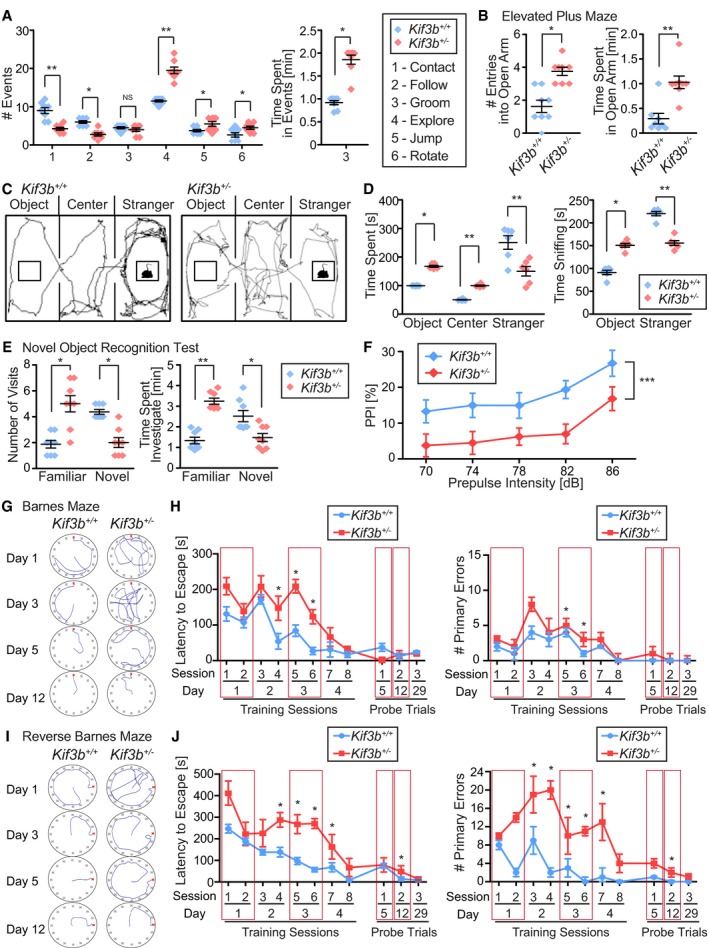
These characteristic features of abnormal neuronal plasticity with decreased transport of NR2A in Kif3b +/− neurons prompted us to investigate the behavior of mutant mice. We carried out a series of behavioral analyses (Fig 5). In an open field test, we compared the social interaction frequency between Kif3b +/+ and Kif3b +/− genotypes. Kif3b +/− mice exhibited lower social activity (contact and follow) than Kif3b +/+ mice. They exhibited a higher level of exploratory behavior and repetitive behavior such as jumping and rotating activity, and they spent more time for grooming, suggesting the existence of locomotion hyperactivity (Fig 5A). In an elevated plus‐maze test, Kif3b +/− mice spent a much longer time in the open arms than Kif3b +/+ control mice, suggesting a lower level of anxiety (Fig 5B). To further confirm the impairment in social interest of Kif3b +/− mice, we performed a three‐chamber type of social interaction test, in which the Kif3b +/− mice again exhibited a lower level of social interest (Fig 5C and D). In a novel object recognition test, Kif3b +/− mice showed less interest in the novel object than Kif3b +/+ mice, suggesting an alteration of the cognitive function of Kif3b +/− mice (Fig 5E). In a prepulse inhibition test, although the acoustic startle response was similar between Kif3b +/+ and Kif3b +/− mice (Fig EV3), the extent of inhibition with the prepulse in Kif3b +/− mice was significantly smaller than that in Kif3b +/+ mice (Fig 5F). In a Barnes maze test, Kif3b +/− mice took a longer time to remember a position of escape (training sessions and probe trial Day 5; Fig 5G and H). However, once they recognized the position, they sustained the memory (probe trial Days 12 and 29; Fig 5G and H), suggesting that Kif3b +/− mice had impaired spatial memory formation but could maintain long‐term memory. In a reverse Barnes maze test, Kif3b +/− mice took a significantly longer time to reach the new position of escape, suggesting a potentially lower learning flexibility which was consistent with other mouse models of SCZ (Fig 5I and J; Manago et al, 2016; Savanthrapadian et al, 2013).
Figure 5. Kif3b +/− mice exhibit schizophrenia‐like behaviors.
-
ASocial interaction test using two unfamiliar adult male mice. The numbers of indicated events (#1–6) in a 10‐min trial were manually counted. Note that Kif3b +/− mice exhibited impaired social interest. Center and error bars show mean ± SEM. n = 8. NS P ≥ 0.05; *P < 0.05; **P < 0.01; Student's t‐test.
-
BElevated plus‐maze test. Note that Kif3b +/− mice exhibited decreased anxiety and elevated activity. Center and error bars show mean ± SEM. n = 8. *P < 0.05; **P < 0.01; Student's t‐test.
-
C, DThree‐chambered sociability test with an object, center, and a stranger mouse in the same object areas (C), accompanied by statistics (D). Note that Kif3b +/− mice spent less time in the stranger area. Black lines in area (C), representative traces of mouse movement in 10 min of the trial. Center and error bars show mean ± SEM. n = 6. *P < 0.05; **P < 0.01; Student's t‐test.
-
ENovel object recognition test. Note that Kif3b +/− mice exhibited less interest to the novel object compared with the Kif3b +/− mice. Center and error bars show mean ± SEM. n = 8. *P < 0.05; **P < 0.01; Student's t‐test.
-
FPrepulse inhibition (PPI) test. Note that Kif3b +/− mice exhibited decreased inhibition in the startle response. Pulse intensity was set to 115 dB. n = 28. ***P < 0.001; two‐way ANOVA. See Fig EV3.
-
G–JBarnes maze test showing spatial reference memory (G and H) and reverse Barnes maze test showing learning flexibility (I and J) of both genotypes, with representative traces of the mouse movements (G and I) and statistics for latency to escape and number of primary errors during the training sessions and probe trials (H and J). Note that Kif3b +/− mice required a longer period of time to acquire spatial memory but showed a similar ability to sustain memory compared with Kif3b +/+ mice. Red boxes in H and J, corresponding to the trial traces presented in (G) and (I). Error bars show mean ± SEM. n = 6. *P < 0.05; Student's t‐test.
Figure EV3. Normal response of Kif3b +/− mice in acoustic startle response (ASR) test (Related to Fig 5).
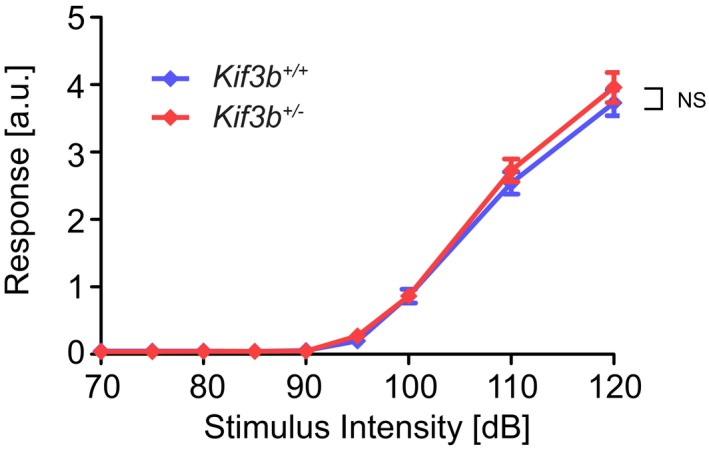
Kif3b +/− mice exhibited similar curve in ASR test with Kif3b +/+ mice. Error bars show mean ± SEM. n = 28. NS P ≥ 0.05; two‐way ANOVA. See Fig 5F.
Kif3b +/− mice exhibit schizophrenia‐like histological phenotypes
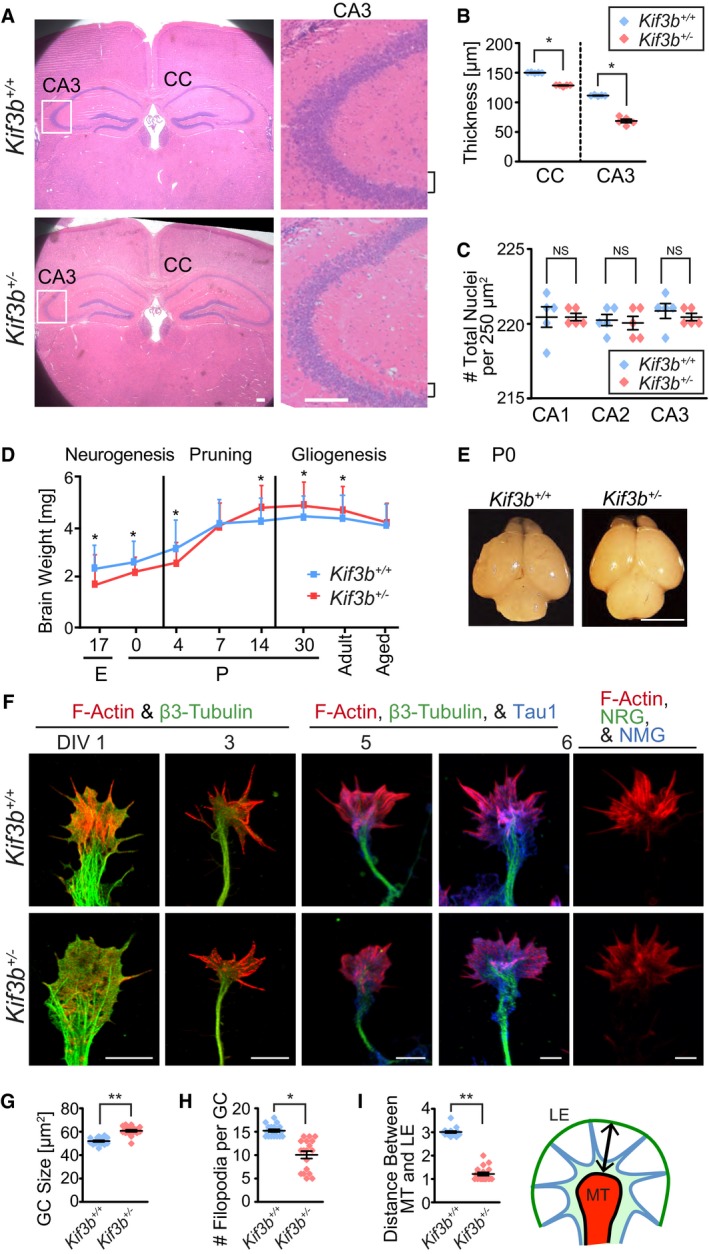
Next, we performed a histological examination. Serial paraffin sections of the brains were prepared, stained with HE, and examined. The thickness of corpus callosum (CC) and stratum radiatum in the hippocampal CA3 area of Kif3b +/− mice was significantly decreased (Fig 6A and B), which was consistent with previously described phenotypes in mouse models of SCZ and intellectual disabilities (Downhill et al, 2000; Gilbert & Brushfield, 2009; Rebola et al, 2017). The cellularity of the CA1, CA2, and CA3 regions remained unchanged between the Kif3b +/+ and Kif3b +/− genotypes (Fig 6C). The developmental profile of the whole brain weight in Kif3b +/+ and Kif3b +/− mice revealed that brain weight was lower in Kif3b +/− mice in the early developmental stage (Fig 6D and E) but increased in the “pruning period” after postnatal day (P) 14 (Fig 6D). This developmental profile of brain weight is also similar to that of SCZ mouse brains (Boksa, 2012; Alexander‐Bloch et al, 2014; Byars et al, 2014).
Figure 6. Abnormal histology of Kif3b +/− mouse brains.
-
A–CHematoxylin–eosin (HE) staining of adult mouse brain coronal sections and magnified images of hippocampal CA3 area of the indicated genotypes (A), accompanied by statistics (B and C). Squares in the left panels, magnified regions in the right panels; CC, corpus callosum; brackets, stratum radiatum in hippocampal CA3 area. Scale bars, 100 μm. Center and error bars show mean ± SEM. n = 5. NS P ≥ 0.05; *P < 0.05; Student's t‐test.
-
D, EDevelopmental profile of mouse brain weight throughout the neurogenesis, pruning, and gliogenesis phases, from embryonic day 17 (E17) to aged (D), and representative appearance of the brains at postnatal day 0 (P0; E). Scale bar, 5 mm. Error bars show mean ± SEM. n = 5. *P < 0.05; Student's t‐test.
-
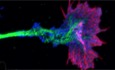
F–IImmunofluorescence merged micrographs stained against F‐actin (red) and β3‐tubulin (green), focusing on the morphology and development of the axonal growth cone (GC) from DIV 1, 3, 5, and 6 of the dissociated hippocampal neurons (F), accompanied by statistics (G–I). Arrow in (I), measured distance between MT domain and LE. MT, microtubule; LE, leading edge; NRG, normal rabbit IgG; NMG, normal mouse IgG. Scale bars, 5 μm. Center and error bars show mean ± SEM. n = 18. *P < 0.05; **P < 0.01; Student's t‐test. See Fig EV4 for the individual color images.
Abnormal growth cone morphology of Kif3b +/− neurons
To clarify the cellular basis of the SCZ‐like behavioral and histological features, we observed the hippocampal dissociated cultured neurons of both genotypes. F‐actin and β3‐tubulin were tagged using fluorescent phalloidin and an anti‐β3‐tubulin antibody, respectively (Figs 6F and EV4). The mean size of the growth cone in Kif3b +/− neurons was slightly but significantly enlarged (Fig 6G). The number of filopodia on the growth cone was significantly decreased in Kif3b +/− neurons (Fig 6H). The width of the growth cone, represented by the distance between leading edge (LE) and the periphery of the microtubule domain (MT), was significantly shortened in Kif3b +/− neurons (Fig 6I). These growth cone phenotypes suggested a possibility that KIF3B is also involved in axonal functions.
Figure EV4. Axon tip morphology of Kif3b +/+ and Kif3b +/− neurons (Related to Fig 6).
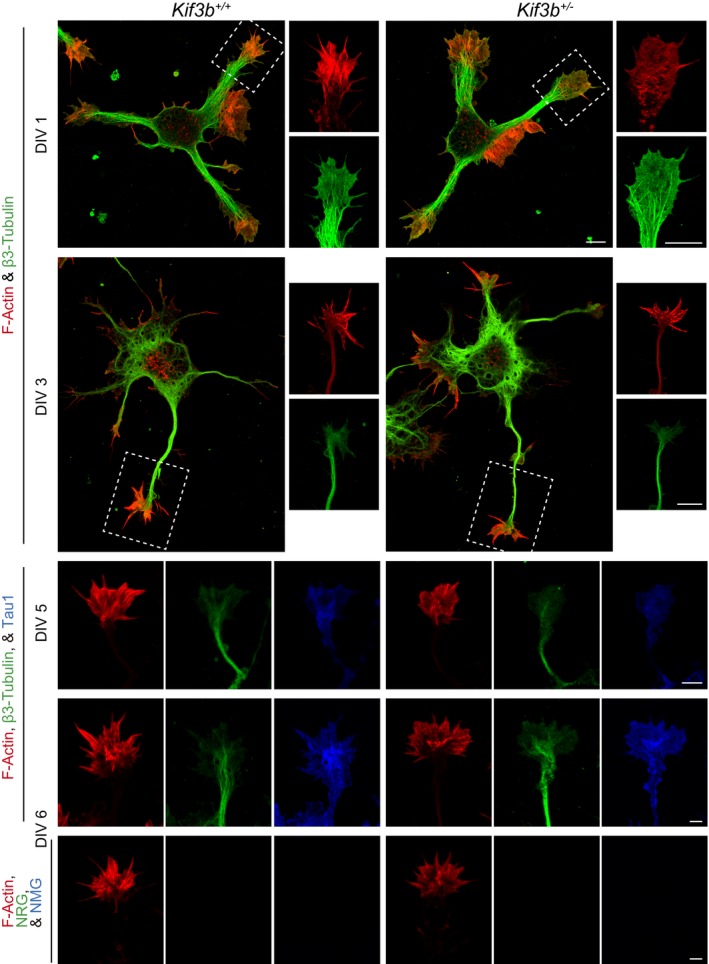
Individual immunofluorescence micrographs of dissociated hippocampal neurons at DIV 1, 3, 5, and 6, stained for F‐actin (red), β3‐tubulin (green), and tau1 (blue in DIV 5 and 6). Dotted square in panels of DIV 1 and 3, magnified axon tip in the right panels. Scale bars, 5 μm. n = 18. See Fig 6F–I for the merged images.
Mutated KIF3B in human schizophrenia patients was functionally impaired in a rescue assay
We searched SCZ‐specific mutations in human KIF3B‐related genes using the exome sequence GeneBook database (Fromer et al, 2014; Purcell et al, 2014) and identified a significant Arg654Ter nonsense mutation in KIF3B‐encoding region carrying a deletion of a C‐terminal domain, as well as SCZ‐specific mutations in KIF3A, KAP3, and NR2A genes (Table EV1 and Fig EV5A). This KIF3B mutation was heterozygously identified in only one out of 2,000 SCZ patients but none of the 2,000 normal controls in a Swedish case–control study (Purcell et al, 2014). This mutation appeared to be very rare because it was present in only one of the 119,956 unscreened controls from the Exac database and none of the approximately 3,000 unscreened controls from the Tommo database, suggesting that this mutation could affect pathogenesis in a portion of the SCZ patient population.
Figure EV5. Schizophrenia‐specific mutations and spine morphology of Empty‐EYFP, KIF3B‐EYFP, or KIF3Bmut‐EYFP‐transfected Kif3b +/+ and Kif3b +/− neurons (Related to Fig 7).
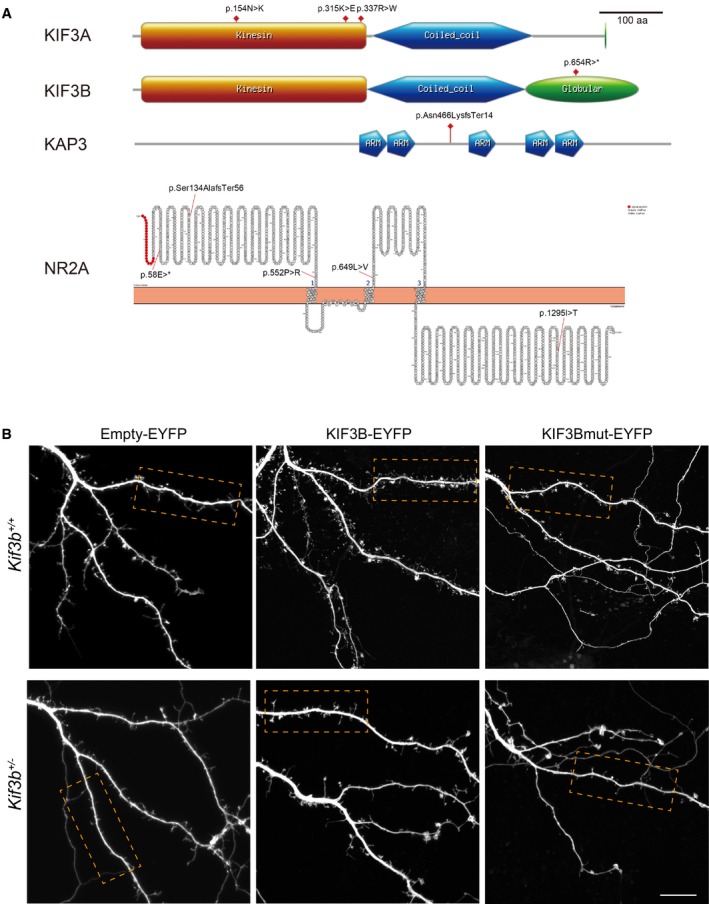
- Schematic view of SCZ‐specific mutations in the human exome sequence database. Drawn by PROSITE (https://prosite.expasy.org/) and Protter (http://wlab.ethz.ch/protter/start/).
To confirm the physiological relevance of this KIF3B mutation in SCZ‐like phenotypes, we conducted rescue experiments of spine morphology and surface NR2A levels using dissociated hippocampal neurons of both genotypes (Fig 7A–D).
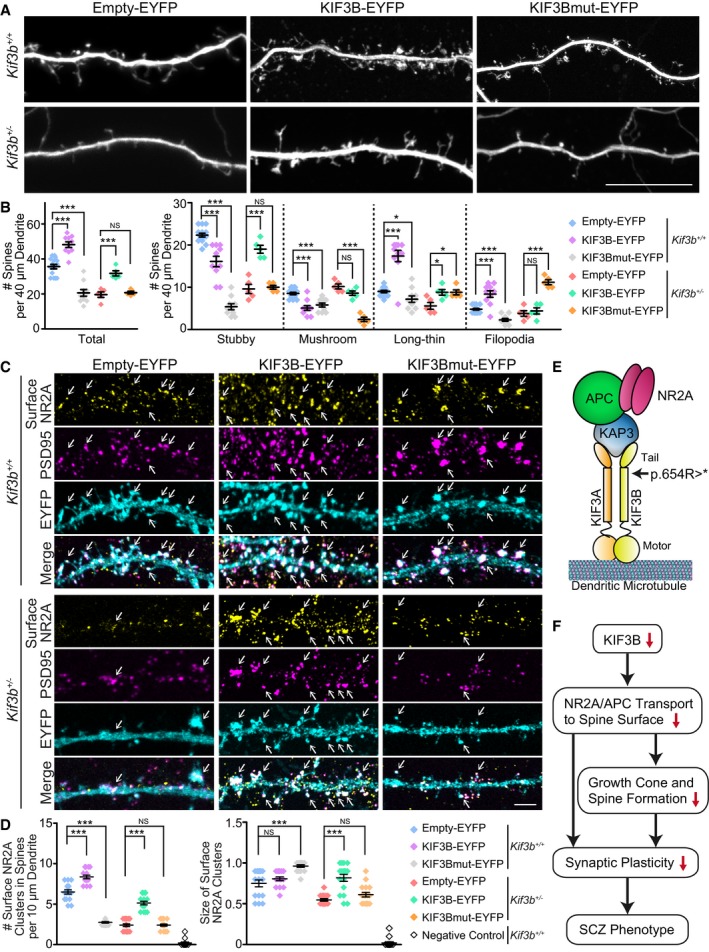
Figure 7. The expression of KIF3B, but not mutated KIF3B, restores spine morphology and NR2A surface expression.
-
A, BFluorescence micrographs of Empty‐EYFP, KIF3B‐EYFP, or KIF3Bmut‐EYFP vector‐expressing Kif3b +/+ and Kif3b +/− dendrites in dissociated hippocampal neurons at DIV 16–18 (A), accompanied by statistics for the total and classified spine number per 40 μm dendrite (B). Scale bars, 10 μm. Center and error bars show mean ± SEM. n = 98–535 spines of 5–15 neurons from three mice. NS P ≥ 0.05; *P < 0.05; ***P < 0.001; Student's t‐test. See Fig EV5.
-
C, DImmunofluorescence micrographs showing surface NR2A along Kif3b +/+ and Kif3b +/− dendrites of the dissociated hippocampal neurons at DIV 16–18, transfected with Empty‐EYFP, KIF3B‐EYFP, or KIF3Bmut‐EYFP vector. Arrows, signals at PSD95‐positive spines. Scale bar, 5 μm. Center and error bars show mean ± SEM. n = 16–17. NS P ≥ 0.05; ***P < 0.001; Student's t‐test. See Fig EV1.
- E, F
First, dendritic spines of the Kif3b +/− and Kif3b +/− neurons were observed at 2–3 days after the transfection (Figs 7A and B, and EV5B). KIF3B‐EYFP transfection significantly increased the number of spines along a 40‐μm dendrite compared with Empty‐EYFP transfection in both genotypes. However, KIF3Bmut‐EYFP expression vector carrying the Arg654Ter nonsense mutation did not rescue the total spine number of Kif3b +/− neurons, or even decreased that of Kif3b +/+ neurons (Fig 7B). Especially, stubby‐type spines that are largely functionally matured were significantly decreased by KIF3B deficiency. This was again rescued by KIF3B‐EYFP but not by KIF3Bmut‐EYFP.
Next, we examined the surface expression of NR2A using immunofluorescence microscopy (Fig 7C and D). The density and size of the NR2A‐positive clusters along a 40‐μm dendrite were significantly decreased in KIF3B‐deficient neurons. This phenotype was rescued by KIF3B‐EYFP expression, but not by Empty‐EYFP or KIF3Bmut‐EYFP expression (Fig 7D).
Accordingly, KIF3Bmut‐EYFP could not sufficiently restore the spine morphology or the surface level of NR2A in Kif3b +/− neurons, suggesting that this human KIF3B mutation in SCZ patients can provide SCZ‐causing functional defects in postsynapses (Fig 7E). These data collectively suggested that KIF3B transported the NR2A complex into the synapse surface and that the deficiency of this transport by the loss of KIF3B activity results in the spine malfunction, impaired synaptic plasticity, and neuropsychiatric disorders in SCZ (Fig 7F).
Discussion
Transport of the NR2A complex by the KIF3 complex
The intracellular transport of glutamate receptors along microtubule tracks is a fundamental process for maintaining synaptic plasticity for learning and memory (Hirokawa & Noda, 2008; Hirokawa et al, 2010; Takei et al, 2015). This process is served by microtubule‐based molecular motor complexes. For example, a protein complex containing KIF17, a member of the KIF family of molecular motors, has been reported to transport NR2B‐containing vesicles (Setou et al, 2000; Wong et al, 2002; Guillaud et al, 2003). However, it is not well understood how a variety of molecular motor proteins can be coordinated to form the basis for the transport of various subunits of NMDA receptors. Loss of function of KIF17 results in an impairment in the transportation of NR2B, but not that of NR2A (Yin et al, 2011, 2012), suggesting that another molecular motor might transport NR2A. In the current work, we showed that KIF3B forms a multimolecular complex with NR2A, APC, and PSD95 (Fig 1). Reduced KIF3B levels lead to altered transport of NR2A (Fig 2). Interestingly, a deficiency of KIF3B also alters the turnover of NR2B (Fig 3), in a similar manner to KIF17 knockout‐accelerated degradation of NR2A (Yin et al, 2011, 2012). The decay of NR2B was significantly accelerated in Kif3b +/− dendrites (Fig 3J).
We present herein a possible interaction among molecules making up the KIF3‐NR2A transport complex (Fig 1A–F). KIF3B forms a heterotrimer with KIF3A and KAP3 (Takeda et al, 2000; Hirokawa et al, 2009; Ichinose et al, 2015). KAP3 interacts with APC through an armadillo repeat (Senda et al, 2005), and APC has been reported to be a binding partner of the PSD95‐NR2A complex (Shimomura et al, 2007). Our data suggest that this protein complex is the basis of the transport of NR2A by the KIF3B motor along microtubules in dendrites (Fig 7E).
Schizophrenia (SCZ) spectrum disorder and Kif3b mutant mice
A variety of SCZ models have been generated by genetic engineering based on the mutations found in the genome of SCZ patients (Jones et al, 2011). Kif3b +/− mutant mice have consistent phenotypes with SCZ patients and with those mouse SCZ models, as revealed by behavioral, histological, and electrophysiological experiments. Kif3b +/− mutant mice showed a range of behavioral characteristics of SCZ: a reduction in the prepulse inhibition of acoustic startle response (Fig 5F; Maekawa et al, 2010; Ratajczak et al, 2013), a reduced level of social interactions (Fig 5A, C and D), an increased level of repetitive behaviors (grooming and rotation in Fig 5A), and a reduced level of anxiety (Fig 5B; Bannerman et al, 2014; Onouchi et al, 2014). In the reverse learning version of the Barnes maze, these mice exhibited reduced learning flexibility, also mimicking a phenotype of SCZ (Papaleo et al, 2016). Histologically, the thickness of the corpus callosum and stratum radiatum of hippocampal CA3 area was reduced in Kif3b +/− mice (Fig 6A and B). These histological features have been reported in other mouse models of SCZ (Downhill et al, 2000). Excessive weight gain of the Kif3b +/− whole brain during the pruning period of brain development also mimics the abnormal brain development of SCZ due to an impairment of synapse pruning (Boksa, 2012).
According to our database search for SCZ‐specific mutations in the human exome sequence, KIF3B was found to have a nonsense mutation (p.Arg654Ter). Functional defects in this KIF3B mutant protein revealed by the rescue assays for the spine number and morphology (Fig 7A and B) and for the surface NR2A expression (Fig 7C and D) provide experimental evidence for this mutation as a cause of human SCZ pathogenesis.
Molecular pathology in Kif3b +/− mouse brain
The question remained concerning the cause of the SCZ‐like phenotypes in Kif3b +/− mice. This is one of the first studies to show that Kif3b haploinsufficiency results in defects in the transport of NR2A to postsynaptic membranes (Figs 2B–D and 3A–D). One striking feature of the molecular pathology of Kif3b +/− neurons is the reduced level of synaptic NR2A, which is considered to contribute to the decreased response of NMDAR and the dysregulation of NMDA receptor‐dependent forms of synaptic plasticity, LTP, and LTD (Monyer et al, 1994; Bartlett et al, 2007; Yashiro & Philpot, 2008). In Kif3b +/− hippocampal slices, the level of LTP was found to be upregulated and that of LTD downregulated (Fig 4D–F). This type of alterations of LTP and LTD in hippocampal CA1 has been reported in many other animal models of SCZ (Savanthrapadian et al, 2013): LTP induced by high‐frequency stimulation is upregulated in Shank2∆ex7 mutant mouse brains (Schmeisser et al, 2012; Zhou et al, 2016). LTD induced by low‐frequency stimulation is downregulated in Mecp2 knockout mice and Tsc2 +/− rats (Asaka et al, 2006; Ehninger & Silva, 2011). LTD induced by DHPG has also been shown to be downregulated in Tsc2 +/− mice (Auerbach et al, 2011). This dysregulation of synaptic plasticity should represent a pathophysiological basis for schizophrenic behavioral phenotypes in these SCZ model animals.
The second feature of Kif3b +/− mice is the alteration in the function of APC complex; the level of APC was decreased and that of β‐catenin was increased in Kif3b +/− mouse brains (Fig 2A, E and F). The APC/β‐catenin complex is an essential regulator of the Wnt signaling pathway, which is critical for the formation of neuronal circuits (Cui et al, 2005; Votin et al, 2005; Mohn et al, 2014; Gonzalez et al, 2015). Recently, a link between Wnt signaling components and SCZ has been revealed (Gilman et al, 2012; Inestrosa et al, 2012; Singh, 2013; Byars et al, 2014; Mohn et al, 2014). Previous studies indicate that the stabilization of β‐catenin in the cortex, which elevates canonical Wnt signaling, leads to brain overgrowth due to increased cycling of neural progenitor cells and the production of postmitotic neurons (Teng et al, 2005; Chen et al, 2015). Thus, the present study will provide a new crosstalk mechanism between NR2A and Wnt signaling through KIF3‐mediated transport, which may accessorily affect the SCZ pathogenesis.
Accordingly, our study proposes a new SCZ pathogenesis mechanism through KIF3 dysfunction through genetic variation (Table EV1) or other factors such as epigenetic mechanisms or posttranslational modification (Ichinose et al, 2015), and an NR2A transport defect was likely to be involved in as its molecular mechanism. It is very striking to reveal how the cargo transport activity of the kinesin superfamily protein molecular motors regulates higher brain function and its pathology, and the present study will provide a good and stimulating framework for approaching this question.
Materials and Methods
Mice and behavioral analysis
All animal handling, housing, environmental settings, and nutritional designs were conducted under University of Tokyo's restrictions regarding animal experimentation. Kif3b gene targeting for the generation of Kif3b +/− mice and PCR genotyping to detect disruption of the Kif3b gene using the neo‐cassette have been described in a previous study (Nonaka et al, 1998). The Kif3b mutant mouse line was maintained by repeated backcrossing with C57BL/6J mice. Adult littermate male mice aged 3–6 months were used for the analysis, and the behavioral tests were performed in a single‐blinded fashion with 10 min of habituation time.
Social interaction test
The social interaction test was performed as previously described (Silverman et al, 2010). Two male mice with the same genotypes were placed at the center of the novel rectangular box, and their traces were videotaped for 10 min. Their reciprocal social interactions as nose contacts and repetitive behaviors were quantified with ICY and EthoVision software.
Elevated plus‐maze test
The elevated plus maze was performed as described previously (Holmes et al, 2000). Briefly, the male mice were placed at the center of the plus maze, and they were videotaped for 5 min. The number of entries into and the time spent in open arm were manually counted.
Three‐chambered sociability test
Three‐chambered sociability test was carried out as described previously (Silverman et al, 2010). Briefly, the rectangular box was divided into three rooms, with openings between them. Cages were set in two of them, and the center room was kept empty. After habituation to the box for 10 min, the mice encountered a never‐before‐met wild‐type male mouse in the cage for 10 min. The time spent in each room was calculated using EthoVision software.
Novel object recognition test
The novel object recognition test was performed as described previously (Yin et al, 2011). During training sessions, two identical objects were placed in the rectangular box and the mouse was allowed to explore freely for 15 min. Time spent exploring each object as nose contact was recorded. In retention tests, the mouse was placed back into the same cage, in which one of the familiar objects used during training was replaced by a novel object, and allowed to explore for 15 min. The number of visits and time spent exploring the familiar and novel object were recorded using EthoVision software.
The acoustic startle response test (ASR) and prepulse inhibition test (PPI)
ASR and PPI were performed as described previously (Maekawa et al, 2010). In ASR test, pulses were set at 70, 75, 80, 85, 90, 95, 100, 110, and 120 dB and startle responses at each pulse were recorded. In PPI test, prepulses (PP) were set at 70, 74, 78, 82, and 86 dB and pulse (P) was set at 115 dB. Percentage PPI was calculated as [(P amplitude − PP amplitude)/P amplitude] × 100. Any amplitudes excess mean ± 2 × SEM were excluded to calculate the value.
Barnes maze test
The procedure was performed as described previously (Rosenfeld & Ferguson, 2014). The training device was a round table with 16 holes around the circumference. Most of these holes lead to an open drop to the floor, but a single hole leads to a drop box with foods in it. The test consisted of 4 days of training sessions (two sessions each day) and probe trials on days 5, 12, and 29 from the start of the test. The latency to escape into the drop box and number of primary errors were monitored and counted using EthoVision software.
Antibodies
The primary antibodies used in this study were anti‐KIF3B polyclonal antibody (1:500, Takeda et al, 2000), anti‐KIF3A monoclonal antibody (1:500, 611508, BD Transduction Laboratories, RRID:AB_398968), anti‐KAP3A monoclonal antibody (1:500, 610637, BD Transduction Laboratories, RRID:AB_397967), anti‐KIF17 polyclonal antibody (1:500, Yin et al, 2011), anti‐KIF5B polyclonal antibody (1:500, RRID:AB_2571745, Kanai et al, 2000), anti‐NR2A (1:300, GluRe1C‐Rb‐Af542, Frontier Institute, RRID:AB_2571605) and anti‐NR2B polyclonal antibodies (1:300, GluRe2N‐Rb‐Af660, Frontier Institute, RRID:AB_2571761), anti‐APC polyclonal antibody (1:300, sc‐896, Santa Cruz Biotechnology, RRID:AB_2057493), anti‐PSD95 monoclonal antibody (1:500, MA1‐046, Thermo Fisher Scientific, RRID:AB_2092361), anti‐α‐tubulin monoclonal antibody (1:1,000, DM1A‐T9026, Sigma‐Aldrich, RRID:AB_477593), anti‐β3‐tubulin polyclonal antibody (1:500, T5076, Sigma‐Aldrich, RRID:AB_532291), anti‐MAP2 monoclonal antibody (1:200, HM2‐M4403, Sigma‐Aldrich, RRID:AB_477193), anti‐Tau‐1 monoclonal antibody (1:500, MAB3420, Millipore, RRID:AB_94855), anti‐β‐actin monoclonal antibody (1:1,000, AC15‐A5441, Sigma‐Aldrich, RRID:AB_476744), and anti‐β‐catenin monoclonal antibody (1:1,000, 610153, BD Biosciences, RRID:AB_397554).
Normal rabbit IgG (55944, Cappel/ICN/MP, RRID:AB_2334717) and normal mouse IgG (02‐6502, Thermo Fisher Scientific, RRID:AB_2532951) were used as negative controls. Alexa Fluor 405‐, 488‐, and 647‐conjugated goat anti‐mouse IgG fluorescent antibodies (1:500; A‐31553, RRID:AB_221604; A‐11029, RRID:AB_2534088; A‐21236, RRID:AB_2535805) and Alexa Fluor 488‐ and 568‐conjugated goat anti‐rabbit IgG fluorescent antibodies (1:500; A‐11034, RRID:AB_2576217; A‐11036, RRID:AB_10563566) were obtained from Invitrogen/Thermo Fisher Scientific. To stain F‐actin, Alexa Fluor 568‐conjugated phalloidin was used (1:1,000, A‐12380, Thermo Fisher Scientific).
A horseradish peroxidase‐linked goat anti‐mouse antibody (1:1,000, #NA931V, RRID:AB_772210) and a horseradish peroxidase‐linked goat anti‐rabbit antibody (1:1,000, #NA934V, RRID:AB_772206) were obtained from GE Healthcare.
Expression vectors
For the counter labeling of the neuronal volume, pEGFP‐N1 (Clontech) vector was applied. For the NR2A and NR2B live imaging and degradation assays, mouse full‐length Nr2a and Nr2b cDNA was ligated with pCMV‐driven ECFP and PA‐GFP N1‐type expression vectors (Yin et al, 2011). An untagged mouse NR1 expression vector was generated by replacing the yellow fluorescent protein (YFP) sequence of pEYFP (Clontech) with mouse Nr1 cDNA as previously described (Yin et al, 2011). For cellular knockdown of Kif3b gene, a miRNA‐based mammalian expression vector was prepared using BLOCK‐iT Pol II miR RNAi Expression Vector Kits (Thermo Fisher) with the following oligonucleotides: 5′‐TGCTGTCATCATAGAGCTCAAACTGCGTTTTGGCCACTGACTGACGCAGTTTGCTCTATGATGA‐3′ and 5′‐CCTGTCATCATAGAGCAAACTGCGTCAGTCAGTGGCCAAAACGCAGTTTGAGCTCTATGATGAC‐3′. All oligonucleotides were synthesized with a phosphorothioate group on each residue and inserted into the pcDNATM6.2‐GW plasmid vector (Thermo Fisher). The knockdown vector was used to transfect the cultured neurons at DIV 8–10. For rescue assays, mouse Kif3b cDNA was ligated with the pEYFP‐N1 vector (Clontech). The Arg653Ter point mutation was introduced into the KIF3B‐EYFP expression vector using the QuikChange Site‐Directed Mutagenesis Kit (Stratagene) with the following oligonucleotides: 5′‐AACTCGAGGCCACCATGTCCAAGTTAAAAAGCTCA‐3′ and 5′‐ATGATGATTCGGCCAGAGCCCGAGGTACCAAA‐3′. They were introduced into dissociated hippocampal neurons at DIV 16–21, which were cultured for 48–72 h to be subjected to analyses.
Immunoprecipitation and immunoblotting
Whole mouse brain lysates were prepared and used for immunoblotting and immunoprecipitation (IP) basically as previously described (Yin et al, 2011; Morikawa et al, 2018). For immunoblotting in Fig 2A, the adult mouse brain was homogenized against RIPA buffer containing 50 mM Tris pH 8.0, 1% Triton X‐100 (Sigma‐Aldrich), 0.1% SDS (Wako), and 150 mM NaCl containing a protease inhibitor cocktail (PIs; cOmplete™ mini EDTA‐free, Roche Diagnostics), cleared, subjected to SDS–PAGE, transferred onto a polyvinylidene difluoride (PVDF) Immobilon transfer membrane (EMD Millipore), and immunoblotted with the appropriated primary antibodies with corresponding horseradish peroxidase‐conjugated secondary antibodies. Signals were detected using Amersham ECL prime Western blotting detection reagent (RPN2232, GE Healthcare). Densitometry analysis was performed to quantify the band signals using ImageJ software (NIH).
For immunoprecipitation in Fig 1A–C, a mouse brain was homogenized against 6 ml of RIPA buffer (Fig 1A) or Hepes–sucrose buffer (10 mM Hepes pH 7.4, 320 mM sucrose, 5 mM MgSO4, 1 mM EGTA, protease inhibitors; Fig 1B and C). They were passed through the syringe and cleared by centrifugation at 15,000 × g for 15 min. Two gram of the primary antibodies was preincubated with magnetic μMACS Protein A MicroBeads (MACS Miltenyi Biotec), and mixed with 1 ml of brain lysates for 1 h at 4°C, washed, and eluted to be subjected for immunoblotting.
Neuronal cell culture and transfection
Primary cultures of hippocampal neurons were prepared as previously described (Takei et al, 2000; Kaech & Banker, 2006). Briefly, the isolated hippocampi from mice at embryonic day 16.5 were dissociated with 0.25% trypsin at 37°C for 15 min. The neurons were then plated on glass coverslips coated with polyethyleneimine (Sigma) and poly‐l‐lysine/laminin (Sigma). The culture medium was minimal essential medium (MEM), supplemented with 1 mM pyruvate (Gibco), 0.6% glucose, GlutaMAX™‐I (#35050, Gibco), and 2% B27 supplement mixture (Gibco). They were transfected at days in vitro (DIV) 7–16 using a modified calcium phosphate protocol (Jiang & Chen, 2006). More than 2 or 3 days after transfection, hippocampal cells were either fixed for immunocytochemistry or directly subjected to live imaging. To visualize spines of the neurons, EGFP‐transfected neurons were observed using an LSM780 confocal laser‐scanning microscope equipped with Airyscan device (ZEISS). Counting the number of the spines and the morphological classification of the spines were done using IMARIS software (Bitplane). The IMARIS Filament Tracer and Classify Spines extension were used to get the list of four default classes: stubby, mushroom, long‐thin, and filopodia.
Time‐lapse imaging
Hippocampal neurons were used at DIV 7–9. NR2A‐ECFP or NR2B‐ECFP expression vectors were introduced into cultured neurons with an untagged full‐length NR1 expression vector using the modified calcium phosphate transfection method. Three to five days after transfection, live imaging of the neurons was conducted under an inverted ZEISS light microscope equipped with a CSU‐W1 spinning disk confocal laser‐scanning unit (Yokogawa) and a cooled iXon EM‐CCD camera (Andor) and an LSM780 confocal laser‐scanning microscope (ZEISS). The movement of NR2A‐ECFP or NR2B‐ECFP vesicles along dendrites was monitored every 4 s.
Analysis and graphical representation were performed using ImageJ and IMARIS software. To measure the velocity and directionality of the NR2A‐ECFP and NR2B‐ECFP vesicles, punctate signals whose sizes were larger than 0.30 μm2 were monitored. To detect directions and modes of motion, velocity of the objects, and the traveled distance, ImageJ was used (threshold for ROI: 128) with TrackMate simple fast LAP tracker for single‐particle tracking (SPT). IMARIS spots creation wizard, 3D time plot (X, Y, Z) extension, was used to confirm the results.
Immunocytochemistry
For the immunocytochemistry of cultured hippocampal neurons (Figs 2C–F and 6F), the cells were transfected with pEGFP‐N1 for 2 days, fixed in 4% PFA‐PBS for 10 min at 37°C, blocked with 5% bovine serum albumin (BSA) in PBS, prelabeled against extracellular domains of glutamate receptors for overnight at 4°C, washed in PBS, permeabilized with 0.1% Triton X‐100 for 5 min at room temperature (RT), and incubated with primary antibodies against cytoplasmic proteins in 5% BSA‐PBS overnight at 4°C, and then with Alexa Fluor 488, 568, or 647 secondary antibodies and/or Alexa Fluor 568‐phalloidin in 5% BSA‐PBS for 1 h at RT.
For quadruple color images (Figs 1D–H, and 7C), rabbit anti‐KIF3B, anti‐NR2A, anti‐NR2B, and anti‐APC antibodies were directly labeled with Alexa Fluor 488, 555, 555, 647, respectively, using Zenon Rabbit IgG Labeling Kit (Z‐25360, Molecular Probes) according to the manufacturer's instructions. Briefly, 5 μl of Components A, B, and C in the kit was separately added to 1 μg primary antibodies and followed by the incubation for 5 min at RT. Then, 5 μl Component D was added, followed by 5 min of incubation at RT. The solutions were diluted by 5% BSA‐PBS and applied to the neurons for 1 h at RT in dark. The neurons were counterstained with a mouse primary anti‐PSD95 antibody and then with an Alexa Fluor 405‐tagged secondary antibody. An LSM780 confocal laser‐scanning microscope with Airyscan (ZEISS) was used to obtain images.
To analyze colocalization (Fig 1I), IMARIS software was used. Using IMARIS spots creation wizard (threshold: 127.50) and spots XT, spot objects are generated in multi‐channel images. Punctate spots whose size was larger than 0.30 μm2 were defined as positive signals. For quantification, Pearson's correlation coefficient (PCC) was used to quantify the degree of colocalization of the spots and colocalization percentages.
To measure the number of surface NMDAR clusters (Figs 2G and 7D), punctate signals colocalized with PSD95 signals at EGFP‐labeled spines and whose size was larger than 0.30 μm2 were defined as synaptic surface clusters. The density of the clusters in a 10 μm dendrite was compared. For fluorescence intensity of dendritic APC (Fig 2E), ImageJ software was used.
Immunohistochemistry
For immunohistochemistry in Fig 2B, adult mice were anesthetized and transcardially perfused with 4% PFA‐PBS. The brains were dissected, fixed, dehydrated, frozen, and microsliced into 25‐μm‐thick sections. The sections were incubated with an anti‐NR2A antibody overnight at 4°C, followed by incubation with Alexa Fluor 568 secondary antibodies for 2 h at RT. Images were acquired using an LSM780 confocal laser‐scanning microscope (ZEISS). The staining intensity was analyzed using ImageJ software.
Histological studies
Adult mice were anesthetized and transcardially perfused with 4% PFA‐PBS. The brains were dissected and postfixed with FEA solution (70% ethanol, 5% formalin, 5% acetic acid). Following dehydration with ethanol, the tissues were embedded in paraffin and sectioned serially at a thickness of 7 μm (HM‐355; Rotary Microtome). The hematoxylin–eosin (HE) method was used to stain the brain sections. They were subjected to an upright light microscope LEICA DM3000 for observation and quantification. For macroscopic brain analyses (Fig 6E), the fixed brains were subjected to LEICA Z6 APO microscope for observation and quantification.
Electrophysiology
Transverse slices (400 μm thick) of acutely dissected hippocampi were prepared from postnatal days (P) 21–27 mice as previously described (Morikawa et al, 2018). The slices were cut in oxygenated cutting solution [in mM: 15 KCl, 130 K‐gluconate, 0.05 EGTA, 20 Hepes (pH 7.4), and 25 d‐glucose] or artificial CSF (aCSF, containing, in mM: 119 NaCl, 2.6 KCl, 1.3 MgSO4, 1.0 NaH2PO4, 26 NaHCO3, 2.5 CaCl2, and 11 d‐glucose), incubated in a chamber at 32.5°C, superfused with oxygenated aCSF, and allowed to equilibrate for at least 60 min before recording. A single slice was transferred into a submerged recording chamber and perfused continuously with aCSF.
Excitatory postsynaptic currents (EPSCs) in CA1 pyramidal neurons were recorded using the whole‐cell patch‐clamp technique. Picrotoxin (100 μM) was routinely added to aCSF. The pipette patch electrode (2–8 MΩ) was filled with internal solution (in mM: 122.5 Cs gluconate, 17.5 CsCl, 10 HEPES, 0.2 EGTA, 8 NaCl, 2 Mg‐ATP, 0.3 Na3‐GTP, pH 7.2, 300 mOsm). NMDAR‐mediated EPSCs were isolated by blocking AMPA currents with 2,3‐dioxo‐6‐nitro‐1,2,3,4‐tetrahydrobenzo[f]quinoxaline‐7‐sulfonamide (NBQX, 10 μM). Ratiometric measurements of NMDA/AMPA currents were calculated from peak amplitudes at +40 and −90 mV of holding potential.
To record field excitatory postsynaptic potentials (fEPSPs), both the stimulating and recording electrodes were placed in the stratum radiatum of the CA1 area. The stimulus intensity (test pulse duration of 0.1 ms) was set to evoke approximately 50% maximal fEPSP at a frequency of 0.1 Hz. After recording a stable baseline of fEPSPs for 20 min, long‐term potentiation (LTP) or long‐term depression (LTD) was induced by tetanic stimulation (100 Hz for 1 s or 1 Hz for 15 min, respectively).
NR2A/NR2B degradation assay
Hippocampal neurons were used at DIV 7–9. The photoactivatable (PA)‐GFP was fused to NR2A or NR2B to generate the NR2A‐PA‐GFP or NR2B‐PA‐GFP expression vectors driven by the CMV promoter. Untagged NR1 and NR2A‐PA‐GFP or NR2B‐PA‐GFP were introduced into cultured neurons with RFP using a modified Ca2+‐phosphate transfection method as described previously (Jiang & Chen, 2006). Three to five days after transfection, NR2A‐ or NR2B‐PA‐GFP in living neurons was locally photoactivated with a 405‐nm laser and observed under 488‐nm excitation using an LSM780 confocal laser‐scanning microscope (ZEISS). When needed, neurons were pretreated with MG132 (10 μM) for 24 h. The images were acquired every 1 h, and each cell was observed for 6 h.
Statistical analyses
All data are presented as the mean ± SEM and were analyzed using an unpaired Student's t‐test or a paired t‐test. Two‐way ANOVA or the chi‐square test was used to calculate the significance for multiple comparisons.
Author contributions
NH conceived and directed the project. NH and YTak conceptualized and supervised the project. AHA, MM, YTak, and NH planned and conducted the experiments. YTan identified the mutations. AHA, MM, YTan, YTak, and NH wrote the manuscript.
Conflict of interest
The authors declare that they have no conflict of interest.
Supporting information
Expanded View Figures PDF
Table EV1
Review Process File
Source Data for Figure 1
Source Data for Figure 2
Acknowledgements
We thank all the members of N. Hirokawa laboratory, with special mention of Dr. Suguru Iwata and Dr. Fang Xu for technical support, comments, and suggestions that significantly improved the manuscript. We also thank Ms. Hiromi Sato, Ms. Haruyo Fukuda, Mr. Nobuhisa Onouchi, and Mr. Tsuyoshi Akamatsu for their technical support and secretarial assistance. The authors appreciate Prof. Jumana Al‐Aama (KAU) for her kind support. We also thank Prof. Takeo Yoshikawa, Dr. Akiko Watanabe, Dr. Hisako Ohba, and Dr. Shabeesh Balan (RIKEN) for the technical help of mouse behavioral tests and human molecular genetics, and Prof. Masanobu Kano, Dr. Naofumi Uesaka, Dr. Kenichiro Nagahama, and Dr. Shuhei Fujino for the technical help of electrophysiological analyses. This research was supported by the Japan Society for the Promotion of Science (JSPS) KAKENHI (grant numbers JP23000013 and JP16H06372) to N. Hirokawa and Princess Al‐Jawhara Center of Excellence in Research of Hereditary Disorders (PACER.HD), King Abdulaziz University (KAU), and Ministry of Higher Education of the Kingdom of Saudi Arabia (MOHE). This research was partly supported from the Japan Agency for Medical Research and Development (AMED) by the Brain Mapping by Integrated Neurotechnologies for Disease Studies (Brain/MINDS; grant number JP18dm0207047) to Y. Takei and by the Strategic Research Program for Brain Science (SRPBS; grant number JP18dm0107084h0002) to N. Hirokawa & Y. Tanaka.
The EMBO Journal (2020) 39: e101090
References
- Akashi K, Kakizaki T, Kamiya H, Fukaya M, Yamasaki M, Abe M, Natsume R, Watanabe M, Sakimura K (2009) NMDA receptor GluN2B (GluR epsilon 2/NR2B) subunit is crucial for channel function, postsynaptic macromolecular organization, and actin cytoskeleton at hippocampal CA3 synapses. J Neurosci 29: 10869–10882 [DOI] [PMC free article] [PubMed] [Google Scholar]
- Alexander‐Bloch AF, Reiss PT, Rapoport J, McAdams H, Giedd JN, Bullmore ET, Gogtay N (2014) Abnormal cortical growth in schizophrenia targets normative modules of synchronized development. Biol Psychiatry 76: 438–446 [DOI] [PMC free article] [PubMed] [Google Scholar]
- Asaka Y, Jugloff DG, Zhang L, Eubanks JH, Fitzsimonds RM (2006) Hippocampal synaptic plasticity is impaired in the Mecp2‐null mouse model of Rett syndrome. Neurobiol Dis 21: 217–227 [DOI] [PubMed] [Google Scholar]
- Auerbach BD, Osterweil EK, Bear MF (2011) Mutations causing syndromic autism define an axis of synaptic pathophysiology. Nature 480: 63–68 [DOI] [PMC free article] [PubMed] [Google Scholar]
- Bannerman DM, Sprengel R, Sanderson DJ, McHugh SB, Rawlins JN, Monyer H, Seeburg PH (2014) Hippocampal synaptic plasticity, spatial memory and anxiety. Nat Rev Neurosci 15: 181–192 [DOI] [PubMed] [Google Scholar]
- Barria A, Malinow R (2002) Subunit‐specific NMDA receptor trafficking to synapses. Neuron 35: 345–353 [DOI] [PubMed] [Google Scholar]
- Bartlett TE, Bannister NJ, Collett VJ, Dargan SL, Massey PV, Bortolotto ZA, Fitzjohn SM, Bashir ZI, Collingridge GL, Lodge D (2007) Differential roles of NR2A and NR2B‐containing NMDA receptors in LTP and LTD in the CA1 region of two‐week old rat hippocampus. Neuropharmacology 52: 60–70 [DOI] [PubMed] [Google Scholar]
- Bhandari A, Voineskos D, Daskalakis ZJ, Rajji TK, Blumberger DM (2016) A review of impaired neuroplasticity in schizophrenia investigated with non‐invasive brain stimulation. Front Psychiatry 7: 45 [DOI] [PMC free article] [PubMed] [Google Scholar]
- Boksa P (2012) Abnormal synaptic pruning in schizophrenia: urban myth or reality? J Psychiatry Neurosci 37: 75–77 [DOI] [PMC free article] [PubMed] [Google Scholar]
- Byars SG, Stearns SC, Boomsma JJ (2014) Opposite risk patterns for autism and schizophrenia are associated with normal variation in birth size: phenotypic support for hypothesized diametric gene‐dosage effects. Proc Biol Sci 281: 20140604 [DOI] [PMC free article] [PubMed] [Google Scholar]
- Chen Y, Huang WC, Sejourne J, Clipperton‐Allen AE, Page DT (2015) Pten mutations alter brain growth trajectory and allocation of cell types through elevated β‐catenin signaling. J Neurosci 35: 10252–10267 [DOI] [PMC free article] [PubMed] [Google Scholar]
- Cui DH, Jiang KD, Jiang SD, Xu YF, Yao H (2005) The tumor suppressor adenomatous polyposis coli gene is associated with susceptibility to schizophrenia. Mol Psychiatry 10: 669–677 [DOI] [PubMed] [Google Scholar]
- Dean B, Scarr E, Bradbury R, Copolov D (1999) Decreased hippocampal (CA3) NMDA receptors in schizophrenia. Synapse 32: 67–69 [DOI] [PubMed] [Google Scholar]
- Downhill JE Jr, Buchsbaum MS, Wei T, Spiegel‐Cohen J, Hazlett EA, Haznedar MM, Silverman J, Siever LJ (2000) Shape and size of the corpus callosum in schizophrenia and schizotypal personality disorder. Schizophr Res 42: 193–208 [DOI] [PubMed] [Google Scholar]
- Ehninger D, Silva AJ (2011) Rapamycin for treating tuberous sclerosis and autism spectrum disorders. Trends Mol Med 17: 78–87 [DOI] [PMC free article] [PubMed] [Google Scholar]
- Fromer M, Pocklington AJ, Kavanagh DH, Williams HJ, Dwyer S, Gormley P, Georgieva L, Rees E, Palta P, Ruderfer DM et al (2014) De novo mutations in schizophrenia implicate synaptic networks. Nature 506: 179–184 [DOI] [PMC free article] [PubMed] [Google Scholar]
- Gilbert PE, Brushfield AM (2009) The role of the CA3 hippocampal subregion in spatial memory: a process oriented behavioral assessment. Prog Neuropsychopharmacol Biol Psychiatry 33: 774–781 [DOI] [PMC free article] [PubMed] [Google Scholar]
- Gilman SR, Chang J, Xu B, Bawa TS, Gogos JA, Karayiorgou M, Vitkup D (2012) Diverse types of genetic variation converge on functional gene networks involved in schizophrenia. Nat Neurosci 15: 1723–1728 [DOI] [PMC free article] [PubMed] [Google Scholar]
- Gonzalez L, Alvarez J, Weinstein E, Korenis P (2015) Familial adenomatous polyposis in an adolescent with coexisting schizophrenia: treatment strategies and implications. Mol Genet Genomic Med 3: 391–395 [DOI] [PMC free article] [PubMed] [Google Scholar]
- Guillaud L, Setou M, Hirokawa N (2003) KIF17 dynamics and regulation of NR2B trafficking in hippocampal neurons. J Neurosci 23: 131–140 [DOI] [PMC free article] [PubMed] [Google Scholar]
- Haws ME, Jaramillo TC, Espinosa F, Widman AJ, Stuber GD, Sparta DR, Tye KM, Russo SJ, Parada LF, Stavarache M et al (2014) PTEN knockdown alters dendritic spine/protrusion morphology, not density. J Comp Neurol 522: 1171–1190 [DOI] [PMC free article] [PubMed] [Google Scholar]
- Hirokawa N, Noda Y (2008) Intracellular transport and kinesin superfamily proteins, KIFs: structure, function, and dynamics. Physiol Rev 88: 1089–1118 [DOI] [PubMed] [Google Scholar]
- Hirokawa N, Noda Y, Tanaka Y, Niwa S (2009) Kinesin superfamily motor proteins and intracellular transport. Nat Rev Mol Cell Biol 10: 682–696 [DOI] [PubMed] [Google Scholar]
- Hirokawa N, Niwa S, Tanaka Y (2010) Molecular motors in neurons: transport mechanisms and roles in brain function, development, and disease. Neuron 68: 610–638 [DOI] [PubMed] [Google Scholar]
- Holmes A, Parmigiani S, Ferrari PF, Palanza P, Rodgers RJ (2000) Behavioral profile of wild mice in the elevated plus‐maze test for anxiety. Physiol Behav 71: 509–516 [DOI] [PubMed] [Google Scholar]
- Hrabetova S, Sacktor TC (1997) Long‐term potentiation and long‐term depression are induced through pharmacologically distinct NMDA receptors. Neurosci Lett 226: 107–110 [DOI] [PubMed] [Google Scholar]
- Ichinose S, Ogawa T, Hirokawa N (2015) Mechanism of activity‐dependent cargo loading via the phosphorylation of KIF3A by PKA and CaMKIIa. Neuron 87: 1022–1035 [DOI] [PubMed] [Google Scholar]
- Inestrosa NC, Montecinos‐Oliva C, Fuenzalida M (2012) Wnt signaling: role in Alzheimer disease and schizophrenia. J Neuroimmune Pharmacol 7: 788–807 [DOI] [PubMed] [Google Scholar]
- Jiang M, Chen G (2006) High Ca2+‐phosphate transfection efficiency in low‐density neuronal cultures. Nat Protoc 1: 695–700 [DOI] [PubMed] [Google Scholar]
- Jimbo T, Kawasaki Y, Koyama R, Sato R, Takada S, Haraguchi K, Akiyama T (2002) Identification of a link between the tumour suppressor APC and the kinesin superfamily. Nat Cell Biol 4: 323–327 [DOI] [PubMed] [Google Scholar]
- Jones CA, Watson DJ, Fone KC (2011) Animal models of schizophrenia. Br J Pharmacol 164: 1162–1194 [DOI] [PMC free article] [PubMed] [Google Scholar]
- Kaech S, Banker G (2006) Culturing hippocampal neurons. Nat Protoc 1: 2406–2415 [DOI] [PubMed] [Google Scholar]
- Kanai Y, Okada Y, Tanaka Y, Harada A, Terada S, Hirokawa N (2000) KIF5C, a novel neuronal kinesin enriched in motor neurons. J Neurosci 20: 6374–6384 [DOI] [PMC free article] [PubMed] [Google Scholar]
- Kasai H, Matsuzaki M, Noguchi J, Yasumatsu N, Nakahara H (2003) Structure‐stability‐function relationships of dendritic spines. Trends Neurosci 26: 360–368 [DOI] [PubMed] [Google Scholar]
- Kim MJ, Dunah AW, Wang YT, Sheng M (2005) Differential roles of NR2A‐ and NR2B‐containing NMDA receptors in Ras‐ERK signaling and AMPA receptor trafficking. Neuron 46: 745–760 [DOI] [PubMed] [Google Scholar]
- Lau CG, Zukin RS (2007) NMDA receptor trafficking in synaptic plasticity and neuropsychiatric disorders. Nat Rev Neurosci 8: 413–426 [DOI] [PubMed] [Google Scholar]
- Lee J, Green MF (2016) Social preference and glutamatergic dysfunction: underappreciated prerequisites for social dysfunction in schizophrenia. Trends Neurosci 39: 587–596 [DOI] [PMC free article] [PubMed] [Google Scholar]
- Maekawa M, Ohnishi T, Hashimoto K, Watanabe A, Iwayama Y, Ohba H, Hattori E, Yamada K, Yoshikawa T (2010) Analysis of strain‐dependent prepulse inhibition points to a role for Shmt1 (SHMT1) in mice and in schizophrenia. J Neurochem 115: 1374–1385 [DOI] [PubMed] [Google Scholar]
- Manago F, Mereu M, Mastwal S, Mastrogiacomo R, Scheggia D, Emanuele M, De Luca MA, Weinberger DR, Wang KH, Papaleo F (2016) Genetic disruption of Arc/Arg3.1 in mice causes alterations in dopamine and neurobehavioral phenotypes related to schizophrenia. Cell Rep 16: 2116–2128 [DOI] [PMC free article] [PubMed] [Google Scholar]
- Miki H, Setou M, Kaneshiro K, Hirokawa N (2001) All kinesin superfamily protein, KIF, genes in mouse and human. Proc Natl Acad Sci USA 98: 7004–7011 [DOI] [PMC free article] [PubMed] [Google Scholar]
- Mohn JL, Alexander J, Pirone A, Palka CD, Lee SY, Mebane L, Haydon PG, Jacob MH (2014) Adenomatous polyposis coli protein deletion leads to cognitive and autism‐like disabilities. Mol Psychiatry 19: 1133–1142 [DOI] [PMC free article] [PubMed] [Google Scholar]
- Monyer H, Burnashev N, Laurie DJ, Sakmann B, Seeburg PH (1994) Developmental and regional expression in the rat brain and functional properties of four NMDA receptors. Neuron 12: 529–540 [DOI] [PubMed] [Google Scholar]
- Morikawa M, Tanaka Y, Cho HS, Yoshihara M, Hirokawa N (2018) The molecular motor KIF21B mediates synaptic plasticity and fear extinction by terminating Rac1 activation. Cell Rep 23: 3864–3877 [DOI] [PubMed] [Google Scholar]
- Morimura N, Yasuda H, Yamaguchi K, Katayama KI, Hatayama M, Tomioka NH, Odagawa M, Kamiya A, Iwayama Y, Maekawa M et al (2017) Autism‐like behaviours and enhanced memory formation and synaptic plasticity in Lrfn2/SALM1‐deficient mice. Nat Commun 8: 15800 [DOI] [PMC free article] [PubMed] [Google Scholar]
- Nakanishi S (1992) Molecular diversity of glutamate receptors and implications for brain function. Science 258: 597–603 [DOI] [PubMed] [Google Scholar]
- Nonaka S, Tanaka Y, Okada Y, Takeda S, Harada A, Kanai Y, Kido M, Hirokawa N (1998) Randomization of left‐right asymmetry due to loss of nodal cilia generating leftward flow of extraembryonic fluid in mice lacking KIF3B motor protein. Cell 95: 829–837 [DOI] [PubMed] [Google Scholar]
- Onouchi T, Kobayashi K, Sakai K, Shimomura A, Smits R, Sumi‐Ichinose C, Kurosumi M, Takao K, Nomura R, Iizuka‐Kogo A et al (2014) Targeted deletion of the C‐terminus of the mouse adenomatous polyposis coli tumor suppressor results in neurologic phenotypes related to schizophrenia. Mol Brain 7: 21 [DOI] [PMC free article] [PubMed] [Google Scholar]
- Papaleo F, Yang F, Paterson C, Palumbo S, Carr GV, Wang Y, Floyd K, Huang W, Thomas CJ, Chen J et al (2016) Behavioral, neurophysiological, and synaptic impairment in a transgenic Neuregulin1 (NRG1‐IV) murine schizophrenia model. J Neurosci 36: 4859–4875 [DOI] [PMC free article] [PubMed] [Google Scholar]
- Purcell SM, Moran JL, Fromer M, Ruderfer D, Solovieff N, Roussos P, O'Dushlaine C, Chambert K, Bergen SE, Kähler A et al (2014) A polygenic burden of rare disruptive mutations in schizophrenia. Nature 506: 185–190 [DOI] [PMC free article] [PubMed] [Google Scholar]
- Rao A, Craig AM (1997) Activity regulates the synaptic localization of the NMDA receptor in hippocampal neurons. Neuron 19: 801–812 [DOI] [PubMed] [Google Scholar]
- Ratajczak P, Wozniak A, Nowakowska E (2013) Animal models of schizophrenia: developmental preparation in rats. Acta Neurobiol Exp 73: 472–484 [DOI] [PubMed] [Google Scholar]
- Rebola N, Carta M, Mulle C (2017) Operation and plasticity of hippocampal CA3 circuits: implications for memory encoding. Nat Rev Neurosci 18: 208–220 [DOI] [PubMed] [Google Scholar]
- Rosenfeld CS, Ferguson SA (2014) Barnes maze testing strategies with small and large rodent models. J Vis Exp 84: e51194 [DOI] [PMC free article] [PubMed] [Google Scholar]
- Savanthrapadian S, Wolff AR, Logan BJ, Eckert MJ, Bilkey DK, Abraham WC (2013) Enhanced hippocampal neuronal excitability and LTP persistence associated with reduced behavioral flexibility in the maternal immune activation model of schizophrenia. Hippocampus 23: 1395–1409 [DOI] [PubMed] [Google Scholar]
- Schmeisser MJ, Ey E, Wegener S, Bockmann J, Stempel AV, Kuebler A, Janssen AL, Udvardi PT, Shiban E, Spilker C et al (2012) Autistic‐like behaviours and hyperactivity in mice lacking ProSAP1/Shank2. Nature 486: 256–260 [DOI] [PubMed] [Google Scholar]
- Senda T, Shimomura A, Iizuka‐Kogo A (2005) Adenomatous polyposis coli (Apc) tumor suppressor gene as a multifunctional gene. Anat Sci Int 80: 121–131 [DOI] [PubMed] [Google Scholar]
- Setou M, Nakagawa T, Seog DH, Hirokawa N (2000) Kinesin superfamily motor protein KIF17 and mLin‐10 in NMDA receptor‐containing vesicle transport. Science 288: 1796–1802 [DOI] [PubMed] [Google Scholar]
- Sheng M, Cummings J, Roldan LA, Jan YN, Jan LY (1994) Changing subunit composition of heteromeric NMDA receptors during development of rat cortex. Nature 368: 144–147 [DOI] [PubMed] [Google Scholar]
- Shimomura A, Ohkuma M, Iizuka‐Kogo A, Kohu K, Nomura R, Miyachi E, Akiyama T, Senda T (2007) Requirement of the tumour suppressor APC for the clustering of PSD‐95 and AMPA receptors in hippocampal neurons. Eur J Neurosci 26: 903–912 [DOI] [PubMed] [Google Scholar]
- Silverman JL, Yang M, Lord C, Crawley JN (2010) Behavioural phenotyping assays for mouse models of autism. Nat Rev Neurosci 11: 490–502 [DOI] [PMC free article] [PubMed] [Google Scholar]
- Singh KK (2013) An emerging role for Wnt and GSK3 signaling pathways in schizophrenia. Clin Genet 83: 511–517 [DOI] [PubMed] [Google Scholar]
- Sweet ES, Tseng CY, Firestein BL (2011) To branch or not to branch: how PSD‐95 regulates dendrites and spines. Bioarchitecture 1: 69–73 [DOI] [PMC free article] [PubMed] [Google Scholar]
- Takeda S, Yonekawa Y, Tanaka Y, Okada Y, Nonaka S, Hirokawa N (1999) Left‐right asymmetry and kinesin superfamily protein KIF3A: new insights in determination of laterality and mesoderm induction by kif3A −/− mice analysis. J Cell Biol 145: 825–836 [DOI] [PMC free article] [PubMed] [Google Scholar]
- Takeda S, Yamazaki H, Seog DH, Kanai Y, Terada S, Hirokawa N (2000) Kinesin superfamily protein 3 (KIF3) motor transports fodrin‐associating vesicles important for neurite building. J Cell Biol 148: 1255–1265 [DOI] [PMC free article] [PubMed] [Google Scholar]
- Takei Y, Teng J, Harada A, Hirokawa N (2000) Defects in axonal elongation and neuronal migration in mice with disrupted tau and map1b genes. J Cell Biol 150: 989–1000 [DOI] [PMC free article] [PubMed] [Google Scholar]
- Takei Y, Kikkawa YS, Atapour N, Hensch TK, Hirokawa N (2015) Defects in synaptic plasticity, reduced NMDA‐receptor transport, and instability of postsynaptic density proteins in mice lacking microtubule‐associated protein 1A. J Neurosci 35: 15539–15554 [DOI] [PMC free article] [PubMed] [Google Scholar]
- Teng J, Rai T, Tanaka Y, Takei Y, Nakata T, Hirasawa M, Kulkarni AB, Hirokawa N (2005) The KIF3 motor transports N‐cadherin and organizes the developing neuroepithelium. Nat Cell Biol 7: 474–482 [DOI] [PubMed] [Google Scholar]
- Thaxton C, Kloth AD, Clark EP, Moy SS, Chitwood RA, Philpot BD (2018) Common pathophysiology in multiple mouse models of Pitt‐Hopkins syndrome. J Neurosci 38: 918–936 [DOI] [PMC free article] [PubMed] [Google Scholar]
- Votin V, Nelson WJ, Barth AI (2005) Neurite outgrowth involves adenomatous polyposis coli protein and beta‐catenin. J Cell Sci 118: 5699–5708 [DOI] [PMC free article] [PubMed] [Google Scholar]
- Wong RW, Setou M, Teng J, Takei Y, Hirokawa N (2002) Overexpression of motor protein KIF17 enhances spatial and working memory in transgenic mice. Proc Natl Acad Sci USA 99: 14500–14505 [DOI] [PMC free article] [PubMed] [Google Scholar]
- Yamazaki H, Nakata T, Okada Y, Hirokawa N (1995) KIF3A/B: a heterodimeric kinesin superfamily protein that works as a microtubule plus end‐directed motor for membrane organelle transport. J Cell Biol 130: 1387–1399 [DOI] [PMC free article] [PubMed] [Google Scholar]
- Yamazaki H, Nakata T, Okada Y, Hirokawa N (1996) Cloning and characterization of KAP3: a novel kinesin superfamily‐associated protein of KIF3A/3B. Proc Natl Acad Sci USA 93: 8443–8448 [DOI] [PMC free article] [PubMed] [Google Scholar]
- Yanai H, Satoh K, Matsumine A, Akiyama T (2000) The colorectal tumour suppressor APC is present in the NMDA‐receptor‐PSD‐95 complex in the brain. Genes Cells 5: 815–822 [DOI] [PubMed] [Google Scholar]
- Yashiro K, Philpot BD (2008) Regulation of NMDA receptor subunit expression and its implications for LTD, LTP, and metaplasticity. Neuropharmacology 55: 1081–1094 [DOI] [PMC free article] [PubMed] [Google Scholar]
- Yin X, Takei Y, Kido MA, Hirokawa N (2011) Molecular motor KIF17 is fundamental for memory and learning via differential support of synaptic NR2A/2B levels. Neuron 70: 310–325 [DOI] [PubMed] [Google Scholar]
- Yin X, Feng X, Takei Y, Hirokawa N (2012) Regulation of NMDA receptor transport: a KIF17‐cargo binding/releasing underlies synaptic plasticity and memory in vivo . J Neurosci 32: 5486–5499 [DOI] [PMC free article] [PubMed] [Google Scholar]
- Zhou Y, Kaiser T, Monteiro P, Zhang X, Van der Goes MS, Wang D, Barak B, Zeng M, Li C, Lu C et al (2016) Mice with Shank3 mutations associated with ASD and schizophrenia display both shared and distinct defects. Neuron 89: 147–162 [DOI] [PMC free article] [PubMed] [Google Scholar]
Associated Data
This section collects any data citations, data availability statements, or supplementary materials included in this article.
Supplementary Materials
Expanded View Figures PDF
Table EV1
Review Process File
Source Data for Figure 1
Source Data for Figure 2