

SUMMARY
Many tumor viruses encode oncogenes of cellular origin. Here, we report an oncoviral mimic of a cellular tumor suppressor. The Kaposi’s sarcoma-associated herpesvirus (KSHV) microRNA (miRNA) miR-K6-5p shares sequence similarity to the tumor-suppressive cellular miR-15/16 miRNA family. We show that miR-K6-5p inhibits cell cycle progression, a hallmark function of miR-16. miR-K6-5p regulates conserved miR-15/16 family miRNA targets, including many cell cycle regulators. Inhibition of miR-K6-5p in KSHV-transformed B cells confers a significant growth advantage. Altogether, our data show that KSHV encodes a functional mimic of miR-15/16 family miRNAs. While it is exceedingly well established that oncogenic viruses encode oncogenes of cellular origin, this is an unusual example of an oncogenic virus that encodes a viral mimic of a cellular tumor suppressor. Encoding a tumor-suppressive miRNA could help KSHV balance viral oncogene expression and thereby avoid severe pathogenesis in the healthy host.
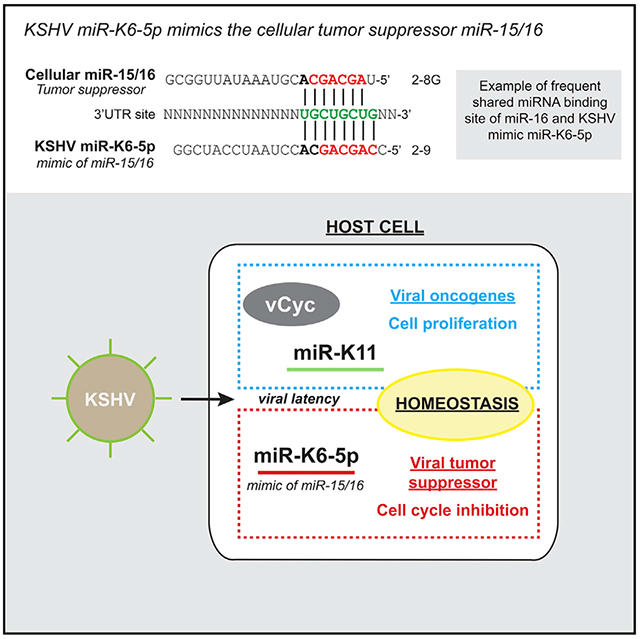
Graphical Abstract
In Brief
Morrison et al. report that the tumor virus KSHV encodes a mimic of a cellular tumor suppressor. KSHV miR-K6-5p phenocopies miR-16-induced cell cycle inhibition, shares mRNA targets and binding sites with miR-16, and negatively regulates proliferation in KSHV-infected cells.
INTRODUCTION
Viruses cause ~12% of human cancers. Viral oncogenesis is often due to the expression of viral oncogenes, including those with cellular counterparts. Kaposi’s sarcoma-associated herpesvirus (KSHV) is a human tumor virus that causes Kaposi’s sarcoma (KS), primary effusion lymphoma (PEL), and the B cell proliferative disorder multicentric Castleman’s disease (Cesarman et al., 1995; Chang et al., 1994; Nador et al., 1996; Soulier et al., 1995). The vast majority of cells in KS and PEL exhibit the restricted latent KSHV gene expression pattern (Damania and Cesarman, 2013), which includes proteins that promote cellular proliferation and survival: LANA maintains the viral episome and inhibits the tumor suppressor p53, the KSHV cyclin (vCyc) drives cell cycle progression, and the KSHV FLICE-inhibitory protein (vFLIP) promotes cellular survival. The latency program also includes >20 viral microRNAs (miRNAs).
miRNAs are ~22 nt long non-coding RNAs that guide RNA-induced silencing complexes (RISCs) to target mRNAs, resulting in measurable mRNA destabilization (Bartel, 2009, 2018). Most effective miRNA binding sites exhibit uninterrupted Watson-Crick base pairing to nucleotides 2–7 from the miRNA 5′ end, the seed sequence. While base pairing to only nucleotides 2–7 of the miRNA results in marginal regulation, additional base pairing of nucleotide 8 of the miRNA or the presence of an adenosine (A) immediately following the seed match in the target mRNA result in effective regulation.
Together, the KSHV miRNAs bind hundreds of mRNAs and thus have a pleiotropic functional outcome (Gallaher et al., 2013; Gay et al., 2018; Gottwein et al., 2011; Grosswendt et al., 2014; Haecker et al., 2012; Ziegelbauer et al., 2009). Roles of individual KSHV miRNAs include the evasion from cell cycle arrest and apoptosis (Gottwein and Cullen, 2010; Liu et al., 2017). KSHV uses at least three viral miRNAs to access conserved cellular miRNA regulatory networks (Gottwein et al., 2007, 2011; Manzano et al., 2013, 2015; Skalsky et al., 2007). Most importantly, miR-K11 shares its seed sequence with the oncogenic miR-155 and consequently regulates miR-155 targets. miR-K11 phenocopies miR-155-induced B cell proliferation in vivo (Boss et al., 2011; Dahlke et al., 2012; Sin et al., 2013) and therefore likely contributes to KSHV-associated B cell lymphomagenesis.
Interestingly, the KSHV miRNA miR-K6-5p has extended sequence similarity to the cellular miR-15/16 family of miRNAs (Figure 1A). This is surprising, because miR-15/16 family miRNAs are tumor suppressors. miR-15/16 family miRNAs are encoded within several miRNA clusters. Chromosomal deletion of 13q14, which harbors the miR-15a/miR-16-1 cluster, is frequent in B cell chronic lymphocytic leukemia and can result in substantially reduced miR-15/16 family miRNA expression (Calin et al., 2002; Fulci et al., 2007; Wang et al., 2008). Downregulation of miR-15/16 family miRNAs has also been reported in other cancers. In mice, individual or combined deletion of the miR-15a/miR-16-1 and miR-15b/miR-16-2 clusters leads to hematologic malignancies (Klein et al., 2010; Lovat et al., 2015, 2018). At the cellular level, miR-15/16 family miRNAs inhibit cell cycle progression and promote apoptosis. Targets of miR-15/16 family miRNAs include strong candidates for mediators of its tumor-suppressive properties, such as anti-apoptotic BCL2 family members (Cimmino et al., 2005), cyclins, cyclin-dependent kinases, and other cell cycle regulators (Calin et al., 2008; Linsley et al., 2007; Liu et al., 2008).
Figure 1. KSHV miR-K6-5p Mimics miR-16-Induced Cell Cycle Arrest.

(A) Sequences of miR-K6-5p, the miR-15/16 family miRNAs, and miR-214. miRNA seed sequences (nucleotides 2–7) are in red.
(B and C) Primary lymphatic endothelial cells (LEC) were transfected with mimics of miR-16, miR-K6-5p, or a negative control (ctrl) and subjected to growth curve analyses (B) or cell cycle analysis by propidium iodide (PI) staining on day 2 after transfection (C). n = 3.
(D and E) JSC-1 cells were transfected with miRNA mimics and subjected to growth curve analysis (D) or cell cycle analysis by anti-BrdU/PI staining on day 2 after transfection (E). n = 3.
*p < 0.05, **p < 0.01, ***p < 0.001. Data are represented as mean ± SEM. See also Figure S1.
Here, we characterize the functional relationship between KSHV miR-K6-5p and miR-15/16 family miRNAs. miR-K6-5p phenocopies the cell cycle inhibitory functions of miR-15/16 family miRNAs and shares a substantial portion of its mRNA target sites. Inactivation of miR-K6-5p confers a competitive advantage to KSHV-transformed B cells. Thus, this oncogenic virus remarkably encodes a mimic of a conserved tumor suppressor. We hypothesize that the physiological role of miR-K6-5p is to negatively regulate the cell cycle and thereby balance the pro-proliferative and pro-survival functions of KSHV oncogenes. While the expression of tumor-viral versions of cellular oncogenes is a well-established paradigm, miR-K6-5p is a surprising example of an oncoviral mimic of a bona fide cellular tumor suppressor.
RESULTS
miR-K6-5p Mimics the Cell Cycle Inhibitory Properties of miR-16
To investigate the relationship between miR-K6-5p and miR-16, we compared effects of miRNA mimic transfection into primary lymphatic endothelial cells (LECs). LECs are candidates for the cell type of origin of KS (Boshoff et al., 1995). miR-16 was chosen to represent the miR-15/16 family miRNAs because it is among the ten miRNAs with most reads in a small RNA sequencing dataset from LEC and is also highly expressed in PEL cell lines (see STAR Methods; Gottwein et al., 2011). Other family members were not included in our comparison, because miR-15, miR-16, and miR-195 cause nearly identical changes in gene expression and phenotypes (Linsley et al., 2007). As expected, overexpression of miR-16 reduced proliferation and arrested cells at the G1 phase of the cell cycle (Figures 1B, 1C, and S1A). Importantly, expression of miR-K6-5p similarly reduced proliferation and arrested cells at G1. Similar results were obtained in JSC-1, a PEL cell line that is readily transfected by miRNA mimics (Figure 1D and 1E). miR-15/16 family miRNAs are ubiquitously expressed, which makes their direct comparison to miR-K6-5p difficult. To overcome this caveat, we deleted both miR-15/16 family miRNA clusters from 293T cells (293T/DKO). We transduced a resulting cell clone with lentiviral vectors expressing miR-K6-5p or miR-16 (Figures S1B–S1D). Primer extension demonstrated the absence of endogenous miR-16 expression in 293T/DKO, re-expression of physiological levels of miR-16, an accurate 5′ end of miR-K6-5p, and miR-K6-5p expression comparable to the PEL cell line BC-3. Lentiviral miR-K6-5p and miR-16 similarly reduced live cell 293T/DKO numbers. Together, these results demonstrate that miR-K6-5p has cell cycle inhibitory properties similar to miR-16.
miR-K6-5p Mimics miR-16-Induced Effects on mRNA Expression
We used mRNA sequencing (mRNA-seq) to determine whether phenotypic mimicry between miR-K6-5p and miR-16 is due to functional mimicry at the level of mRNA regulation. mRNA-seq was performed in 293T cells lacking Dicer (293T/NoDice) (Bogerd et al., 2014), which do not express any Dicer-dependent miRNAs, including miR-15/16 family miRNAs, and thus provide a clean background. Both miR-16 and miR-K6-5p caused cell cycle arrest in 293T/NoDice cells (Figures S1E and S1F). Interestingly, however, miR-16 caused G1 arrest, while miR-K6-5p-transfected cells may instead arrest at G2, hinting at cell-type dependent functional differences between these miRNAs. The mRNA-seq experiment also included a variant of miR-K6-5p with a 5′-terminal C to U substitution (miR-K6-5p-5′U). miR-K6-5p-5′U controls for effects of the 5′-C of miR-K6-5p, which is rare in cellular miRNAs and may lead to suboptimal loading into RISC (Seitz et al., 2011). Because the miRNA 5′-nucleotide does not participate in target selection, this substitution should not alter the range of regulated mRNAs. Finally, we included miR-214, which shares its exact seed (nucleotides 2–7) with miR-K6-5p (Figure 1A). miR-214 is a poorly conserved cellular miRNA of largely uncharacterized function.
Despite its offset seed region, gene expression changes caused by miR-K6-5p were more similar to miR-16 than to miR-214 (Figure 2A; Table S1). Effects of miR-K6-5p and miR-K6-5p-5′U were indistinguishable (Figures 2A, 2C, and S2A). mRNA expression changes caused by miR-16 and miR-K6-5p were highly correlated, showing that miR-K6-5p mimics miR-16 (Figures 2B and 2C). In contrast, correlation of either miR-16 or miR-K6-5p-induced mRNA expression changes with those caused by miR-214 was more modest (Figures 2C, S2B, and S2C). Gene set enrichment analysis (GSEA) showed that miR-16- and miR-K6-5p-downregulated genes were similarly enriched in functional categories linked to cellular proliferation (Figure S2D; Subramanian et al., 2005). Together, these results show that miR-K6-5p-induced mRNA expression changes more closely resemble those induced by miR-16, whose seed is offset by one nucleotide, than by miR-214, which shares its exact seed (nucleotides 2–7) with miR-K6-5p.
Figure 2. miR-K6-5p Mimics miR-16-Induced Gene Expression Changes.

(A) Principle component analysis of mRNA-seq data in 293T/NoDice.
(B) Pearson’s correlation compares mRNA log2 fold changes caused by miR-16 or miR-K6-5p.
(C) Pearson’s coefficients from other comparisons in the mRNA-seq dataset, as in (B).
(D–F) Cumulative distribution frequency (CDF) plots depicting regulation of the top 250 TargetScan-predicted targets of the listed miRNAs by mimics of miR-16(D), miR-214 (E), or miR-K6-5p(F) in the mRNA-seq data. Numbers in parentheses are gene set sizes and p values for comparisons to all mRNAs, calculated using 2-sample Kolmogorov-Smirnov (K-S) tests.
(G) Heatmap showing Z scores for mRNAs among the top 250 TargetScan-predicted miR-15/16 family miRNA targets that contribute to the enrichment in cell-cycle-related categories detected by DAVID.
miR-K6-5p Downregulates miR-16 Targets
We next asked whether miR-K6-5p regulates miR-16 targets. To establish a set of high confidence miR-16 targets, we used our mRNA-seq data to compare miR-16-mediated regulation of mRNAs that were predicted as miR-15/16 family miRNA targets by TargetScan or experimentally identified as candidates for miR-16 targets by the crosslinking-based methods PAR-CLIP or CLASH (Agarwal et al., 2015; Gay et al., 2018; Gottwein et al., 2011). While each set of miR-16 candidate targets was significantly repressed by miR-16, the top 250 Targetscan-predicted targets were most strongly regulated and therefore used for further analyses (Figure S2E). Targetscan predicts and ranks targets of cellular miRNAs based on the number and types of seed matches, evolutionary conservation and sequence context (Agarwal et al., 2015). Regulation of the predicted miR-15/16 family miRNA targets by miR-16 was specific, because predicted targets of miR-214, the tumor-suppressive miRNA miR-34a, the tissue-specific miR-1, or the oncomiRs miR-155 or miR-21 were not substantially affected by miR-16 (Figure 2D). miR-214 significantly regulated predicted targets of miR-214, but only weakly downregulated predicted targets of miR-15/16 family miRNA (Figure 2E). Strikingly, miR-K6-5p specifically downregulated miR-16 targets (Figure 2F). In contrast, miR-K6-5p failed to repress predicted targets of miR-214 (Figure 2F). The top 250 predicted miR-15/16 family miRNA targets were highly enriched for cell cycle regulators (Table S2). The large majority of the mRNAs encoding these cell cycle regulators was repressed by both miR-16 and miR-K6-5p, but not miR-214 (Figure 2G). Therefore, functional mimicry of miR-16 by miR-K6-5p extends to the repression of mRNAs encoding cell cycle regulators, including, for example, the known miR-16 targets CCND3 (Liu et al., 2008) and CDC25A (Pothof et al., 2009). We obtained similar results by analyzing mRNAs based simply on the presence of canonical 3′UTR miRNA binding sites (Figures S2E–S2I). Together, these results further support the conclusion that miR-K6-5p is functionally closer to miR-16 than to miR-214 and show that miR-K6-5p represses a large subset of the conserved targets of miR-15/16 family miRNA, including many cell cycle regulators.
miR-K6-5p Shares Binding Sites with miR-16
We next tested whether miR-K6-5p regulates miR-16 targets through shared binding sites. CLASH (crosslinking, ligation, and sequencing of hybrids) (Helwak et al., 2013) employs ligation reactions that allow direct identification of the targeting miRNA. A published CLASH dataset from KSHV-infected endothelial cells (Gay et al., 2018) identified 18 3′UTR:miR-K6-5p hybrids with perfect seed base pairing to miR-K6-5p. Of these sites, 11 (61%) were also ligated to miR-16, which offers direct evidence that miR-K6-5p shares a substantial portion of its binding sites with miR-16 (Table S3). A closer look at the sites identified by qCLASH and the miR-16 targets that are repressed by miR-K6-5p in the mRNA-seq dataset reveals that the trinucleotide repeat seed sequences of miR-16 and miR-K6-5p enable substantial overlap in binding sites. Specifically, seed matches to nucleotides 2–8 of miR-16 that are immediately flanked by a 3′G (“miR-16 2-8G”) or a 5′GC (“miR-16 GC2-8”) are canonical miRNA binding sites for miR-K6-5p (Figure 3A). Together, these sites are surprisingly abundant. For example, ~51% of all mRNAs with 2-8-mer seed matches to miR-16 in the mRNA-seq dataset contain 2-8G and/or GC2-8 sites for miR-K6-5p. However, our analyses also suggest that both miR-K6-5p and miR-16 have some targets that are not expected to be shared (Figure 3A; Table S1).
Figure 3. miR-K6-5p Regulates Target mRNAs via miR-16 Binding Sites.

(A) Diagram of canonical target sites (green) expected to be shared or preferential for miR-16 and miR-K6-5p. Nucleotides 2–7 seed sequences are in red. V denotes A, C, or G.
(B) The miR-16 binding site in a firefly (FLuc) luciferase 3′UTR reporter vector for BCL2 was mutated and tested for regulation by mimics of miR-16 or miR-K6-5p in dual luciferase reporter assays in 293T/NoDice cells. Fluc data were sequentially normalized to data from a co-transfected Renilla luciferase (RLuc) control, the empty FLuc vector, and negative control mimic (ctrl). n = 3. *p < 0.05, **p < 0.01, ***p < 0.001, ****p < 0.0001. Data are represented as mean ± SEM. See Figure S3A.
(C) Heatmap showing Z scores for mRNAs that represent different types of targets of miR-16 and/or miR-K6-5p and were chosen for validation experiments presented in Figures S3B–S3M.
To directly test regulation of specific types of sites by miR-16 and miR-K6-5p, we systematically mutated the known miR-16 binding site in the 3′UTR of BCL2 in the context of a luciferase reporter (Figures 3B and S3A). Results confirmed that the miR-16 2-8G and 2-9G sites were strongly regulated by both miRNAs, miR-16 2-8A and 2-9A sites were preferentially regulated by miR-16, while the miR-K6-5p 2s-8 site (2-7G for miR-16) was strongly regulated only by miR-K6-5p.
To validate this concept for natural mRNA targets, we subjected the top regulated mRNAs that illustrate these regulatory relationships to dual 3′UTR luciferase reporter assays (Figure 3C), including likely mediators of the tumor-suppressive roles of miR-15/16 family miRNAs. We tested wild-type and target site mutant 3′UTRs for known miR-16 targets expected to be shared with miR-K6-5p (CDC25A, BCL2L2) (Chang et al., 2007), CCND3, and PDCD4 (Fu et al., 2018); known miR-16 targets with preferential regulation by miR-16 over miR-K6-5p (MYB) (Chung et al., 2008), ANLN (Lian et al., 2018), and CCND1 (Chen et al., 2008); and candidates for miR-K6-5p targets that are unlikely shared by miR-16 (BCL7B, VASP, and STAT3). STAT3 is a known target of miR-K6-5p (Ramalingam and Ziegelbauer, 2017). Results overall confirmed the predicted regulatory outcomes (Figures S3B–S3K). We also confirmed these regulatory effects for a subset of the encoded proteins (Figures S3L and S3M). Together, these data illustrate that miR-K6-5p substantially mimics miR-16-induced changes in gene expression by regulating an overlapping set of mRNA binding sites. Shared targets include regulators of cellular proliferation and survival, which may underlie the reported tumor-suppressive functions of miR-16. A smaller subset of targets is preferential for either miR-16 or miR-K6-5p. Our results so far reveal that miR-K6-5p shares a large portion of its binding sites with miR-16, and thereby strongly, but incompletely, mimics miR-16.
miR-K6-5p Confers a Competitive Disadvantage in the KSHV-Transformed PEL Cell Line BC-3
We finally examined the role of miR-K6-5p in the context of KSHV infection. There are currently no de novo infection models that capture KSHV-induced oncogenic transformation, proliferation, and survival of human cells. However, PEL cell lines are a robust model for B cell transformation by KSHV, as they require latent KSHV infection for proliferation (Godfrey et al., 2005; Guasparri et al., 2004; Wies et al., 2008). miR-K6-5p is highly expressed in BC-3 cells, but lower in the BC-1 and BCBL-1 cell lines (Figure 4A). Accordingly, a miR-K6-5p-specific miRNA sensor detects robust miR-K6-5p activity in BC-3 cells, but not in BC-1, BCBL-1, or JSC-1 cells (Figures S4A–S4C). Interestingly, BC-3 cells also express very high levels of the KSHV oncogenes vCyc and miR-K11 (Figures 4B and S4B; Gottwein et al., 2011; Järviluoma et al., 2004). Based on these results, we sought to stably inhibit miR-K6-5p in the PEL cell line BC-3. We designed a miR-K6-5p-specific lentiviral sponge inhibitor to trigger miR-K6-5p degradation (8SK6-5p) (Figure 4C; Ebert et al., 2007). We confirmed specific inhibition of miR-K6-5p over miR-16 by 8SK6-5p (Figure S4D). PEL and other tumor cell lines express few genetic liabilities (i.e., genes whose inactivation leads to increased cellular fitness) (Hart et al., 2015; Manzano et al., 2018; Wang et al., 2014, 2017). Consistent with this idea, cell cycle analysis of 8SK6-5p-transduced cells suggested a trend toward increased numbers of cells in S phase and a corresponding decrease in G1; however, these changes were too subtle to reach significance over three independent experiments (Figure S4E). As a more sensitive readout for altered proliferation upon inactivation of miR-K6-5p, we performed a competitive fitness experiment (Figure 4D). For this, we selected empty lentivirus or 8SK6-5p-transduced BC-3 cells by fluorescence-activated cell sorting (FACS) and confirmed the specific inhibition of miR-K6-5p over miR-16 (Figures 4E and S4F). miR-K6-5p-inhibited cells, but not empty vector control cells, significantly outcompeted naive BC-3 cells by <5% per passage (Figure 4F), showing that miR-K6-5p indeed negatively regulates proliferation in the context of KSHV-infected BC-3 cells.
Figure 4. miR-K6-5p Confers a Competitive Disadvantage in the KSHV-Transformed PEL Cell Line BC-3.

(A) Proportion of small RNA reads for miR-15/16 family miRNAs and miR-K6-5p in small RNA sequencing datasets from the PEL cell lines BC-3, BC-1, and BCBL-1 (Gottwein et al., 2011).
(B) Western blots for KSHV vCyc, LANA, vIRF3, and for GAPDH in the same PEL cell lines and KSHV-negative Ramos cells. Representative of n > 3.
(C) Diagram of the lentiviral miR-K6-5p-sponge (8SK6-5p).
(D) Diagram of experimental design for competition assay in (F).
(E) TaqMan qRT-PCR to assess miR-16 or miR-K6-5p expression in sponge-transduced and sorted BC-3 cells. n = 3.
(F) Results from competition experiments in BC-3. n = 5.
Throughout the figure, *p < 0.05, **p < 0.001. Data are represented as mean ± SEM.
In sum, KSHV encodes a viral mimic of the tumor-suppressor miR-15/16 family miRNAs. miR-K6-5p may function to balance viral oncogenes that can cause uncontrolled cellular survival and proliferation.
DISCUSSION
KSHV encodes several viral oncogenes that promote cellular proliferation and survival. These viral oncogenes likely enable persistent KSHV infection in the healthy host but promote tumor formation in the context of immunodeficiency. Here, we report that KSHV miR-K6-5p is an oncoviral mimic of a bona fide tumor suppressor, the miR-15/16 family of miRNAs. Ectopic expression of miR-K6-5p phenocopied miR-16-induced cell cycle arrest and miR-16-induced changes in cellular mRNA expression. miR-K6-5p regulates miR-16 targets through conserved miR-16 binding sites, including potential mediators of the tumor-suppressive roles of miR-15/16 family miRNAs. In the KSHV-transformed PEL cell line BC-3, inhibition of miR-K6-5p resulted in a proliferative advantage. Although miR-K6-5p shares its 6-mer seed with miR-214, miR-K6-5p was functionally more distinct from miR-214 than from miR-16. This is most likely explained by the weak regulatory potential of the minimal 6-mer seed match together with the suboptimal target sequence context and regulatory capacity of poorly conserved miRNAs (Friedman et al., 2009), such as miR-214.
At first glance, it is counterintuitive that an oncogenic virus encodes a miRNA with cell-cycle-inhibitory and tumor-suppressive properties. However, herpesviruses co-evolve with their host and are exquisitely adapted to establish persistent infection without severe pathogenic consequences. Viral oncogenesis can be seen as a non-physiological result of infection that does not benefit viral persistence or transmission (Moore and Chang, 2017). Expression of miR-K6-5p is transcriptionally coupled to that of several KSHV oncogenes encoded in the latency locus (i.e., LANA, vCyc, vFLIP, miR-K1, miR-K9, and miR-K11). We propose that miR-K6-5p may function as a built-in negative regulator to balance the pro-proliferative and pro-survival functions of these oncogenes. Unchecked expression of the viral oncogenes could elicit host responses such as the induction of oncogene-induced senescence (Leidal et al., 2012), which would limit viral maintenance. Unchecked viral oncogene expression could also cause severe pathogenesis (i.e., cancer). Because miR-15/16 family miRNAs are ubiquitously expressed, miR-K6-5p must be highly expressed to overexpress overall miR-16-like activity in the context of infection. These conditions are found in the PEL cell line BC-3. The intronic region encoding most of the KSHV miRNAs, including miR-K6-5p, is also highly expressed in KS lesions (Rose et al., 2018). In BC-3 cells, very high KSHV miRNA expression likely results in a competitive reduction of overall cellular miRNA expression (Gottwein et al., 2011). It is then also possible that miR-K6-5p maintains overall miR-15/16 family miRNA-like activity under conditions of saturation of the miRNA pathway. Other evidence that KSHV deregulates miR-15/16 family miRNA expression has not been reported.
miR-K6-5p may have advantages for the virus in addition to the overexpression of miR-15/16 family miRNA-like functions. The expression of miR-15/16 family miRNAs is cell cycle regulated (Rissland et al., 2011). It is possible that miR-K6-5p escapes similar cell cycle regulation and thereby differs from miR-15/16 family miRNAs, although this remains to be tested. miR-K6-5p has also evolved at least some targets that are not shared with miR-15/16 family miRNAs and thus introduces unique regulatory interactions into infected cells. These include the regulation of STAT3 and its associated signaling outcomes (Ramalingam and Ziegelbauer, 2017). The differential cell cycle regulation by miR-K6-5p and miR-16 in 293T/NoDice could also results from the cell-type-specific importance of differentially regulated targets, although it is similarly possible that it is due to the absence of other miRNAs in this system. An incomplete functional overlap with their cellular counterparts is similarly typical for tumor viral oncogenes. While this study presents evidence of an unexpected viral mimic of a cellular tumor suppressor, EBV EBNA3B also reduces the oncogenic potential of this virus in mice (White et al., 2012). However, the tumor-suppressive function of EBNA3B results from increased recruitment of T cells to EBV-infected B cells, while miR-K6-5p acts in a direct, cell intrinsic manner.
Our results show that KSHV encodes both positive (vCyc, miR-K11) and negative (miR-K6-5p) regulators of the cell cycle. Analysis of all viral miRNAs listed in miRbase 22 did not identify other candidates for mimics of tumor-suppressive host miR-15/16 family miRNAs or miR-34a/c. However, published PAR-CLIP data suggest that other miRNAs encoded by KSHV or the tumor virus Epstein-Barr virus (EBV) are also likely to repress several pro-survival and proliferative genes, including the critical oncogenes cyclin D2, MDM2, and IRF4 (Gottwein et al., 2011; Manzano et al., 2018). It is therefore possible that the roles of miR-K6-5p and other KSHV or EBV miRNAs include the maintenance of cellular homeostasis.
In sum, we show that the oncogenic herpesvirus KSHV encodes a mimic of the cellular tumor-suppressive miR-15/16 family of miRNAs. This finding highlights the complexity of KSHV-mediated regulation of host gene expression, which must balance the need to maintain a latent viral reservoir with avoiding detrimental pathogenic outcomes that would limit viral persistence.
STAR★METHODS
LEAD CONTACT AND MATERIALS AVAILABILITY
Further information and/or requests for resources and reagents should be directed to and will be fulfilled by the Lead Contact, Dr. Eva Gottwein (e-gottwein@northwestern.edu). All unique/stable reagents generated in this study are available from the Lead Contact with a completed Materials Transfer Agreement
EXPERIMENTAL MODEL AND SUBJECT DETAILS
For the experiment shown in Figures 1B, 1C, and S1A, primary lymphatic endothelial cells (LEC, PromoCell, adult female donor 419Z035.4) were maintained in Endothelial Cell Basal Medium MV2 supplemented with Growth Medium MV2 supplement pack (PromoCell) and used before passage 7. For small RNA-sequencing, subconfluent LEC (Lonza, adult female donor 5F1290) were harvested at passage 8. 293T/NoDice and 293T/DKO cells were maintained in Dulbecco modified Eagle medium (DMEM) containing 4.5 g/liter glucose and L-glutamine (Corning), supplemented with 10% Serum Plus-II (Sigma-Aldrich). The PEL cell lines BC-3 and BC-1 were maintained in RPMI 1640 medium containing L-glutamine (Corning), supplemented with 0.05mM b-mercaptoethanol (Sigma-Aldrich) and 20% Serum Plus-II (Sigma-Aldrich). The PEL cell lines BCBL-1 and JSC-1, as well as the KSHV-negative B cell line BJAB were maintained similarly but with 10% Serum Plus-II.
METHOD DETAILS
Cloning procedures
Oligonucleotides and dsDNA fragments used in cloning procedures are listed in Table S4. Lentiviral miRNA expression vectors were based on the published vector pLCE (Zhang et al., 2009). To clone the miR-16-1 expression vector, a 250bp fragment centered on the miR-16-1 pre-miRNA stem-loop was amplified from genomic DNA from the PEL cell line BC-1, using the primers 1559 and 1560, which add XhoI and NotI cloning sites. Because the natural pre-miR-K6 stem-loop expresses higher levels of miR-K6-3p than miR-K6-5p, we designed a strategy to express only miR-K6-5p from the miR-122 stem-loop, which is naturally processed to produce high levels of the mature 5p miRNA and with almost no expression of the 3p arm. We re-engineered pri-miR-122 to replace the miR-122-5p sequence miR-K6-5p, while maintaining the predicted secondary structure of the stem-loop (Figure S1B). A dsDNA fragment encompassing a 250 bp hybrid pri-miR-122/K6-5p sequence and flanking XhoI and NotI cloning sites was ordered from Epoch Life Science (Missouri City, TX), cloned in the intermediate vector pBSK. To simultaneously delete the human miR-15a/16-1 and miR-15b/16-2 loci in 293T/DKO, we employed the double nicking strategy by Cas9 D10A to avoid off-target effects (68). Specifically, we designed 8 sgRNAs, with 2 sgRNAs on each side of the miR-15a/16-1 and miR-15b/16-2 loci. The relevant oligonucleotides were annealed and cloned into BbsI-digested (Fermentas) pX335, which encodes the Cas9 D10A nickase mutant. Full-length wild-type 3′UTR sequences were amplified from PEL cell line genomic DNA, and cloned into the published firefly luciferase reporter construct pL/SV40/Fluc (pLSG) (Gottwein et al., 2007), using XhoI and Notl restriction sites. For 3′UTR reporter mutants, miRNA target sites were mutated individually and in combination using PCR with mutant primers and inserted between the XhoI and NotI restriction sites of pLCE using Gibson assembly (Gibson, 2011). 8SK6-5p was based on the previously described lentiviral vector pLCE (Zhang et al., 2009) and constructed by annealing of 2 pairs of ultramer oligonucleotides (Integrated DNA Technologies) and insertion between XhoI and XbaI sites in the 3′UTR of pLCE by three-fragment ligation. For cleavage sensors of miRNA activity (pLCG-3T16, pLCG-3TK6-5p, pLCG-3TK3, pLCG-3TK11; Figures 4B and S4B–S4D), oligonucleotides were designed and annealed to create sequences containing 3 sites of perfect complementarity to the relevant miRNA and inserted between Xho1 and Xba1 sites of the published lentiviral reporter vector pL/CMV/Fluc (pLCG) (Linnstaedt et al., 2010). Complete sequences of all inserts were verified by Sanger sequencing.
Generation of HEK293T/DKO cell line
The eight sgRNA constructs described above were co-transfected in 293T cells. After 2 days, cells were single-cell cloned into 96-well plates at a calculated 0.25 cells/well. Cell clones were PCR-screened for homozygous deletions using the primer pairs 1824/1825 (for miR-15a/miR-16-1) and 1903/1909 (for miR-15b/miR-16-2). Loss of mature miR-16 expression was confirmed from clones positive for homozygous deletions by primer extension and Taqman miRNA assay.
Luciferase reporter assays
For miRNA binding site validation in 293T/NoDice cells, cells were seeded at 200,000 cells per well in 24-well plates. The next day, cells were co-transfected with 2.5ng/ml pLSG (empty vector, or modified to include wt or mutant test 3′UTRs); 5ng/ml of the internal control pL/SV40/Rluc (pLSR) Renilla luciferase construct (Gottwein et al., 2007); 5pmol of negative control #1, miR-16, or miR-K6-5p mimics (miRVana); and 0.3 μg of pLCE as a DNA carrier. Cells were transfected using lipofectamine 2000 as instructed by manufacturer (Life Technologies). Two days later, growth medium was aspirated and cells were lysed in 1X passive lysis buffer (Promega) without washing. 5 uL of lysate from each condition were loaded into a 96-well half-area well plate (Greiner) and dual luciferase assays were performed using Promega Dual Luciferase Kit on a Victor Nivo plate reader. Firefly activity was normalized to Renilla luciferase from the same well and resulting ratios were further normalized to those from wells that had received the empty pLSG vector and the control mimic. Reporter assays shown in Figure S4C–D were done similarly, except that 0.4 nM of either control, miR-16, or miR-K6-5p mimic (miRVana) were used. For lentiviral reporter assays in PEL cell lines and BJAB, cells were seeded at 250,000 cells/ml in 24-well plates and co-transduced with lentiviruses pLCG (empty vector control), pLCG-3T16, pLCG-3TK6-5p, pLCG-3TK3, or pLCG-3TK11 and pL/CMV/RLuc (pLCR, Renilla luciferase internal control) (Linnstaedt et al., 2010). Two days later, cells were pelleted, lysed in 100 uL 1X passive Lysis Buffer (Promega) and processed for dual luciferase reporter assays as above. Firefly luciferase activities were normalized for Renilla luciferase activities. For sorted BC-3 sponge cells (Figure S4F), the data were further normalized to those obtained using the empty pLCG vector and pLCE-transduced cells. For miRNA sensor assays shown in Figures S4B and S4C, data were sequentially normalized to RLuc expression, the empty pLCG vector, and to the KSHV-negative B cell line BJAB. Statistical analyses were performed using paired, two-tailed Student’s t tests.
Western blot analysis
293T/NoDice cells were transfected with 10 nM concentrations of control, miR-16, or miR-K6-5p mimic using lipofectamine RNAiMax as instructed by manufacturer. 2 days later, cells were harvested for western blot analysis. PEL cell lines were split to 250,000 cells/ml, and cells were harvested for western blot analysis the next day. Culture medium was aspirated, cells were washed with 1X Phosphate Buffered Saline (PBS) (Corning), and scraped into 100 uL ice-cold RIPA lysis buffer containing 1X protease inhibitor cocktail III (Calbiochem, EMD Millipore, Darmstadt, Germany) and 1X PhosSTOP phosphatase inhibitor cocktail (Roche, Mannheim, Germany). Cells were briefly vortexed and then lysed on ice for 15 minutes. Lysates were sonicated for 30 s intervals (30 s on, 30 s off) for 7 cycles of sonication in a 4°C water bath using the Bioruptor Sonication System (Diagenode, Denville, NJ) at the high-intensity setting. Sonicated lysates were cleared by centrifugation at 16,000 x g for 15 minutes at 4°C. Lysates were subsequently quantified using ThermoFisher BCA kit. NuPAGE LDS sample buffer was added to a final concentration of 1X(ThermoFisher Scientific), samples were heated at 70°C for 10 minutes. Equal protein amounts were run on 4%-12% Bis/Tris gels in 1X NuPAGE MOPS SDS Running Buffer (ThermoFisher Scientific). Proteins were transferred to nitrocellulose membranes, which were blocked using 5% non-fat milk powder in 1X PBS for 1 hour at room temperature. Primary antibodies are listed under Key Resources and were used at indicated dilutions, in 5% non-fat milk powder in 1X PBS and 0.2% Tween20 and incubated overnight at 4°C. Membranes were washed 3 times in 1X PBS containing 0.2% Tween20. Primary antibodies were detected with IRDye 800 CW-conjugated goat anti-rabbit or anti-mouse IgG secondary antibodies (LI-COR Biosciences, Lincoln, NE), diluted 1:20,000 in 1X PBS, 1 hour RT), and imaged with the Odyssey Fc Dual-Mode Imaging System (LI-COR) for all proteins except KSHV LANA and vCyc. Primary antibodies against KSHV LANA and vCyc were detected with a horseradish peroxidase-conjugated anti-rat IgG secondary antibody, developed using Super-Signal West Femto Maximum Sensitivity Substrate (ThermoFisher Cat No. 34095), and imaged with the Odyssey Fc Dual-Mode Imaging System (LI-COR) using the chemiluminescence setting. Results were quantified using ImageStudio and compared statistically using paired, two-tailed Student’s t tests.
Growth curve and cell cycle analyses
LEC were seeded in 6-well plates at 100,000 cells per well. The next day, cells were transfected with 10 nM control, miR-16, or miR-K6-5p mimic (miRVana) with Lipofectamine RNAiMax (ThermoFisher Scientific, Cat No: 13778150) diluted in Opti-MEM as instructed by the manufacturer. For growth curve analysis, cells were counted manually and split to equal numbers every other day for 8 days. Total cell numbers were calculated using dilution factors from the previous days, and normalized to the total cell numbers for control-transfected cells. Propidium iodide (PI) staining of LEC for cell cycle analysis was performed two days after transfection. LEC were trypsinized, washed once with 1X PBS and fixed at −20°C overnight using 70% ethanol. Fixed cells were pelleted, washed three times with 1X PBS, resuspended and stained for 30 minutes in 500 μL propidium iodide (PI)/RNase staining buffer (BD PharMingen). PI-stained cells were subjected to flow cytometry and resulting data were analyzed by FlowJo, by fitting to the Watson (Pragmatic) cell cycle model.
293T/NoDice cells were seeded in 12-well plates at 400,000 cells per well, and transfected the next day as described for LEC. For growth curve analysis, cells were counted manually and split to equal numbers every other day for 8 days. Total cell numbers were calculated using dilution factors from the previous days, and normalized to the total cell number for control-transfected cells. For cell cycle analysis in 293T/NoDice by PI/anti-bromodeoxyuridine (BrdU) co-staining, cells were split 1:2 one day after transfection and analyzed the next day. For this, transfected cells were pulsed with 75 μM BrdU for 45 minutes. Cells were then trypsinized, washed with 1X PBS, and fixed at −20°C overnight using 70% ethanol. Fixed cells were pelleted, washed 3 times with PBS containing 0.5% BSA, and then incubated with 1.5M HCl for 30 minutes to denature DNA. Cells were washed 3 times in PBS containing 0.5% BSA before incubation with 20 μL FITC-anti-BrdU (BD Biosciences) diluted in PBS containing 0.5% BSA for 30 minutes at room temperature in the dark. Cells were washed once with PBS containing 0.5% BSA, resuspended in 500 μL PI/RNase staining buffer (BD PharMingen) and incubated in the dark at room temperature for 30 minutes. PI and anti-BrdU co-stained cells were analyzed by flow cytometry on a FACS Canto II and resulting data were analyzed in FlowJo.
JSC-1 cells were split to 250,000 cell/mL the day before the experiment. The next day, cells were again seeded 250,000 cell/mL in 12-well plates and transfected with miRNA mimics at the same concentrations used for LEC and 293T/NoDice described above, but using Lipofectamine 3000 diluted in Opti-MEM as instructed by the manufacturer (ThermoFisher Scientific, Cat No: L3000015). For growth curve analysis, cells were counted manually and split to equal numbers every other day for 8 days. Total cell numbers were calculated using dilution factors from the previous days, and normalized to the total cell numbers for control-transfected cells. For cell cycle analysis, cells were pulsed with 75 μM BrdU two days after transfection for 45 minutes, pelleted at 400xg for 5 min, washed with 1X PBS, and fixed at −20°C overnight using 70% ethanol. The next day, cells were processed for staining as described above for 293T/NoDice.
293T/DKO cells were seeded at 800,000 cells per well in 6-well plates. The next day, 293T/DKO cells were transduced with pLCE, pLCE-122-K6-5p, or pLCE-miR-16-1 at a multiplicity of infection (MOI) of 5. Cells were counted manually and split to equal numbers every other day for 14 days. Total cell numbers were calculated using dilution factors from the previous days, and normalized to the total cell numbers for control-transfected cells.
Lentivirus production – sponge experiments
pLCE-based vectors were produced by co-transfection with pMDLgpRRE, pRSV-Rev, and pVSV-G into 293T cells using polyethylenimine HCl MAX (PEI, Polysciences, Cat No: 24765) at a ratio of PEI:DNA = 3 μL (stock solution 15.6mM, pH 7.4):1 μg, diluted in Opti-MEM (GIBCO, Cat No: 11058021). Medium was exchanged to BC-3 growth medium 6 hours after transfection. 72 hours after transfection, supernatants were harvested, centrifuged to remove debris, filtered through 0.45 μm syringe filters, and concentrated using 100kDa cutoff Amicon Ultra-15 centrifugal filters (Fisher, Cat No: UFC910024). Resulting concentrated viruses were titrated in BC-3 cells by serial dilutions and measuring %GFP(+) cells by FACS.
Cell cycle analysis in BC-3
For Figure S4E, BC-3 cells were seeded at 250,000 cells/ml in 2 mL and transduced with pLCE or pLCE-8SK6-5p at an MOI of 5, in the presence of 4 μg/ml polybrene. Cells were pelleted and resuspended in fresh media one day after transduction. Two days after transduction, cells were split 1:4 to a total of 8ml. On day 3 after transduction, cells were pulsed with 75uM BrdU for 45 minutes, then pelleted and fixed in 4% formaldehyde (Thermo Scientific, Cat No. 28908) on ice for 30 minutes, which retains intracellular GFP. After fixation, all centrifugation steps were performed at 700xg for 5 min. Cells were washed 3 times in 400 μL PBS containing 0.5% BSA and permeabilized in 400 μL PBS containing 0.1% Triton X-100 at room temperature for 15 minutes. Cells were again washed 3 times in 400 μL PBS containing 0.5% BSA and treated with 5 μL DNase I in a total volume of 50 μL 1X RQ1 DNase buffer diluted in PBS at 37°C for 30 minutes (Promega RQ1 DNase, Cat No. PAM6101). Cells were then washed 3 times in PBS containing 0.5% BSA and incubated with 5 μL APC-anti-BrdU diluted in 95 uL PBS containing 0.1% Triton X-100 (Biolegend, Cat No. 339807) for 30 minutes in the dark at room temperature. Cells were then washed once in PBS + 0.5% BSA, and incubated with 5 μL 7-Amino-Actinomycin D (7-AAD, BD PharMingen, Cat No. 559925) diluted in 95uL 1X Annexin Binding buffer (10X stock BD PharMingen, Cat No. 556454, diluted to 1X with commercial water) for 30 minutes in the dark. The volume was then brought up to 400 L with 1X Annexin binding buffer prior to analysis using a FACS CantoII. Resulting data were analyzed in FlowJo, gated on the top 30% GFP-expressing cells, and analyzed for BrdU incorporation by APC-anti-BrdU and total DNA staining by 7-AAD.
Competition assay
BC-3 cells were seeded at 250,000 cells/ml and transduced with pLCE or pLCE-8SK6-5p at an MOI of 5, in the presence of 4 μg/ml polybrene. Media were exchanged the next day and 2 days after transduction cells were sorted on a FACS Aria to collect the top ~25% GFP-expressing cells (RHLCC Flow Cytometry Core, Northwestern University). Sorted cells were seeded at 500,000 cells/ml and allowed to recover and expand for several days before functional assays. We derived three independent cell pools by individual transductions and sorts. For competition assays, sorted GFP(+) cells from each transduction were counted and mixed with matched naive BC-3 cells at a ratio of approximately 1:10 (10% GFP(+) and 90% naive BC-3). Cell mixes were subjected to flow cytometry to determine the baseline %GFP for day 0 and subsequently split to 250,000 cells/ml every other day, and the percentage of GFP(+) cells was measured by flow cytometry every 4 days for 28 days. Two technical replicates per mixed populations were completed for each of five biological replicates (n = 5, including 2 replicates from sort 1 and 3 and one replicate from sort 2). Data from technical replicates were averaged before analysis of biological replicates. For the analysis of biological replicates, data were sequentially normalized to the percentage of GFP+ cells measured on day 0 and then to data from the pLCE control.
RNA preparation and miRNA quantification
For small RNA sequencing library preparation from LEC, subconfluent LEC were resuspended inTRIzol (ThermoFisher Scientific, Cat No: 15596018) and RNA was extracted as instructed, except that the 70% ethanol was performed with 95% ice cold ethanol to avoid extracting small RNAs. For mRNA-Seq, 293T/NoDice cells were seeded in 6 well plates at 800,000 cells per well. The next day, cells were transfected with 10 nM control, miR-16, or miR-K6-5p mimic (miRVana) with Lipofectamine RNAiMax (ThermoFisher Scientific, Cat No: 13778150) diluted in Opti-MEM as instructed by the manufacturer. Two days after transfection, growth media were aspirated, cells were resuspended in TRIzol without washing, and RNA was isolated using the Direct-zol RNA MiniPrep Plus kit (Zymo Research, Cat No R2070), omitting the DNase treatment step. For mRNA-Seq, total RNA was submitted to the University of Chicago Genomics core facility. For quantitative real-time PCR (qRT-PCR), total RNA was treated with RQ1 DNase for 30 minutes at 37°C as instructed (Promega, Cat No: PAM6101). The DNase reaction was stopped with RQ1 Stop Solution for 10 minutes at 65°C (Promega). qRT-PCR was performed on 5 ng of total RNA using TaqMan mature miRNA assays and an RNU48 control as instructed (Life Technologies). Real time PCR was performed on a Roche LightCycler® 480 system and data were analyzed using the double delta CT method, with results from miR-16 and miR-K6-5p expression normalized to those from the control RNU48.
Small RNA Illumina library preparation and data processing
18-25nt long small RNAs were gel purified from 50 μg total RNA and subjected to small RNA cDNA library preparation protocol with a barcoded 5′adaptor (TTGGC) as described (Gottwein et al., 2011). Resulting PCR products were purified from 10% TBE gels, pooled, sequenced on the Illumina GAII platform, and analyzed as described (Gottwein et al., 2011).
Bioinformatics
For mRNA-Seq analysis, the quality of DNA reads, in fastq format, was evaluated using FastQC. Adapters were trimmed and the reads were aligned to the human genome (hg19) using STAR (Dobin et al., 2013). Read counts for each gene were calculated using htseq-count (Anders et al., 2015) in conjunction with a gene annotation file for hg19 obtained from Ensembl GRCh37.75 (http://useast.ensembl.org/index.html). Normalization and differential expression were determined using DESeq2 (Love et al., 2014). For all bioinformatics analysis, only genes that had measurable expression in all samples were considered. Pearson correlation coefficients were calculated from pairwise comparisons of log2 fold changes using pandas. GSEA was conducted on gene lists that were ranked by fold change using GSEA preranked and the classic enrichment statistic under default settings. For 3′UTR seed matching, annotated 3′UTRs were extracted from the human genome using the BioMart tool on Ensembl GRCh37.75 (http://useast.ensembl.org/biomart/martview/31e929517b8adf1672b40a5a4bd25b01). A custom perl script was used to collect all annotated 3′ UTRs for each gene. For genes with more than one annotated 3′ UTR, the longest 3′UTR was kept for analysis. miRNA binding sites were identified using a custom pipeline available on Code Ocean (https://codeocean.com/capsule/5364796/tree/v1). The analyzed mRNA-Seq dataset can be found in Table S1 and raw data are available in GEO (GSE128576). Targetscan predictions for miR-15/16, miR-214, miR-34, miR-1, miR-155, and miR-21 were downloaded from the Targetscan 7.1 website, sorted from low to high cumulative weighted context++ scores and filtered for mRNAs that are designated as expressed in the mRNA-Seq dataset and have annotated Ensembl 3′UTRs according to our analysis above. Only 3′UTR targets were considered. The top 250 remaining predicted targets for each miRNA were selected and used for CDF plot analyses and 2-sample Kolmogorov–Smirnov (K-S) tests, which were done using Biopython. DAVID pathway analysis was performed on resulting top 250 predicted miR-15/16 targets using all human genes as background (Huang et al., 2009).
QUANTIFICATION AND STATISTICAL ANALYSIS
p values were computed with Prism 7.0 (GraphPad) using the parametric Student’s t test, paired, two-tailed. Throughout the manuscript, * p < 0.05, ** p < 0.01, *** p < 0.001, **** p < 0.0001. Data are shown as mean ± SEM values from at least three independent experiments. The number of biological replicates for each experiment is indicated in the corresponding figure legend, with more details given in the Method Details section.
DATA AND CODE AVAILABILITY
Custom Code is available on Code Ocean (https://codeocean.com/capsule/5364796/tree/v1). The analyzed mRNA-Seq dataset can be found in Table S1 and raw data are available in GEO (GSE128576). For the small RNA-Seq dataset in LEC, raw data are available in SRA under accession number SRR10231467. The analyzed dataset is available at: https://labs.feinberg.northwestern.edu/gottwein/research/data.html.
Supplementary Material
KEY RESOURCES TABLE
| REAGENT or RESOURCE | SOURCE | IDENTIFIER |
|---|---|---|
| Antibodies | ||
| Myb; rabbit monoclonal, 1:500 | Cell Signaling | Cat# 12319S; RRID:AB_2716637 |
| PDCD4; rabbit monoclonal, 1:1000 | Cell Signaling | Cat# D29C6; RRID:AB_2162318 |
| STAT3; rabbit monoclonal, 1:1000 | Cell Signaling | Cat# 12640S; RRID:AB_2629499 |
| BCL7B; rabbit polyclonal, 1:250 | Life Technologies | Cat# PA5-71985; RRID:AB_2717839 |
| VASP; rabbit polyclonal, 1:500 | Cell Signaling | Cat# 3112S; RRID:AB_2213542 |
| CCND3; mouse monoclonal, 1:250 | Cell Signaling | Cat# 2936S; RRID:AB_2070801 |
| BCL2L2 (BCL-W); rabbit monoclonal, 1:250 | Cell Signaling | Cat# 2724S; RRID:AB_10691557 |
| CDC25A; rabbit polyclonal, 1:250 | Cell Signaling | Cat# 3652S; RRID:AB_2275795 |
| CCND2; rabbit monoclonal, 1:500 | Cell Signaling | Cat# D52F9; RRID:AB_2070685 |
| GAPDH; mouse monoclonal, 1:5000 | Santa Cruz Biotechnologies | Cat# sc-47724; RRID:AB_627678 |
| KSHV LANA, clone LN53; rat monoclonal, 1:1000 | EMD Millipore | Cat# MABE1109 |
| KSHV vIRF3; mouse monoclonal, 1:3000 | ThermoFisher Scientific | Cat# MA1-16663; RRID:AB_568603 |
| KSHV vCyclin; rat monoclonal, 1:500 | Abcam | Cat# ab12208; RRID:AB_298930 |
| FITC-anti-BrdU; mouse clone B44 | BD Biosciences | Cat# 347583; RRID:AB_400327 |
| APC-anti-BrdU; mouse | Biolegend | Cat# 339807; RRID:AB_10900446 |
| Chemicals, Peptides, and Recombinant Proteins | ||
| Lipofectamine RNAiMax | ThermoFisher Scientific | Cat# 13778150 |
| Lipofectamine 2000 | ThermoFisher Scientific | Cat# 11668027 |
| Lipofectamine 3000 | ThermoFisher Scientific | Cat# L3000015 |
| Polyethylenimine HCl MAX (PEI) | Polysciences | Cat# 24765 |
| PI/RNase staining buffer | BD PharMingen | Cat# 550825 |
| TRIzol | ThermoFisher Scientific | Cat# 15596018 |
| 7-Amino-Actinomycin D (7AAD) | BD PharMingen | Cat# 559925 |
| 10X Annexin binding buffer | BD PharMingen | Cat# 556454 |
| Critical Commercial Assays | ||
| Dual Luciferase Assay Kit | Promega | N/A |
| Direct-zol RNA MiniPrep Plus kit | Zymo Research | Cat# R2070 |
| RQ1 DNase Kit | Promega | Cat# PAM6101 |
| Deposited Data | ||
| mRNA-Seq miRNA mimic transfection in 293T/NoDice | Table S1 | GEO: GSE128576 |
| small RNA-Seq LEC | https://labs.feinberg.northwestern.edu/gottwein/research/data.html | SRA: SRR10231467 |
| Experimental Models: Cell Lines | ||
| Primary lymphatic endothelial cells (LEC) | PromoCell or Lonza | Adult donors: 419Z035.4 (PromoCell) or 5F1290 (Lonza) |
| 293T | ATCC | CRL-3216; RRID:CVCL_0063 |
| HEK293T/NoDice | Dr. Bryan Cullen, Duke University | N/A |
| 293T/DKO (miR-15/16 deleted) | This paper | N/A |
| BC-3 | ATCC | CRL-2277; RRID:CVCL_1080 |
| JSC-1 | Dr. Richard Ambinder, Johns Hopkins | N/A |
| BJAB | Dr. Bryan Cullen, Duke University | N/A |
| BC-1 | ATCC | CRL-2230; RRID:CVCL_1079 |
| BCBL-1 | NIH AIDS | Cat# 3233 |
| Reagent | ||
| Program | ||
| Oligonucleotides | ||
| Primers for cloning luciferase reporters, lentiviral sponges, and CRISPR guides (see Table S4) | Integrated DNA Technologies | N/A |
| Recombinant DNA | ||
| pLCE vector | Zhang et al., 2009 | N/A |
| pLSG vector | Gottwein et al., 2007 | N/A |
| pLSR vector | Gottwein et al., 2007 | N/A |
| pLCG vector | Linnstaedt et al., 2010 | N/A |
| pLCR vector | Linnstaedt et al., 2010 | N/A |
| pX335 vector | Addgene | Plasmid # 42335; RRID:Addgene_42335 |
| Software and Algorithms | ||
| FlowJo | N/A | N/A |
| TargetScan 7.1 | Agarwal et al., 2015 | N/A |
| DAVID 6.8 | Huang et al., 2009 | N/A |
| Custom code for miRNA seed-match calling | This paper, see Codeocean capsule. | N/A |
Highlights.
The KSHV miRNA miR-K6-5p is a mimic of the tumor-suppressive miR-15/16 family
miR-K6-5p phenocopies miR-16-induced cell-cycle arrest and gene expression changes
Inhibition of miR-K6-5p in KSHV-transformed B cells confers a competitive advantage
ACKNOWLEDGMENTS
We thank Drs. Lauren Gay and Rolf Renne (University of Florida) for qCLASH data files, Hal Bogerd and Dr. Bryan Cullen (Duke University Medical Center) for 293T/NoDice, the University of Chicago Genomics Facility for Illumina sequencing, the Immunobiology Center Flow Cytometry Core and the Robert H. Lurie Comprehensive Cancer Center Flow Cytometry Core Facility for FACS, and Neil Kuehnle for comments on the manuscript. This study was supported by the National Cancer Institute grant R01 CA180813, by ACS Research Scholar Grant RMC-129546, and by Searle and Zell Scholar Awards from the Robert H. Lurie Comprehensive Cancer Center to E.G. K.M. was funded by the Cellular and Molecular Basis of Disease Training Program (T32 GM008061). The content is solely the responsibility of the authors and does not necessarily represent the official views of the funding agencies.
Footnotes
SUPPLEMENTAL INFORMATION
Supplemental Information can be found online at https://doi.org/10.1016/j.celrep.2019.11.005.
DECLARATION OF INTERESTS
The authors declare no competing interests.
REFERENCES
- Agarwal V, Bell GW, Nam JW, and Bartel DP (2015). Predicting effective microRNA target sites in mammalian mRNAs. eLife 4, Published online August 12, 2015 10.7554/eLife.05005. [DOI] [PMC free article] [PubMed] [Google Scholar]
- Anders S, Pyl PT, and Huber W (2015). HTSeq–a Python framework to work with high-throughput sequencing data. Bioinformatics 31, 166–169. [DOI] [PMC free article] [PubMed] [Google Scholar]
- Bartel DP (2009). MicroRNAs: target recognition and regulatory functions. Cell 136, 215–233. [DOI] [PMC free article] [PubMed] [Google Scholar]
- Bartel DP (2018). Metazoan MicroRNAs. Cell 173, 20–51. [DOI] [PMC free article] [PubMed] [Google Scholar]
- Bogerd HP, Whisnant AW, Kennedy EM, Flores O, and Cullen BR (2014). Derivation and characterization of Dicer- and microRNA-deficient human cells. RNA 20, 923–937. [DOI] [PMC free article] [PubMed] [Google Scholar]
- Boshoff C, Schulz TF, Kennedy MM, Graham AK, Fisher C, Thomas A, McGee JO, Weiss RA, and O’Leary JJ (1995). Kaposi’s sarcoma-associated herpesvirus infects endothelial and spindle cells. Nat. Med 1, 1274–1278. [DOI] [PubMed] [Google Scholar]
- Boss IW, Nadeau PE, Abbott JR, Yang Y, Mergia A, and Renne R (2011). A Kaposi’s sarcoma-associated herpesvirus-encoded ortholog of microRNA miR-155 induces human splenic B-cell expansion in NOD/LtSz-scid IL2Rγnull mice. J. Virol 85, 9877–9886. [DOI] [PMC free article] [PubMed] [Google Scholar]
- Calin GA, Dumitru CD, Shimizu M, Bichi R, Zupo S, Noch E, Aldler H, Rattan S, Keating M, Rai K, et al. (2002). Frequent deletions and downregulation of micro-RNA genes miR15 and miR16 at 13q14 in chronic lymphocytic leukemia. Proc. Natl. Acad. Sci. USA 99, 15524–15529. [DOI] [PMC free article] [PubMed] [Google Scholar]
- Calin GA, Cimmino A, Fabbri M, Ferracin M, Wojcik SE, Shimizu M, Taccioli C, Zanesi N, Garzon R, Aqeilan RI, et al. (2008). MiR-15a and miR-16-1 cluster functions in human leukemia. Proc. Natl. Acad. Sci. USA 105, 5166–5171. [DOI] [PMC free article] [PubMed] [Google Scholar]
- Cesarman E, Chang Y, Moore PS, Said JW, and Knowles DM (1995). Kaposi’s sarcoma-associated herpesvirus-like DNA sequences in AIDS-related body-cavity-based lymphomas. N. Engl. J. Med 332, 1186–1191. [DOI] [PubMed] [Google Scholar]
- Chang Y, Cesarman E, Pessin MS, Lee F, Culpepper J, Knowles DM, and Moore PS (1994). Identification of herpesvirus-like DNA sequences in AIDS-associated Kaposi’s sarcoma. Science 266, 1865–1869. [DOI] [PubMed] [Google Scholar]
- Chang TC, Wentzel EA, Kent OA, Ramachandran K, Mullendore M, Lee KH, Feldmann G, Yamakuchi M, Ferlito M, Lowenstein CJ, et al. (2007). Transactivation of miR-34a by p53 broadly influences gene expression and promotes apoptosis. Mol. Cell 26, 745–752. [DOI] [PMC free article] [PubMed] [Google Scholar]
- Chen RW, Bemis LT, Amato CM, Myint H, Tran H, Birks DK, Eckhardt SG, and Robinson WA (2008). Truncation in CCND1 mRNA alters miR-16-1 regulation in mantle cell lymphoma. Blood 112, 822–829. [DOI] [PMC free article] [PubMed] [Google Scholar]
- Chung EY, Dews M, Cozma D, Yu D, Wentzel EA, Chang TC, Schelter JM, Cleary MA, Mendell JT, and Thomas-Tikhonenko A (2008). c-Myb oncoprotein is an essential target of the dleu2 tumor suppressor micro-RNA cluster. Cancer Biol. Ther 7, 1758–1764. [DOI] [PMC free article] [PubMed] [Google Scholar]
- Cimmino A, Calin GA, Fabbri M, Iorio MV, Ferracin M, Shimizu M, Wojcik SE, Aqeilan RI, Zupo S, Dono M, et al. (2005). miR-15 and miR-16 induce apoptosis by targeting BCL2. Proc. Natl. Acad. Sci. USA 102, 13944–13949. [DOI] [PMC free article] [PubMed] [Google Scholar]
- Dahlke C, Maul K, Christalla T, Walz N, Schult P, Stocking C, and Grundhoff A (2012). A microRNA encoded by Kaposi sarcoma-associated herpesvirus promotes B-cell expansion in vivo. PLoS ONE 7, e49435. [DOI] [PMC free article] [PubMed] [Google Scholar]
- Damania B, and Cesarman E (2013). Kaposi’s Sarcoma-Associated Herpesvirus In Fields Virology (Lippincott Williams & Wilkins; ), pp. 2080–2128. [Google Scholar]
- Dobin A, Davis CA, Schlesinger F, Drenkow J, Zaleski C, Jha S, Batut P, Chaisson M, and Gingeras TR (2013). STAR: ultrafast universal RNA-seq aligner. Bioinformatics 29, 15–21. [DOI] [PMC free article] [PubMed] [Google Scholar]
- Ebert MS, Neilson JR, and Sharp PA (2007). MicroRNA sponges: competitive inhibitors of small RNAs in mammalian cells. Nat. Methods 4, 721–726. [DOI] [PMC free article] [PubMed] [Google Scholar]
- Friedman RC, Farh KK, Burge CB, and Bartel DP (2009). Most mammalian mRNAs are conserved targets of microRNAs. Genome Res. 19, 92–105. [DOI] [PMC free article] [PubMed] [Google Scholar]
- Fu X, He Y, Wang X, Peng D, Chen X, Li X, and Wan Q (2018). MicroRNA-16 Promotes Ovarian Granulosa Cell Proliferation and Suppresses Apoptosis Through Targeting PDCD4 in Polycystic Ovarian Syndrome. Cell. Physiol. Biochem 48, 670–682. [DOI] [PubMed] [Google Scholar]
- Fulci V, Chiaretti S, Goldoni M, Azzalin G, Carucci N, Tavolaro S, Castellano L, Magrelli A, Citarella F, Messina M, et al. (2007). Quantitative technologies establish a novel microRNA profile of chronic lymphocytic leukemia. Blood 109, 4944–4951. [DOI] [PubMed] [Google Scholar]
- Gallaher AM, Das S, Xiao Z, Andresson T, Kieffer-Kwon P, Happel C, and Ziegelbauer J (2013). Proteomic screening of human targets of viral microRNAs reveals functions associated with immune evasion and angiogenesis. PLoS Pathog. 9, e1003584. [DOI] [PMC free article] [PubMed] [Google Scholar]
- Gay LA, Sethuraman S, Thomas M, Turner PC, and Renne R (2018). Modified Cross-Linking, Ligation, and Sequencing of Hybrids (qCLASH) Identifies Kaposi’s Sarcoma-Associated Herpesvirus MicroRNA Targets in Endothelial Cells. J. Virol 92, e02138–17. [DOI] [PMC free article] [PubMed] [Google Scholar]
- Gibson DG (2011). Enzymatic assembly of overlapping DNA fragments. Methods Enzymol. 498, 349–361. [DOI] [PMC free article] [PubMed] [Google Scholar]
- Godfrey A, Anderson J, Papanastasiou A, Takeuchi Y, and Boshoff C (2005). Inhibiting primary effusion lymphoma by lentiviral vectors encoding short hairpin RNA. Blood 105, 2510–2518. [DOI] [PubMed] [Google Scholar]
- Gottwein E, and Cullen BR (2010). A human herpesvirus microRNA inhibits p21 expression and attenuates p21-mediated cell cycle arrest. J. Virol 84, 5229–5237. [DOI] [PMC free article] [PubMed] [Google Scholar]
- Gottwein E, Mukherjee N, Sachse C, Frenzel C, Majoros WH, Chi JT, Braich R, Manoharan M, Soutschek J, Ohler U, and Cullen BR (2007). A viral microRNA functions as an orthologue of cellular miR-155. Nature 450, 1096–1099. [DOI] [PMC free article] [PubMed] [Google Scholar]
- Gottwein E, Corcoran DL, Mukherjee N, Skalsky RL, Hafner M, Nusbaum JD, Shamulailatpam P, Love CL, Dave SS, Tuschl T, et al. (2011). Viral microRNA targetome of KSHV-infected primary effusion lymphoma cell lines. Cell Host Microbe 10, 515–526. [DOI] [PMC free article] [PubMed] [Google Scholar]
- Grosswendt S, Filipchyk A, Manzano M, Klironomos F, Schilling M, Herzog M, Gottwein E, and Rajewsky N (2014). Unambiguous identification of miRNA:target site interactions by different types of ligation reactions. Mol. Cell 54, 1042–1054. [DOI] [PMC free article] [PubMed] [Google Scholar]
- Guasparri I, Keller SA, and Cesarman E (2004). KSHV vFLIP is essential for the survival of infected lymphoma cells. J. Exp. Med 199, 993–1003. [DOI] [PMC free article] [PubMed] [Google Scholar] [Retracted]
- Haecker I, Gay LA, Yang Y, Hu J, Morse AM, McIntyre LM, and Renne R (2012). Ago HITS-CLIP expands understanding of Kaposi’s sarcoma-associated herpesvirus miRNA function in primary effusion lymphomas. PLoS Pathog. 8, e1002884. [DOI] [PMC free article] [PubMed] [Google Scholar]
- Hart T, Chandrashekhar M, Aregger M, Steinhart Z, Brown KR, MacLeod G, Mis M, Zimmermann M, Fradet-Turcotte A, Sun S, et al. (2015). High-Resolution CRISPR Screens Reveal Fitness Genes and Genotype-Specific Cancer Liabilities. Cell 163, 1515–1526. [DOI] [PubMed] [Google Scholar]
- Helwak A, Kudla G, Dudnakova T, and Tollervey D (2013). Mapping the human miRNA interactome by CLASH reveals frequent noncanonical binding. Cell 153, 654–665. [DOI] [PMC free article] [PubMed] [Google Scholar]
- Huang W, Sherman BT, and Lempicki RA (2009). Systematic and integrative analysis of large gene lists using DAVID bioinformatics resources. Nat. Protoc 4, 44–57. [DOI] [PubMed] [Google Scholar]
- Järviluoma A, Koopal S, Räsänen S, Mäkelä TP, and Ojala PM (2004). KSHV viral cyclin binds to p27KIP1 in primary effusion lymphomas. Blood 104, 3349–3354. [DOI] [PubMed] [Google Scholar]
- Klein U, Lia M, Crespo M, Siegel R, Shen Q, Mo T, Ambesi-Impiombato A, Califano A, Migliazza A, Bhagat G, and Dalla-Favera R (2010). The DLEU2/miR-15a/16-1 cluster controls B cell proliferation and its deletion leads to chronic lymphocytic leukemia. Cancer Cell 17, 28–40. [DOI] [PubMed] [Google Scholar]
- Leidal AM, Cyr DP, Hill RJ, Lee PW, and McCormick C (2012). Subversion of autophagy by Kaposi’s sarcoma-associated herpesvirus impairs oncogene-induced senescence. Cell Host Microbe 11, 167–180. [DOI] [PubMed] [Google Scholar]
- Lian YF, Huang YL, Wang JL, Deng MH, Xia TL, Zeng MS, Chen MS, Wang HB, and Huang YH (2018). Anillin is required for tumor growth and regulated by miR-15a/miR-16-1 in HBV-related hepatocellular carcinoma. Aging (Albany N.Y.) 10, 1884–1901. [DOI] [PMC free article] [PubMed] [Google Scholar]
- Linnstaedt SD, Gottwein E, Skalsky RL, Luftig MA, and Cullen BR (2010). Virally induced cellular microRNA miR-155 plays a key role in B-cell immortalization by Epstein-Barr virus. J. Virol 84, 11670–11678. [DOI] [PMC free article] [PubMed] [Google Scholar]
- Linsley PS, Schelter J, Burchard J, Kibukawa M, Martin MM, Bartz SR, Johnson JM, Cummins JM, Raymond CK, Dai H, et al. (2007). Transcripts targeted by the microRNA-16 family cooperatively regulate cell cycle progression. Mol. Cell. Biol 27, 2240–2252. [DOI] [PMC free article] [PubMed] [Google Scholar]
- Liu Q, Fu H, Sun F, Zhang H, Tie Y, Zhu J, Xing R, Sun Z, and Zheng X (2008). miR-16 family induces cell cycle arrest by regulating multiple cell cycle genes. Nucleic Acids Res. 36, 5391–5404. [DOI] [PMC free article] [PubMed] [Google Scholar]
- Liu X, Happel C, and Ziegelbauer JM (2017). Kaposi’s Sarcoma-Associated Herpesvirus MicroRNAs Target GADD45B To Protect Infected Cells from Cell Cycle Arrest and Apoptosis. J. Virol 91, e02045–16. [DOI] [PMC free article] [PubMed] [Google Scholar]
- Lovat F, Fassan M, Gasparini P, Rizzotto L, Cascione L, Pizzi M, Vicentini C, Balatti V, Palmieri D, Costinean S, and Croce CM (2015). miR-15b/16-2 deletion promotes B-cell malignancies. Proc. Natl. Acad. Sci. USA 112, 11636–11641. [DOI] [PMC free article] [PubMed] [Google Scholar]
- Lovat F, Fassan M, Sacchi D, Ranganathan P, Palamarchuk A, Bill M, Karunasiri M, Gasparini P, Nigita G, Distefano R, et al. (2018). Knockout of both miR-15/16 loci induces acute myeloid leukemia. Proc. Natl. Acad. Sci. USA 115, 13069–13074. [DOI] [PMC free article] [PubMed] [Google Scholar]
- Love MI, Huber W, and Anders S (2014). Moderated estimation of fold change and dispersion for RNA-seq data with DESeq2. Genome Biol. 15, 550. [DOI] [PMC free article] [PubMed] [Google Scholar]
- Manzano M, Shamulailatpam P, Raja AN, and Gottwein E (2013). Kaposi’s sarcoma-associated herpesvirus encodes a mimic of cellular miR-23. J. Virol 87, 11821–11830. [DOI] [PMC free article] [PubMed] [Google Scholar]
- Manzano M, Forte E, Raja AN, Schipma MJ, and Gottwein E (2015). Divergent target recognition by coexpressed 5′-isomiRs of miR-142-3p and selective viral mimicry. RNA 21, 1606–1620. [DOI] [PMC free article] [PubMed] [Google Scholar]
- Manzano M, Patil A, Waldrop A, Dave SS, Behdad A, and Gottwein E (2018). Gene essentiality landscape and druggable oncogenic dependencies in herpesviral primary effusion lymphoma. Nat. Commun 9, 3263. [DOI] [PMC free article] [PubMed] [Google Scholar]
- Moore PS, and Chang Y (2017). Common Commensal Cancer Viruses. PLoS Pathog. 13, e1006078. [DOI] [PMC free article] [PubMed] [Google Scholar]
- Nador RG, Cesarman E, Chadburn A, Dawson DB, Ansari MQ, Sald J, and Knowles DM (1996). Primary effusion lymphoma: a distinct clinicopathologic entity associated with the Kaposi’s sarcoma-associated herpes virus. Blood 88, 645–656. [PubMed] [Google Scholar]
- Pothof J, Verkaik NS, van IJcken W, Wiemer EA, Ta VT, van der Horst GT, Jaspers NG, van Gent DC, Hoeijmakers JH, and Persengiev SP (2009). MicroRNA-mediated gene silencing modulates the UV-induced DNA-damage response. EMBO J. 28, 2090–2099. [DOI] [PMC free article] [PubMed] [Google Scholar]
- Ramalingam D, and Ziegelbauer JM (2017). Viral microRNAs Target a Gene Network, Inhibit STAT Activation, and Suppress Interferon Responses. Sci. Rep 7, 40813. [DOI] [PMC free article] [PubMed] [Google Scholar]
- Rissland OS, Hong SJ, and Bartel DP (2011). MicroRNA destabilization enables dynamic regulation of the miR-16 family in response to cell-cycle changes. Mol. Cell 43, 993–1004. [DOI] [PMC free article] [PubMed] [Google Scholar]
- Rose TM, Bruce AG, Barcy S, Fitzgibbon M, Matsumoto LR, Ikoma M, Casper C, Orem J, and Phipps W (2018). Quantitative RNAseq analysis of Ugandan KS tumors reveals KSHV gene expression dominated by transcription from the LTd downstream latency promoter. PLoS Pathog. 14, e1007441. [DOI] [PMC free article] [PubMed] [Google Scholar]
- Seitz H, Tushir JS, and Zamore PD (2011). A 5′-uridine amplifies miRNA/miRNA* asymmetry in Drosophila by promoting RNA-induced silencing complex formation. Silence 2, 4. [DOI] [PMC free article] [PubMed] [Google Scholar]
- Sin SH, Kim YB, and Dittmer DP (2013). Latency locus complements MicroRNA 155 deficiency in vivo. J. Virol 87, 11908–11911. [DOI] [PMC free article] [PubMed] [Google Scholar]
- Skalsky RL, Samols MA, Plaisance KB, Boss IW, Riva A, Lopez MC, Baker HV, and Renne R (2007). Kaposi’s sarcoma-associated herpesvirus encodes an ortholog of miR-155. J. Virol 81, 12836–12845. [DOI] [PMC free article] [PubMed] [Google Scholar]
- Soulier J, Grollet L, Oksenhendler E, Cacoub P, Cazals-Hatem D, Babinet P, d’Agay MF, Clauvel JP, Raphael M, Degos L, et al. (1995). Kaposi’s sarcoma-associated herpesvirus-like DNA sequences in multicentric Castleman’s disease. Blood 86, 1276–1280. [PubMed] [Google Scholar]
- Subramanian A, Tamayo P, Mootha VK, Mukherjee S, Ebert BL, Gillette MA, Paulovich A, Pomeroy SL, Golub TR, Lander ES, and Mesirov JP (2005). Gene set enrichment analysis: a knowledge-based approach for interpreting genome-wide expression profiles. Proc. Natl. Acad. Sci. USA 102, 15545–15550. [DOI] [PMC free article] [PubMed] [Google Scholar]
- Wang M, Tan LP, Dijkstra MK, van Lom K, Robertus JL, Harms G, Blokzijl T, Kooistra K, van T’veer MB, Rosati S, et al. (2008). miRNA analysis in B-cell chronic lymphocytic leukaemia: proliferation centres characterized by low miR-150 and high BIC/miR-155 expression. J. Pathol 215, 13–20. [DOI] [PubMed] [Google Scholar]
- Wang T, Wei JJ, Sabatini DM, and Lander ES (2014). Genetic screens in human cells using the CRISPR-Cas9 system. Science 343, 80–84. [DOI] [PMC free article] [PubMed] [Google Scholar]
- Wang T, Yu H, Hughes NW, Liu B, Kendirli A, Klein K, Chen WW, Lander ES, and Sabatini DM (2017). Gene Essentiality Profiling Reveals Gene Networks and Synthetic Lethal Interactions with Oncogenic Ras. Cell 168, 890–903. [DOI] [PMC free article] [PubMed] [Google Scholar]
- White RE, Rämer PC, Naresh KN, Meixlsperger S, Pinaud L, Rooney C, Savoldo B, Coutinho R, Bödör C, Gribben J, et al. (2012). EBNA3B-deficient EBV promotes B cell lymphomagenesis in humanized mice and is found in human tumors. J. Clin. Invest 122, 1487–1502. [DOI] [PMC free article] [PubMed] [Google Scholar]
- Wies E, Mori Y, Hahn A, Kremmer E, Stürzl M, Fleckenstein B, and Neipel F (2008). The viral interferon-regulatory factor-3 is required for the survival of KSHV-infected primary effusion lymphoma cells. Blood 111, 320–327. [DOI] [PubMed] [Google Scholar]
- Zhang J, Jima DD, Jacobs C, Fischer R, Gottwein E, Huang G, Lugar PL, Lagoo AS, Rizzieri DA, Friedman DR, et al. (2009). Patterns of micro-RNA expression characterize stages of human B-cell differentiation. Blood 113, 4586–4594. [DOI] [PMC free article] [PubMed] [Google Scholar]
- Ziegelbauer JM, Sullivan CS, and Ganem D (2009). Tandem array-based expression screens identify host mRNA targets of virus-encoded microRNAs. Nat. Genet 41, 130–134. [DOI] [PMC free article] [PubMed] [Google Scholar]
Associated Data
This section collects any data citations, data availability statements, or supplementary materials included in this article.
Supplementary Materials
Data Availability Statement
Custom Code is available on Code Ocean (https://codeocean.com/capsule/5364796/tree/v1). The analyzed mRNA-Seq dataset can be found in Table S1 and raw data are available in GEO (GSE128576). For the small RNA-Seq dataset in LEC, raw data are available in SRA under accession number SRR10231467. The analyzed dataset is available at: https://labs.feinberg.northwestern.edu/gottwein/research/data.html.