Abstract
Activated CD4 T cells proliferate rapidly and remodel epigenetically before exiting the cell cycle and engaging acquired effector functions. Metabolic reprograming from the naïve-state is required throughout these phases of activation1. In CD4 T cells, T cell receptor (TCR) ligation, along with co-stimulatory and cytokine signals induce a glycolytic anabolic program required for biomass generation, rapid proliferation, and effector function2. CD4 T cell differentiation (proliferation and epigenetic remodeling) and function are coordinately orchestrated by signal transduction and transcriptional remodeling. However, it remains unclear whether these processes are independently regulated by cellular biochemical composition. Here we demonstrate that distinct modes of mitochondrial metabolism support T helper 1 (Th1) cell differentiation and effector function, biochemically uncoupling these processes. We find that the TCA cycle is required for terminal Th1 cell effector function through succinate dehydrogenase (SDH; Complex II), yet the activity of SDH suppresses Th1 cell proliferation and histone acetylation. In contrast, we show that Complex I of the electron transport chain (ETC), the malate-aspartate shuttle, and citrate export from the mitochondria are required to maintain aspartate synthesis necessary for Th cell proliferation. Furthermore, we find that mitochondrial citrate export and malate-aspartate shuttle promote histone acetylation and specifically regulate the expression of genes involved in T cell activation. Combining genetic, pharmacological, and metabolomics approaches, we demonstrate that T helper cell differentiation and terminal effector function can be biochemically uncoupled. These findings support a model in which the malate-aspartate shuttle, citrate export, and Complex I supply the substrates needed for proliferation and epigenetic remodeling during early T cell activation, while Complex II consumes the substrates of these pathways, antagonizing differentiation and enforcing terminal effector function. Our data suggest that transcriptional programming works in concert with a parallel biochemical network to enforce cell state.
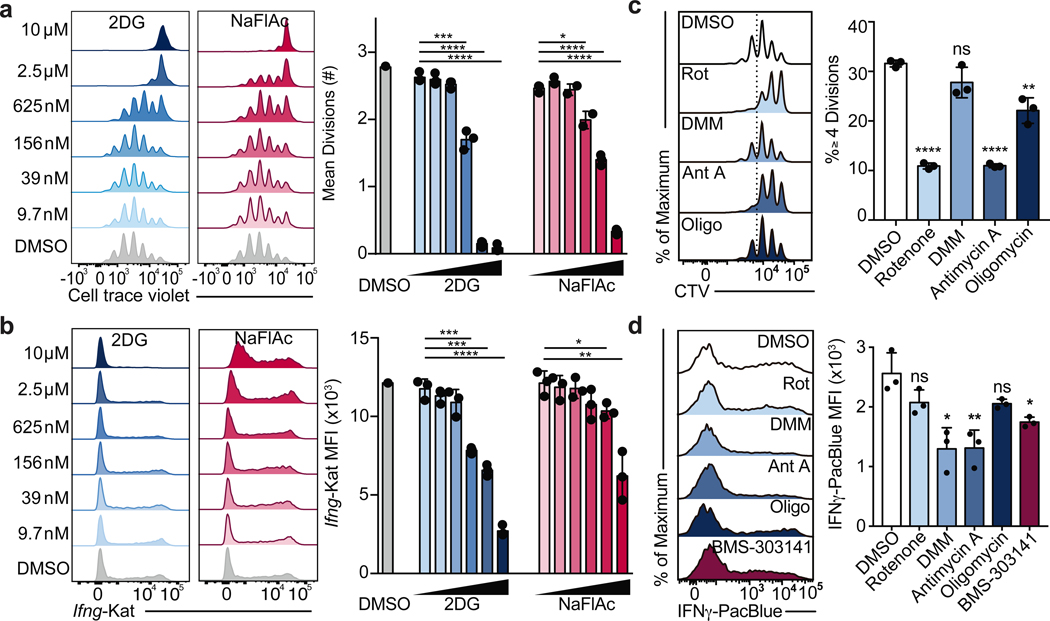
T cells require mitochondrial metabolism as they exit from the naïve cell state to become activated and as they return to resting memory cells, however the role of mitochondrial metabolism during effector T cell differentiation and function is less well understood3–5. Metabolite tracing studies have revealed that while activated T cells use glutamine for anaplerosis of α-ketoglutarate, activated cells decrease the rate of pyruvate entry into the mitochondria in favor of lactate fermentation5,6. Despite the decreased utilization of glucose-derived carbon for mitochondrial metabolism, the tricarboxylic acid (TCA) cycle has previously been shown to contribute to IFNγ production by elevating cytosolic acetyl-CoA pools via mitochondrial citrate export7. Additionally, the TCA cycle can also contribute to the electron transport chain (ETC) by generating NADH and succinate to fuel Complex I and II, respectively, yet the role of the ETC in later stages of T cell activation is poorly characterized. To test the contribution of the TCA cycle to effector T cell function, we treated Th1 cultured cells with the TCA cycle inhibitor sodium fluoroacetate (NaFlAc)8. We titrated NaFlAc or the glycolysis inhibitor 2-deoxy-D-glucose (2DG), an inhibitor of Th1 cell activation as a positive control, at day 1 of T cell culture and assayed cell proliferation at day 3 or Ifng-Katushka reporter expression at day 5. While 2DG was more potent at lower doses, both inhibitors impaired Ifng transcription (Fig. 1a) and T cell proliferation (Fig. 1b) in a dose-dependent manner, suggesting that the activity of TCA cycle enzymes is required for optimal Th1 cell activation.
Figure 1: The TCA cycle supports Th cell proliferation and function through distinct mechanisms.
a, Mean divisions at day 3 and b, Ifng-Katushka reporter expression after restimulation with PMA and ionomycin at day 5 of CD4 T cells cultured in Th1 conditions with serially diluted 2DG (n = 3) or NaFlAc (n = 2–3). c, Proliferation after overnight treatment on day 2, and d, intracellular IFNγ protein expression after overnight treatment on day 4 of Th1 cultured WT CD4 T cells with DMSO, rotenone, dimethyl malonate (DMM), antimycin A, oligomycin, or BMS-303141 (n = 3). n = number of technical replicates. Representative plots and a graph summarizing the results of at least two independent experiments are shown. Mean and s.d. of replicates are presented on summarized plots and unpaired, two-tailed t-test used to determine significance (*p<0.05, **p<0.01; ***p<0.001, **** p<0.0001).
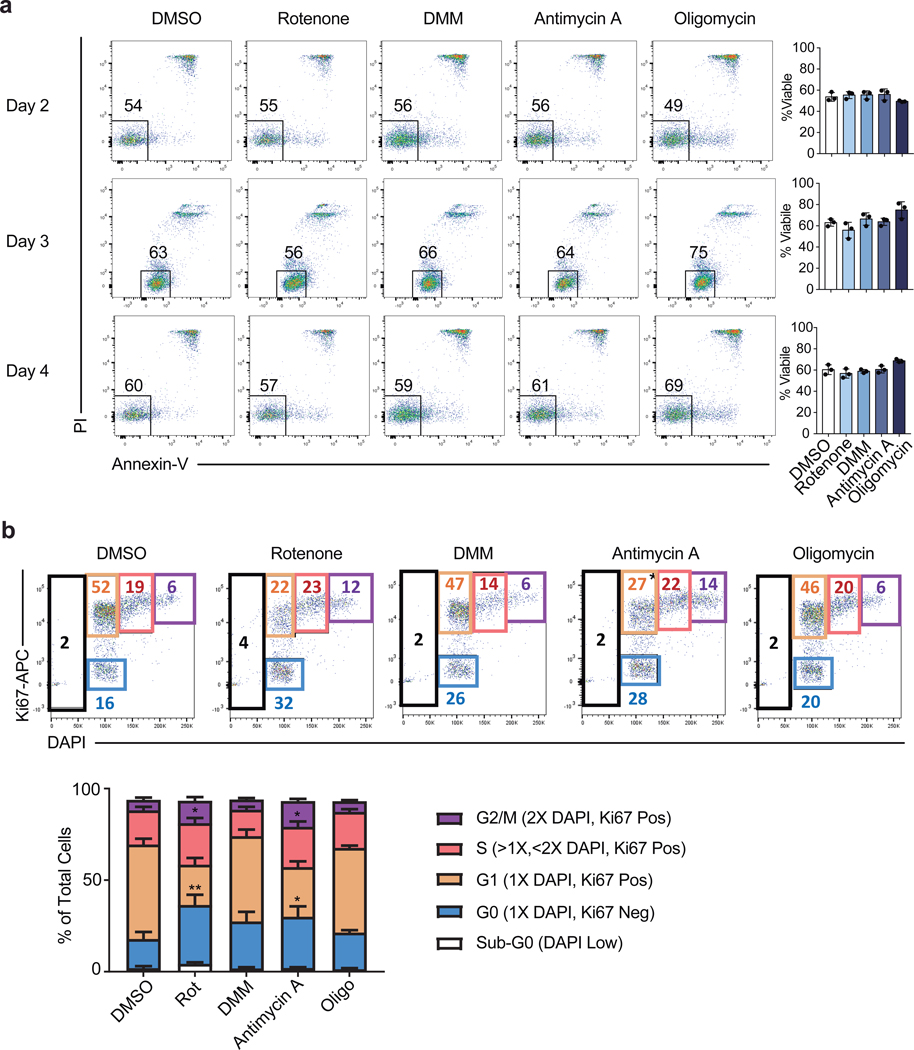
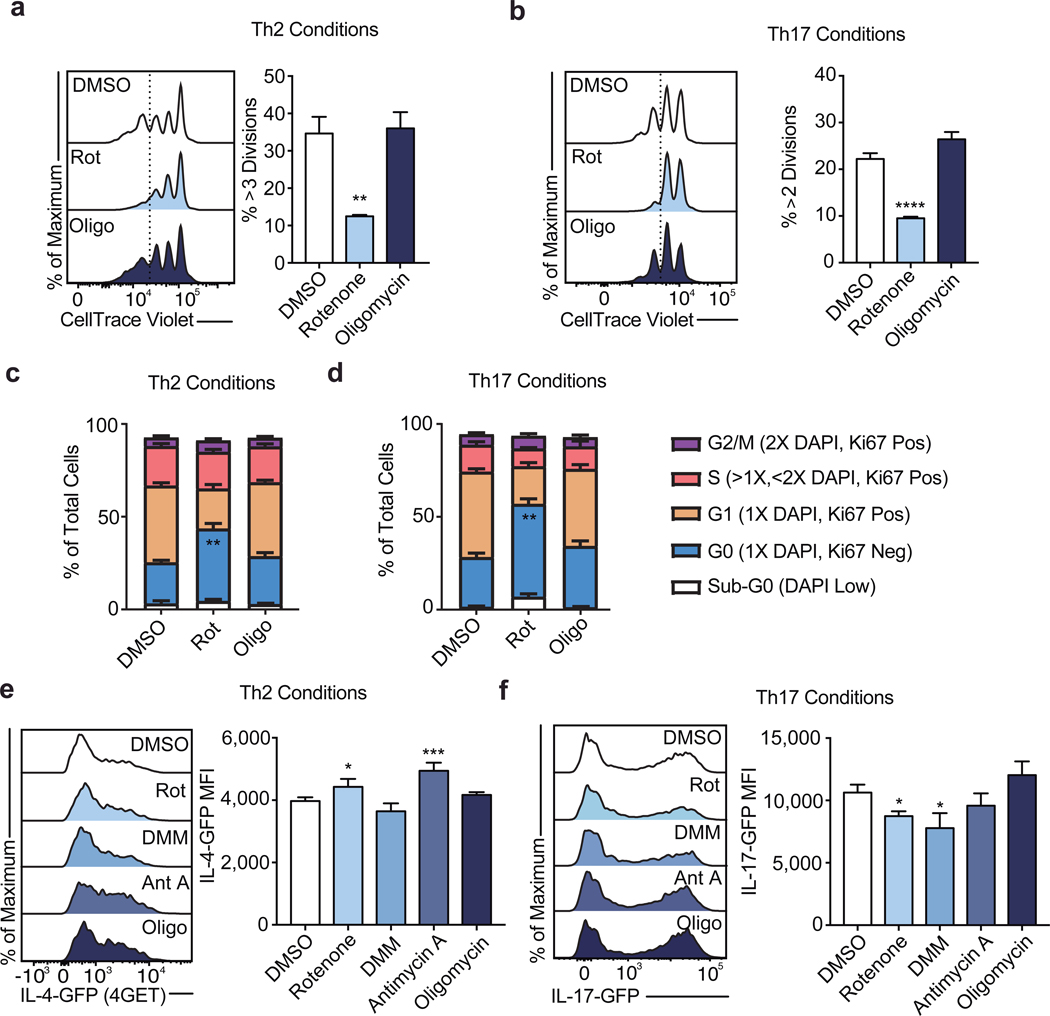
To evaluate which processes downstream of the TCA cycle contributed to its role in Th cell proliferation and function, we treated Th1 cells with inhibitors of the ETC overnight on day 2 to evaluate proliferation or overnight on day 4 to evaluate cytokine production, and analyzed cells the following day. Unlike impairing glycolysis with 2DG or the TCA cycle with NaFlAc, which resulted in a block of both proliferation and function, we observed a dichotomy in the role of the ETC in supporting each of these processes. Although inhibition of Complex II failed to impair proliferation, blocking Complex I and III resulted in a decrease in the number of divided cells, with oligomycin treatment displaying a modest but significant effect (Fig. 1c). Importantly, viability was not affected upon acute inhibition of ETC complexes (Extended Data Fig. 1a). Consistent with this observation, day 2 treatment with rotenone or antimycin A resulted in cell cycle arrest at G2/M, whereas treatment with DMM or oligomycin did not alter cell cycle status (Extended Data Fig. 1b). Similar to Th1 cultured cells, cells cultured in Th2 or Th17 conditions displayed defects in proliferation and an altered cell cycle when treated with rotenone (Extended Data Fig. 2a, b, e, & f), suggesting Complex I supports cell division regardless of the cytokine environment.
Further illustrating distinct roles for Complex I and Complex II in Th cell proliferation and function, we observed that the Acly inhibitor BMS-303141 significantly decreased IFNγ production, in line with previous work7, while the effect of inhibition of Complex I or ATP-synthase with rotenone or oligomycin, respectively, was not significant. In contrast, impairing Complex II activity with dimethyl malonate (DMM) or Complex III activity with antimycin A significantly reduced IFNγ production below that observed with the Acly inhibitor BMS-303141 (Fig. 1d). Together, these observations suggest that the TCA cycle supports Th1 function by both enabling cytosolic acetyl-CoA production and fueling an SDH-driven ETC. This role for the ETC was specific to the Th cytokine culture conditions to which cells were exposed during activation. Unlike Th1 cells, inhibiting the ETC had minimal impact on Th2 effector function, with Complex I and III inhibition resulting in a slight but significant increase in IL-4 reporter activity, whereas Th17 cells displayed sensitivity to both Complex I and II inhibition (Extended Data Fig. 2c, d). These data indicate that the ETC has Th cell program-specific roles in regulating effector function.
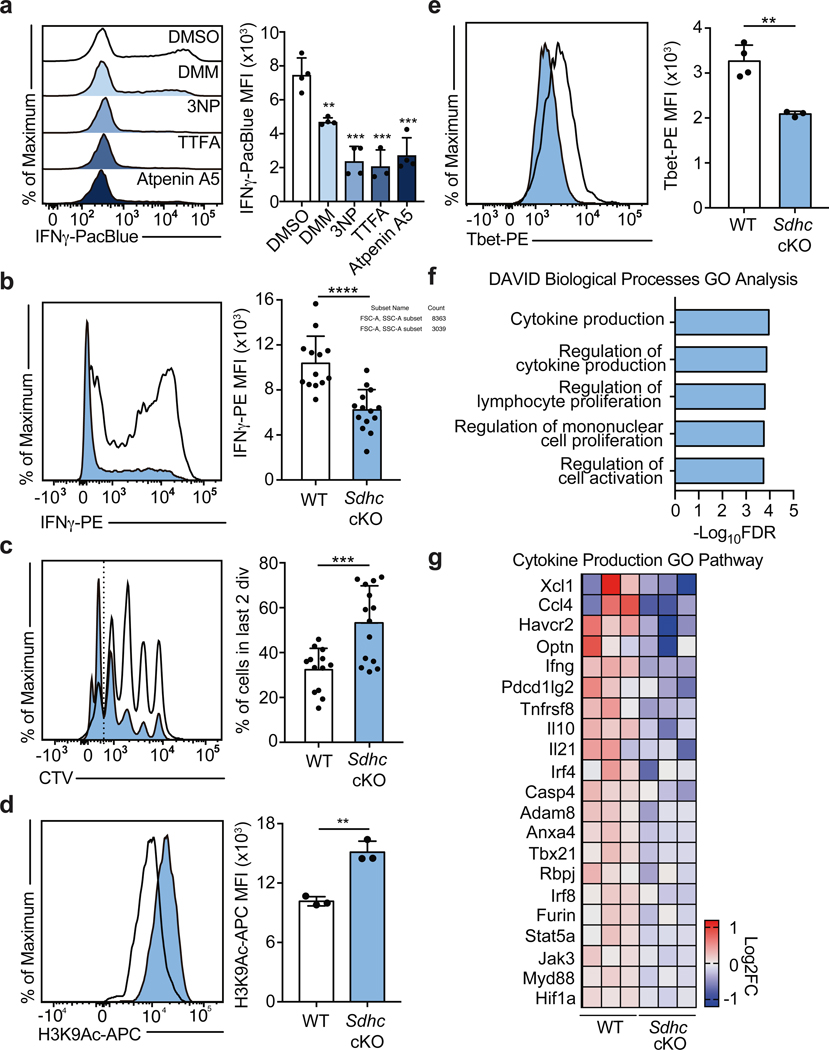
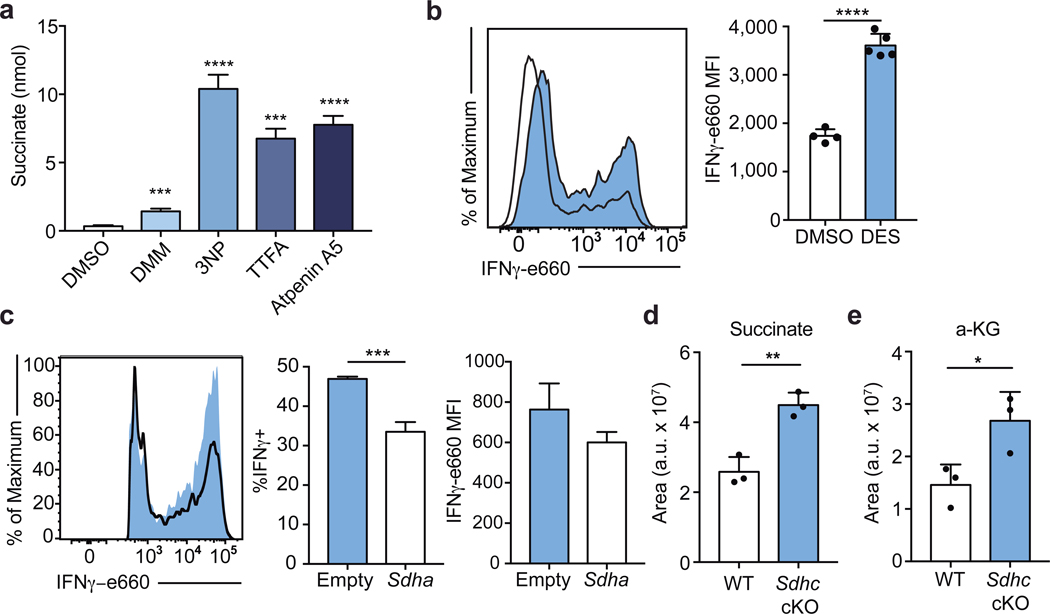
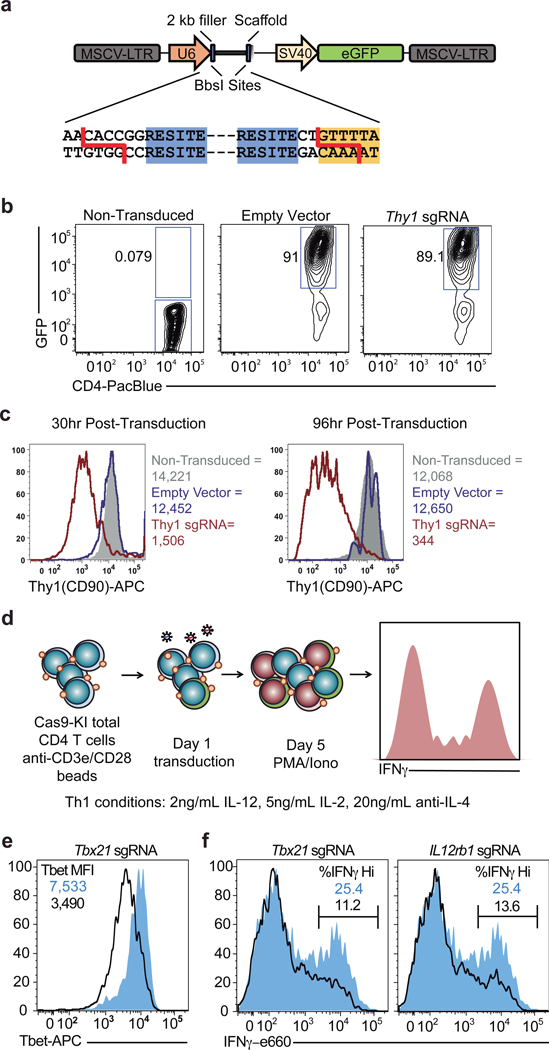
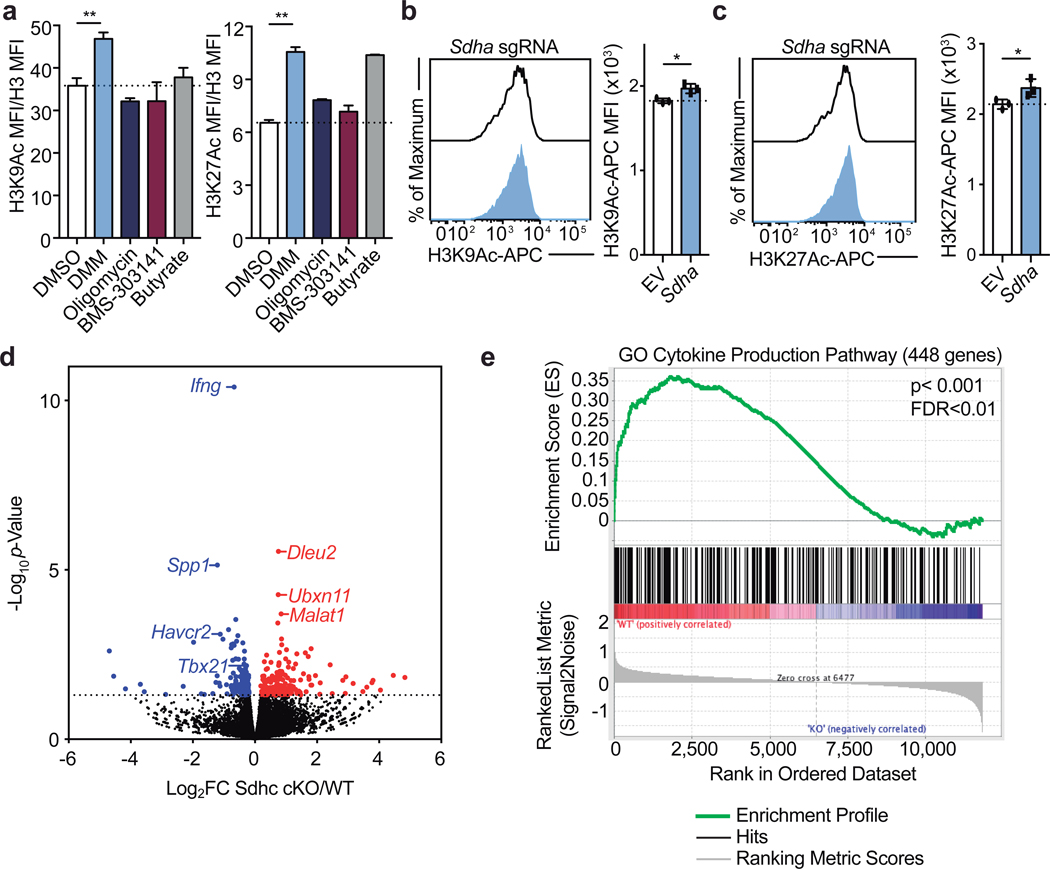
To corroborate the effects of DMM on Th1 cell function, we tested the capacity of three other Complex II inhibitors, 3-Nitropropionic acid (3NP), thenoyltrifluoroacetone (TTFA), and atpenin-A5 to inhibit IFNγ production in Th1 cells. Each drug impaired Complex II activity as assayed by cellular succinate accumulation (Extended Data Fig. 3a). Consistent with our results for DMM treatment, Th1 cells treated with 3NP, TTFA, or Atpenin-A5 produced significantly less IFNγ than control cells (Fig. 2a). In keeping with a role for the TCA cycle and Complex II in promoting Th1 function, cells cultured overnight with a membrane-permeable form of succinate, diethyl succinate (DES) produced more IFNγ (Extended Data Fig. 3b). To genetically test the requirement of Complex II activity in Th1 cells, we generated a retroviral sgRNA expression vector, MG-Guide, compatible with murine T cell transduction (Extended Data Fig. 4a, b). To validate the system, we transduced CD4 T cells with sgRNA and observed rapid loss of protein expression, with sgRNAs targeting either Tbx21 or Il12rb1, genes essential for Th1 cell cytokine production, leading to a decrease in IFNγ production capacity (Extended Data Fig. 4c, d, e, & f; Supplementary Table 1). Transduction of Th1 cells with a sgRNA targeting Sdha, the catalytic subunit of complex II, impaired IFNγ production capacity (Extended Data Fig. 3c). To provide further genetic evidence that Complex II activity is required for Th1 cell function, we tested the requirement for Sdhc, which encodes an essential subunit of Complex II. We cultured CD4 T cells isolated from Sdhcfl/fl TetO-Cre−/+ R26rtTA/+ (Sdhc cKO) or Sdhc+/+ TetO-Cre−/+ R26rtTA/+ control (WT) mice that had been treated in vivo with doxycycline for 10 days in Th1 conditions. Unbiased mass-spectrometry analysis of metabolites in WT and Sdhc cKO Th1 cells revealed that Sdhc cKO cells had increased cellular succinate and α-ketoglutarate, confirming loss of SDH activity (Extended Data Fig. 3d, e). Consistent with our drug and sgRNA studies, Sdhc cKO cells produced significantly less IFNγ at day 5 post activation (Fig. 2b). However, Sdhc cKO Th1 cells proliferated significantly more than WT controls, suggesting proliferation and effector function are processes uncoupled by Complex II activity (Fig. 2c). To test whether other processes involved in Th cell differentiation were affected in addition to proliferation, we assayed the effect of SDH deficiency on histone acetylation. We found that Sdhc cKO cells exhibited elevated H3K9 acetylation and that DMM treatment as well as delivery of Sdha targeting sgRNA enhanced H3K9 and K27 acetylation, suggesting that Complex II antagonizes Th cell differentiation by negatively regulating both proliferation and histone acetylation (Fig. 2d and Extended Data Fig. 5a, b, c).
Figure 2: Complex II uncouples Th1 cell differentiation and effector function.
a, Intracellular IFNγ protein expression in PMA and Ionomycin restimulated WT CD4 T cells cultured in Th1 conditions at day 5 after overnight treatment with DMSO, DMM (10mM), 3-nitropropionic acid (3NP; 1mM), thenoyltrifluoroaceton (TTFA; 100μM), or atpenin A5 (1μM) (n = 3). b, Intracellular IFNγ protein expression and c, proliferation of CD4 T cells from doxycycline-treated Sdhcfl/fl TetO-Cre−/+ R26rtTA/+ (Sdhc cKO) or Sdhc+/+ TetO-Cre−/+ R26rtTA/+ (WT) mice cultured in Th1 conditions at day 5, (data combined from 5 independent experiments, WT: n = 13, Sdhc cKO: n = 14 biological replicates), two-tailed t-test. d, Total cellular H3K9Ac of WT and Sdhc cKO cells cultured in Th1 conditions at day 3 (n = 3), two-sided t-test. e, Tbet protein expression of WT (n = 4) and Sdhc cKO (n = 3) cells cultured in Th1 conditions at day 5, two-sided t-test. f, DAVID GO pathway analysis of genes downregulated in cKO mice compared to WT controls, p<0.05. g, Heatmap of gene expression from RNA-seq results for the Cytokine Production GO Pathway. n = number of technical replicates except where noted otherwise. Representative plots and a graph summarizing the results of at least two independent experiments are shown, except where noted otherwise. Mean and s.d. of replicates are presented on summarized plots and unpaired, two-tailed t-test used to determine significance (**p<0.01; ***p<0.001, **** p<0.0001).
To test the role of Complex II in promoting other aspects of the Th1 cell functional program, we evaluated Tbet protein expression in day 5 Sdhc cKO and WT cells. Consistent with defects in IFNγ production, Th1 cells from Sdhc cKO mice had reduced Tbet protein expression (Fig. 2e). To further investigate a role for Complex II in supporting the Th1 functional program, we performed RNA-seq on day 5 effector Th1 cells from Sdhc cKO and WT mice. In line with a decrease in Tbet expression, Th1 cells from Complex II deficient animals exhibited significantly decreased expression of genes key to the Th1 cell program and genes important during Th cell activation. Notably, DAVID gene ontology (GO) pathway analysis indicated “cytokine production” and “regulation of lymphocyte proliferation” as the most dysregulated pathways (Fig. 2f, g; Extended Data Fig. 5d, e; Supplementary Table 2). These data indicate that SDH activity is a primary mechanism through which mitochondrial metabolism supports Th1 cell functional programming.
We next sought to investigate which aspects of mitochondrial metabolism SDH antagonizes to constrain proliferation. The consumption of α-ketoglutarate is known to modulate the activity of mitochondrial shuttling systems required to maintain the cellular redox balance and the production of key cytosolic metabolites9–11. The malate-aspartate shuttle and mitochondrial citrate export are two such systems that regulate the exchange of NADH/NAD+ and acetyl-CoA between the cytosol and mitochondria, respectively. Based on our data that Sdhc cKO Th1 cells exhibit increased proliferation (Fig. 2c) and increased cellular α-ketoglutarate levels (Extended Data Fig. 3e), we hypothesized that these mitochondrial transport systems promote early Th1 cell proliferation.
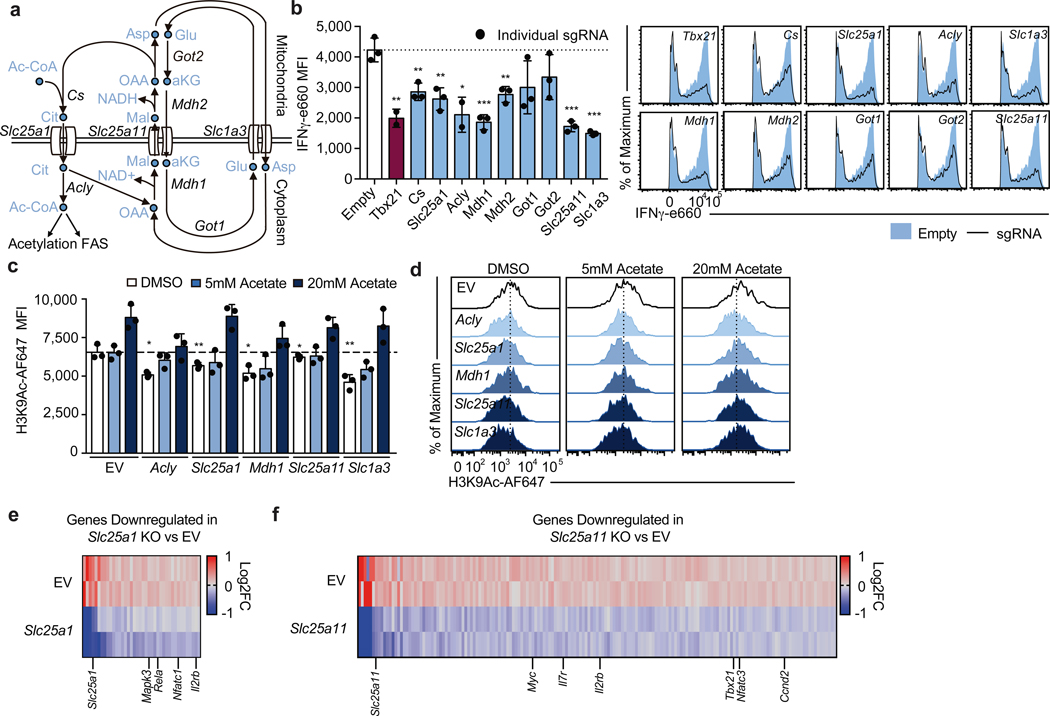
To test the requirement of these transport systems for Th1 cell activation, we designed three sgRNAs per gene of interest and conducted individual sgRNA knockout experiments using MG-Guide, measuring IFNγ protein (Fig. 3a). We found that cells expressing sgRNAs targeting Mdh1, Mdh2, Slc25a11 and Slc1a3 produced less IFNγ protein, comparable with sgRNAs targeting a positive control gene Tbx21, as did two of the three sgRNAs designed to target Got1 and Got2, suggesting the malate-aspartate shuttle is critical during Th1 cell activation (Fig. 3b). In addition, we observed defective IFNγ production in Th1 cells expressing sgRNA against Cs, Slc25a1 and Acly, indicating that citrate synthesis and export for cytosolic acetyl-CoA production are also required (Fig. 3b).
Figure 3: The malate-aspartate shuttle and mitochondrial citrate export are required for histone acetylation and proliferation in differentiating Th1 cells.
a, Schematic diagram of the malate-aspartate shuttle and mitochondrial citrate export. b, Intracellular IFNγ protein expression in Cas9tg CD4 T cells transduced with distinct sgRNAs targeting each of the enzymes and transporters indicated cultured in Th1 conditions after restimulation at day 5. Graphs show individual sgRNA for each gene as well as the average for all three sgRNAs (n = 2–3 biological replicates). c,d, Total cellular H3K9Ac at day 4 of Cas9tg CD4 T cells transduced with distinct sgRNAs against each of the enzymes and transporters indicated, in the absence or presence of 5nM or 20nM exogenous acetate added one day after transduction, cultured in Th1 conditions (n = 3 technical replicates). Heatmap summarizing downregulated genes determined by RNA-seq for cells expressing e, Slc25a1 targeting sgRNA or f, Slc25a11 targeting sgRNA, p<0.05. Representative plots and a graph summarizing the results of at least two independent experiments are shown. Mean and s.d. of replicates are presented on summarized plots and unpaired, two-sided t-test used to determine significance (*p<0.05; **p<0.01; ***p<0.001).
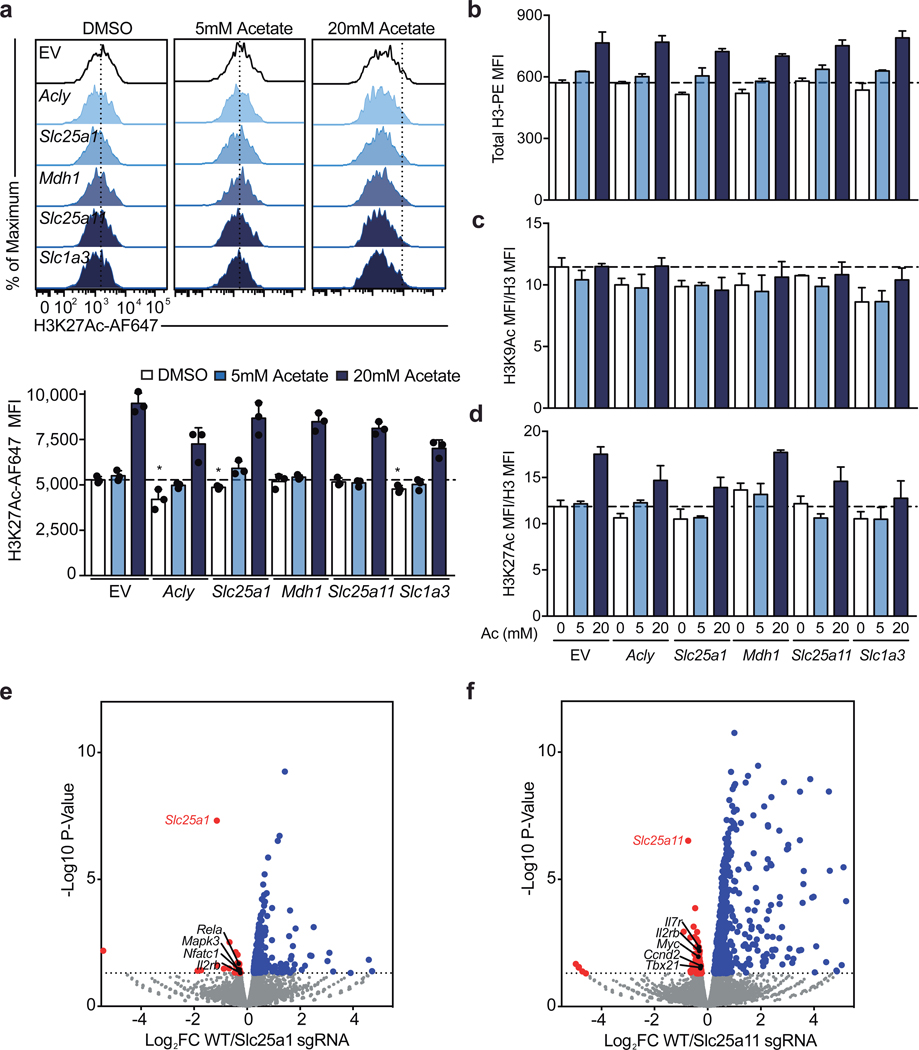
Previous reports have suggested that Acly activity is required for Th1 cell histone acetylation and the ETC has been shown to support epigenetic remodeling7,12. To test the role of both shuttle systems during Th1 cell epigenetic remodeling, we evaluated total cellular H3K9 and H3K27 acetylation. We found that impairing Acly, Slc25a1, Mdh1, Slc25a11, and Slc1a3 results in decreased H3K9Ac and that acetate supplementation could compensate for these defects (Fig. 3c, d). In contrast, H3K27Ac was largely unaffected by targeting these genes, with the exception of Slc25a1; however, addition of acetate resulted in enhanced H3K27Ac regardless of the condition (Extended Data Fig. 6a). This effect of acetate on histone acetylation is largely explained by an increase in total H3 content, whereas the impact of the sgRNA on acetylation is only partially explained by changes in total histone mass (Extended Data Fig. 6b-d).
To evaluate the transcriptional effects of malate-aspartate shuttle deficiency, we performed RNA-seq on day 5 Th1 cells expressing sgRNA against either Slc25a1 or Slc25a11. Consistent with a role for the shuttles in promoting Th1 cell differentiation, we observed decreased expression of genes with known roles in T cell activation and Th1 cell programming. Targeting either transporter impaired expression of Il2rb, while loss of Slc25a1 impacted key T cell activation genes such as Nfatc1, Rela, and Mapk3, and disruption of Slc25a11 resulted in loss in expression of genes including Tbx21, Nfatc3, Ccnd2, and Myc (Fig. 3e & f; Extended Data Fig. 6e, f; Supplementary Table 3 and 4).
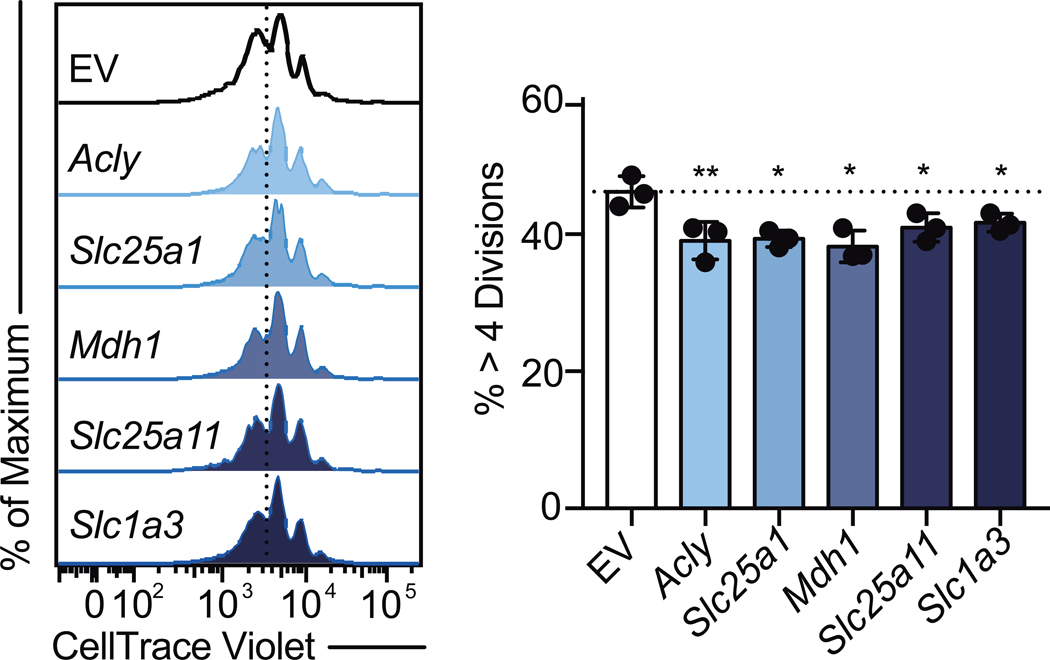
Given the importance of Il2rb, Myc, and Ccnd2 in Th cell division, we next evaluated the role of the shuttles in regulating Th cell proliferation. To test this, we evaluated cell division in Th1 cultured cells expressing sgRNA targeting Acly, Slc25a1, Mdh1, Slc25a11, Slc1a3. Relative to controls, targeting any of these genes resulted in modestly but significantly decreased proliferation (Extended Data Fig. 7). Collectively, these data demonstrate that the malate-aspartate shuttle and mitochondrial citrate export are required for Th1 cell proliferation and transcriptional remodeling.
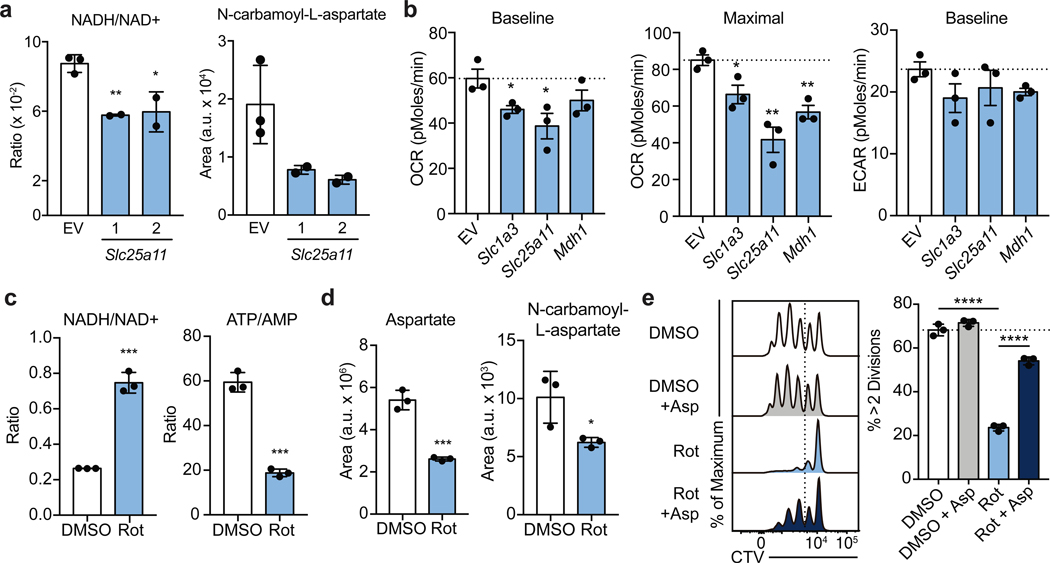
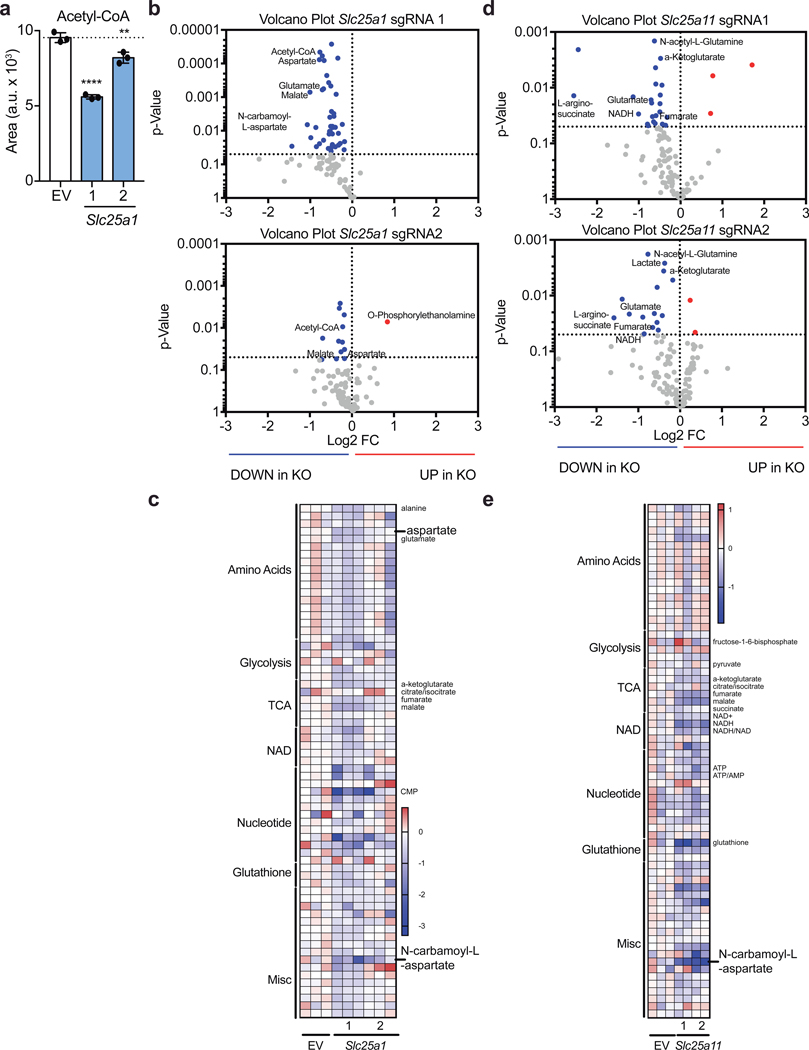
To investigate the biochemical mechanism explaining these observations, we performed mass-spectrometry analysis of T cells transduced with guides targeting either Slc25a1 or Slc25a11 sgRNA. As expected, we found that disrupting citrate transport results in decreased cellular acetyl-CoA levels (Extended Data Fig. 8a-c). Unexpectedly, targeting Slc25a11 resulted in a decreased NADH/NAD+ ratio, suggesting that the activity of Complex I is a primary mechanism by which the cellular NADH/NAD+ balance is regulated in activated Th1 cells (Fig. 4a; Extended Data Fig. 8d, e). Moreover, targeting either shuttle system resulted in diminished levels of intermediates of the pentose phosphate pathway and of N-carbamoyl-L-aspartate, an essential precursor molecules for nucleotide synthesis (Fig. 4a and Extended Data Fig. 8b-c; 9a, b). Consistent with a role for the shuttling systems in providing mitochondrial NADH for the ETC, Seahorse analysis demonstrated that rates of basal and maximal oxygen consumption (OCR) were impaired upon expression of sgRNAs targeting either Mdh1, Slc25a11, or Slc1a3 (Fig. 4b). This was not substantially compensated for by increased glycolysis, as the extracellular acidification rate (ECAR) was minimally impacted (Fig. 4b).
Figure 4: The malate-aspartate shuttle promotes Complex I activity, which is required for aspartate synthesis and Th cell proliferation.
a, Cellular NADH/NAD+ ratio and N-carbamoyl-L-aspartate measured by LC-MS analysis in Cas9tg CD4 T cells transduced with sgRNA targeting Scl25a11 and cultured in Th1 conditions as described in Methods (n = 2 biological replicates, n = 2 technical replicates). b, Baseline OCR, maximal OCR, and baseline ECAR of Cas9tg CD4 T cells transduced with distinct sgRNAs targeting each of the enzymes and transporters indicated cultured in Th1 conditions at day 4 (n = 3 biological replicates). c, Cellular NADH/NAD+ and ATP/AMP ratios and d, aspartate and N-carbamoyl-L-aspartate measured by LC-MS analysis in WT CD4 T cells cultured in Th1 conditions and treated with DMSO or rotenone for 4 hours on day 4 (n = 3 technical replicates). e, proliferation measured at day 3 of WT CD4 T cells cultured in Th1 conditions and treated on day 2 with DMSO (clear and grey bar) or rotenone (blue bars) ± 20 mM aspartate (n = 3 technical replicates). Representative plots and a graph summarizing the results of at least two independent experiments are shown. Mean and s.d. are presented on summarized plots and unpaired, two-sided t-test used to determine significance (*p<0.05; **p<0.01; ***p<0.0001; ****p<0.00001).
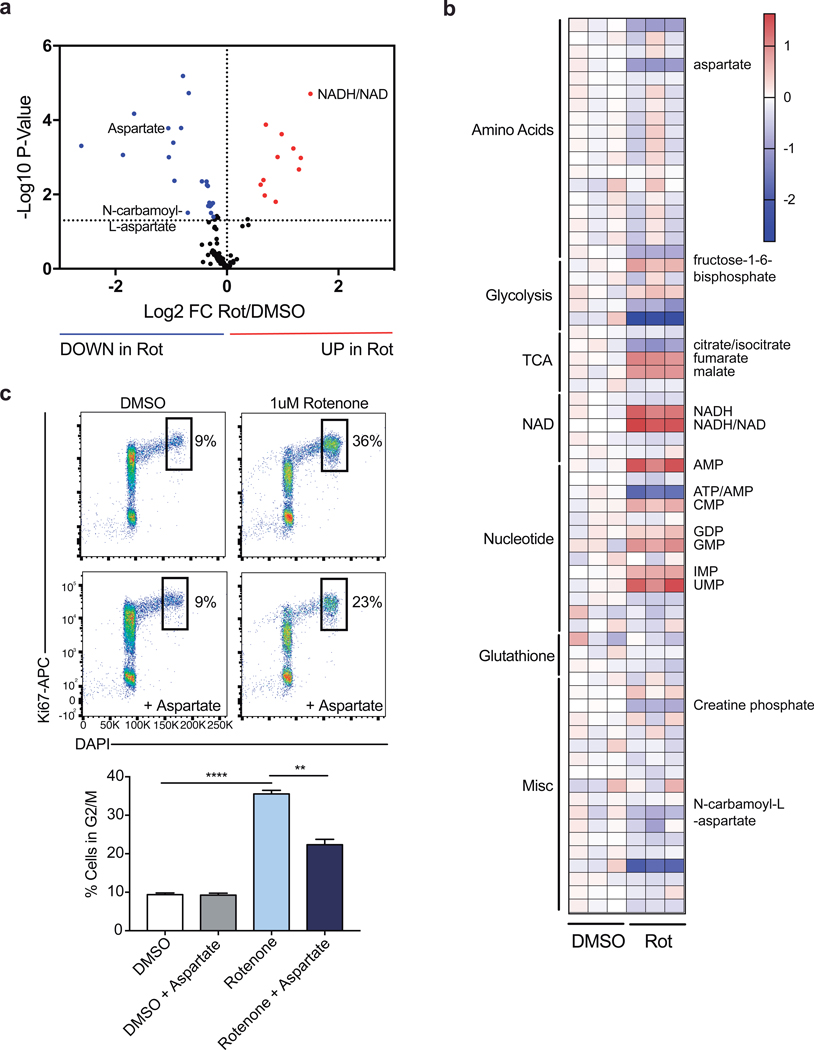
Having observed that Complex I supports early Th cell proliferation and that the malate-aspartate shuttle fuels Complex I (Fig. 1c), we next sought to examine the biochemical mechanism by which Complex I promotes proliferation and performed mass-spectrometric analysis on rotenone treated cells. As expected, inhibiting Complex I elevated the NADH/NAD+ ratio and decreased the ATP/AMP ratio (Fig. 4c; Extended Data Fig. 9a, b). Rotenone treatment also led to decreased pools of cellular aspartate and N-carbamoyl-L-aspartate in these cells, similar to observations in cancer cell lines (Fig. 4d)13,14. To test if this aspartate synthesis deficiency contributed to the proliferative defects of rotenone treated cells, we supplemented rotenone treated cells with aspartate and evaluated cell division and cell cycle. Indeed, aspartate supplementation resulted in a significant recovery of cell proliferation and a partial release from the G2/M arrest after rotenone treatment (Fig. 4e; Extended Data Fig. 9c). Altogether, these data demonstrate that the regulation of Complex I by mitochondrial shuttling systems determines the cellular redox balance and cytosolic aspartate availability required for T cell proliferation.
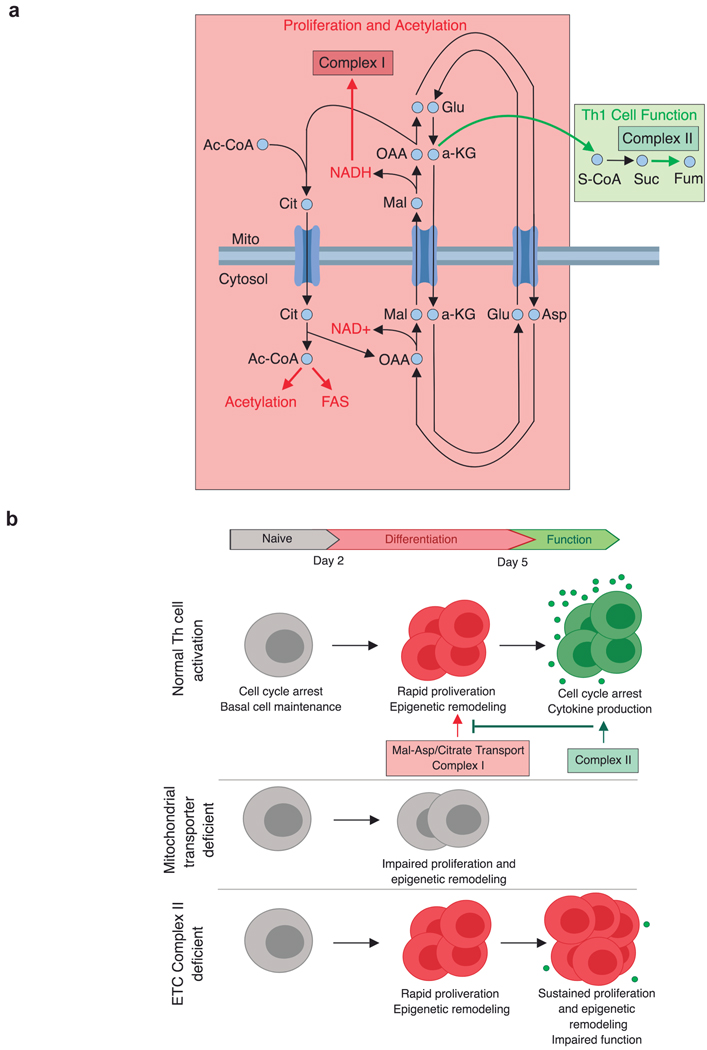
Using approaches combining network-level genetic interrogation of metabolic pathways, pharmacology, transcriptomics, and metabolomics, we demonstrate how Th1 cells must meet the distinct metabolic demands of differentiation and function during the course of activation. To generate the substrates needed for proliferation and epigenetic remodeling, early activated Th cells fuel Complex I through the malate-aspartate shuttle and mitochondrial citrate export. Unlike the carbon neutral malate-aspartate shuttle, that exchanges malate for α-ketoglutarate, Complex II moves carbon forward in the TCA cycle, thereby restricting processes that support differentiation and promoting late-stage Th1 effector function, permitting cells to exit the cell cycle and adopt their terminal program (see graphical model in Extended Data Fig. 10). These findings illustrate how differentiation and terminal effector function, previously understood to be concordantly regulated by signal transduction, are controlled by distinct metabolic modules, elucidating how cell programming is governed by parallel transcriptional and biochemical networks.
Methods
T cell assays and sgRNA delivery.
CD4 T cells were isolated from constitutive Cas9-expressing (Cas9tg) B6 mice15, stimulated with anti-CD3 and anti-CD28 coated beads (Miltenyi T Cell Activation/Expansion Kit, mouse), and cultured in assay determined Th1 conditions (5 ng/ml IL-2, 2 ng/ml IL-12, 10 μg/ml anti-IL4). On day one post-activation, T cells were transduced with MG-guide retrovirus using spin transduction at 1200xg for 90 minutes at 37C. IFNγ cytokine was measured by adding Brefeldin A one hour after the addition of PMA (20 ng/ml) and ionomycin (20 ng/ml); four hours post-restimulation, cell were fixed, stained with anti-CD4 (Biolegend), anti-GFP (Millipore), and anti-IFNγ (Biolegend), and analyzed by flow cytometry. To assay for Ifng-katushka, IL-4-GFP, and IL-17-GFP expression, T cells from Ifng-Katushka16, 4GET (Jackson Labs, 004190), and IL-17-GFP (Jackson Labs, 018472) reporter mice were activated with PMA and ionomycin for four hours, stained with anti-CD4, and then analyzed by flow cytometry for reporter activity in GFP+ cells. Cell division was measure by labeling cells with CellTrace Violet (Thermo) prior to activation and evaluated for proliferation at day 3 post-activation; where indicated, inhibitors and metabolites were added to the media overnight on day 2 post-activation. Cell cycle status was determined by intracellular flow cytometry analysis of Ki67 and DAPI, day 3 post-activation; where indicated, inhibitors and metabolites were added to the media overnight on day 2 post-activation. Mitochondrial ROS was measured by flow cytometry in CD4 T cells by staining cells with MitoSOX Red mitochondrial superoxide indicator (Thermo) and anti-CD4 for 30 minutes at 37C in the presence of the indicated inhibitors. For all experiments using inhibitors or metabolite supplementation the following doses were used: 1 μM rotenone (Sigma), 10 mM dimethyl malonate (Sigma), 1 mM 3-nitropropionic acid (Sigma), 100 μM thenoyltrifluoroacetone (Sigma), 1 μM atpenin A5 (Cayman Chemical), 1 μM antimycin A (Sigma), 1 μM oligomycin (Sigma), 5mM diethyl succinate (Sigma), or 20mM aspartate. All mice required for this study were housed and maintained under specific-pathogen-free conditions in the animal facility of the Yale University School of Medicine, and all corresponding animal protocols were approved by the Institutional Animal Care and Use Committee (IACUC) of Yale University. This study was conducted in compliance with all relevant ethical regulations. All cells used for experimentation were harvested from male and female mice at 6–8 weeks of age.
MGguide vector generation, sgRNA cloning, and retroviral production.
MGguide was generated by removing the IRES element from MIGR1 (Addgene) by EcoRI and NotI digestion and adding the human U6 promoter and SV40 promoter from pMKO-GFP (Addgene) by Infusion assembly (Clonetech). To add the sgRNA cloning site, the vector was digested with AgeI and EcoRI and combined by Infusion assembly with an IDT Gene Block containing two BbsI restriction sites upstream of a scaffold RNA sequence and a U6 stop. To clone individual sgRNA, MG-guide was digested with BbsI and pairs of oligonucleotides (Sigma) with complimentary overhangs were annealed and ligated into the vector. For retroviral production, 1 μg of MGguide plasmid and 0.5 μg of EcoHelper plasmid was transfected into 500e3 HEK293T cells (source ATCC, identity unconfirmed, not mycoplasma tested) in a 6-well plate using X-tremeGENE 9 DNA Transfection Reagent (Roche) overnight. The media was then replaced, and virus collected 24hrs later. 1e6 isolated CD4 T cells were stimulated overnight, and spin transduced in the viral preparation with 1 μg/mL polybrene at 1200xg for 90 minutes at 37C.
RNA-seq analysis.
Raw reads from RNA-sequencing were aligned to the mouse genome mm10 with STAR 2.7.017, and gene expression levels were measured by HTSeq 0.11.1 [PMID: 25260700]. Subsequently, differential expression analysis between different groups was performed with DESeq218.
Seahorse analysis.
Analysis was performed on cells at D3, D4, and D5 post-activation. Cells were washed three times in complete Seahorse media (Seahorse Bioscience) with 10mM glucose, 1mM sodium pyruvate and 2mM glutamine. Cells were plated at 400e3 cells per well in a 96-well Seahorse assay plate pretreated with poly-D-lysine. Cells were equilibrated to 37C for 30 minutes prior to assay. Oxygen consumption rate (OCR; pMoles/min) and extracellular acidification rate (ECAR; mpH/min) were measured as indicated upon cell treatment with oligomycin (0.5 mM), FCCP (0.2 mM), rotenone (1 μM), dimethyl malonate (10mM), and Antimycin A (1 μM ) according to the manufacturer’s instructions.
Metabolome extraction.
Cells were seeded at 10e6 cells/mL and incubated for 4 hours in complete RPMI containing dialyzed FBS media. They were then transferred to 1.5mL tubes and pelleted (1min, 6000g, RT). Media was removed by aspiration and the cells were washed once with 500 μL of PBS. Metabolome extraction was performed by the addition of 50 μL of ice cold solvent (40:40:20 ACN:MeOH:H2O + 0.5%FA). After a 5-min incubation on ice, acid was neutralized by the addition of NH4HCO3. After centrifugation (15min, 16000g, 4 °C), the clean supernatant was transferred to a clean tube, frozen on dry ice and kept at −80 °C until LC-MS analysis19.
Succinate quantification.
10e6 cells WT CD4 T cells were activated under Th1 culture conditions. After 4 days, cells were replated into fresh media and cultured with either DMSO, 10 mM dimethyl malonate, 1 mM 3-nitropropionic acid, 100 μM thenoyltrifluoroacetone, or 1 μM atpenin A5 for 6 hours. Cells were then harvested, processed, and analyzed using the Succinate Assay Kit (Abcam) according to the manufacturer’s protocol.
LC-MS analysis.
Cell extracts were analyzed using a quadrupole-orbitrap mass spectrometer (Q Exactive, Thermo Fisher Scientific, San Jose, CA) coupled to hydrophilic interaction chromatography via electrospray ionization. LC separation was on a XBridge BEH Amide column (2.1 mm x 150 mm, 2.5 μm particle size; Waters, Milford, MA) using a gradient of solvent A (20 mM ammonium acetate, 20 mM ammonium hydroxide in 95:5 water: acetonitrile, pH 9.45) and solvent B (acetonitrile). Flow rate was 150 μl/min, column temperature was 25 ºC, autosampler temperature was 5°C, and injection volume was 10 μL. The LC gradient was: 0 min, 90% B; 2 min, 85% B; 3 min, 75% B; 7 min, 75% B; 8 min, 70% B; 9 min, 70% B; 10 min, 50% B; 12 min, 50% B; 13 min, 25% B; 14 min, 25% B; 16 min, 0% B; 21 min, 0% B; 22 min, 90% B; 25 min, 90% B. Autosampler temperature was 5°C, and injection volume was 10 μL. The mass spectrometer was operated in negative ion mode to scan from m/z 70 to 1000 at 1Hz and a resolving power of 140,00020. Data were analyzed using the MAVEN software21.
Statistical analysis.
Experiments were conducted with technical and biological replicates at an appropriate sample size as estimated by our prior experience. No statistical methods were used to predetermine sample size. No methods of randomization and no blinding were applied. All data were replicated independently at least once as indicated in the figure legends, and all attempts to reproduce experimental data were successful. For all bar graphs, mean + s.d. are shown. All statistical analysis was performed using GraphPad Prism 7 or newer. p-values <0.05 were considered significant (*p<0.05, **p<0.01; ***p<0.001, **** p<0.0001); p-values >0.05; non-significant (ns). FlowJo 8.0 or newer (Treestar) was used to analyze flow cytometry data. All sample sizes and statistical tests used are detailed in each figure legend.
Extended Data
Extended Data Figure 1. Acute ETC inhibition alters cell cycle but not viability in Th1 cells.
a, Viability measured by PI and Annexin-V staining of WT CD4 T cells cultured in Th1 conditions and treated overnight for 16 hours on day 1, 2, or 3 of culture with DMSO, rotenone, dimethyl malonate (DMM), antimycin A, or oligomycin (n = 3). b, cell cycle analysis measured by Ki-67 and DAPI of CD4 T cells cultured in Th1 conditions on day 3 following 16-hour overnight treatment with DMSO (n = 5), rotenone, DMM, antimycin A, or oligomycin (n = 6). n = number of technical replicates. Representative plots and a graph summarizing the results of three independent experiments are shown. Mean and s.d. of replicates are presented on summarized plots and unpaired, two-tailed t-test used to determine significance (*p<0.05, **p<0.01).
Extended Data Figure 2. ETC regulation of proliferation is conserved among Th subtypes but ETC requirements for effector cytokine transcription differ between Th1, Th2, and Th17 cells.
Proliferation of WT CD4 T cells cultured in a, Th2, and b, Th17 conditions following 16-hour overnight treatment with DMSO, rotenone, or oligomycin (n = 3). Cell cycle analysis measured by Ki-67 and DAPI of CD4 T cells cultured in c, Th2, and d, Th17 conditions on day 3 following 16-hour overnight treatment with DMSO, rotenone, DMM, antimycin A, or oligomycin (n = 6). Effector cytokine transcription after PMA and ionomycin restimulation at day 5 measured by e, IL-4-GFP (4GET) reporter expression in cells cultured in Th2 conditions and f, IL17-GFP reporter expression in cells cultured in Th17 conditions following 16-hour overnight treatment with DMSO, rotenone, DMM, antimycin A, or oligomycin (n = 3). n = number of technical replicates. Representative plots and a graph summarizing the results of three independent experiments are shown. Mean and s.d. of replicates are presented on summarized plots and unpaired, two-tailed t-test used to determine significance (*p<0.05, **p<0.01; ***p<0.001, **** p<0.0001).
Extended Data Figure 3. Complex II inhibition is functional and leads to a loss of IFNγ production in Th1 cells.
a, Cellular succinate at day 5 evaluated using Succinate Assay Kit (Abcam) in WT CD4 T cells cultured in Th1 conditions following 6-hour treatment with DMSO, 10 mM dimethyl malonate (DMM), 1 mM 3-nitropropionic acid (3NP), 100 μM thenoyltrifluoroacetone (TTFA), or 1 μM atpenin A5 (n = 3). b, IFNγ protein production after PMA and ionomycin restimulation at day 5 of WT CD4 T cells cultured in Th1 conditions following 16-hour overnight treatment with 10 mM diethyl succinate (DES) (n = 5) or DMSO (n = 4). c, IFNγ protein production after PMA and ionomycin restimulation at day 5 of Cas9tg CD4 T cells cultured in Th1 conditions transduced with one of three individual sgRNA targeting Sdha or an empty vector control (n = 3 biological replicates). Total cellular d, succinate and, e, α-ketoglutarate measured by LC-MS analysis in WT or Sdhc cKO CD4 T cells cultured in Th1 conditions after 4-hour culture in dialyzed FBS containing media at day 5 (n = 3). n = number of technical replicates unless otherwise stated. Representative plots and a graph summarizing the results of at least two independent experiments are shown. Mean and s.d. of replicates are presented on summarized plots and unpaired, two-tailed t-test used to determine significance (*p<0.05, **p<0.01; ***p<0.001, **** p<0.0001).
Extended Data Figure 4. Retroviral expression of sgRNA in Cas9tg CD4 T cells.
a, Schematic of MG-guide retroviral vector. b, CD4 T cells from Cas9tg mice were stimulated with anti-CD3 and anti-CD28 coated beads for 24 hours and retrovirally transduced with either a MG-guide (empty vector) or a MG-guide vector cloned to express a sgRNA against Thy1 (Thy1 sgRNA). GFP expression was measured at 24 hours post-transduction, compared to non-transduced cells. c, Thy1.1 protein expression was measured in transduced (empty vector blue line; Thy1 sgRNA red line) and non-transduced cells (solid gray) by flow cytometry at 30 and 96 hours post transduction. d, Schematic of experimental design for functional Th1 sgRNA studies. e, CD4 T cells from Cas9tg mice were stimulated with anti-CD3 and anti-CD28 beads in IL-2 (5 ng/mL), anti-IL-4 (10 ug/mL), and IL-12 (2 ng/mL) and retrovirally transduced 24 hours after activation with either empty MG-guide (shaded blue) or MG-guide expressing a sgRNA against Tbx21 (outline). T-bet protein expression was measured by intracellular flow cytometry on day 3. f, Cas9tg CD4 T cells were cultured as above and infected with either MGguide, a sgRNA against Tbx21, or a sgRNA against Il12rb. IFNγ protein was measured by intracellular flow cytometry on day 5 after restimulation with PMA (20 ng/ml) and ionomycin (1 ug/ml).
Extended Data Figure 5. Complex II regulates epigenetic modifications and program specific gene expression in Th1 cells.
a, H3K9Ac and H3K27Ac normalized to total cellular H3 and 1X DNA content on day 3 of WT CD4 T cells cultured in Th1 conditions after 16-hour overnight treatment with dimethyl malonate (DMM), oligomycin, BMS-303141, or butyrate (n = 3). b, H3K9Ac and, c, H3K27Ac at day 5 of Cas9tg CD4 T cells cultured in Th1 conditions transduced with one of three individual sgRNA targeting Sdha or an empty vector control (n = 3 biological replicates). d, Volcano plot summarizing RNA-sequencing data indicating most differentially regulated transcripts between WT and Sdhc cKO Th1 cells and e, GSEA enrichment plot of the gene ontology (GO) cytokine production pathway (n = 3 biological replicates). n = number of technical replicates unless otherwise stated. Representative plots and a graph summarizing the results of at least two independent experiments are shown. Mean and s.d. of replicates are presented on summarized plots and unpaired, two-tailed t-test used to determine significance (*p<0.05, **p<0.01).
Extended Data Figure 6. The malate-aspartate shuttle and mitochondrial citrate export dynamically regulate histone acetylation and program specific gene expression in Th1 cells.
a, H3K27Ac, b, total cellular H3, c, H3K9Ac normalized to total cellular H3 and 1X DNA content, and d, H3K27Ac normalized to total cellular H3 and 1X DNA content on day 4 of Cas9tg CD4 T cells transduced with three individual sgRNA targeting Acly, Slc25a1, Mdh1, Slc25a11, or Slc1a3 or empty vector cultured in Th1 conditions (n = 3 biological replicates). Volcano plot summarizing RNA-sequencing data indicating most differentially regulated transcripts at day 5 in Ca9tg CD4 T cells cultured in Th1 conditions transduced with empty vector or one sgRNA targeting e, Slc25a1 or, f, Slc25a11 (n = 2 biological replicates). Representative plots and a graph summarizing the results of at least two independent experiments are shown. Mean and s.d. of replicates are presented on summarized plots and unpaired, two-tailed t-test used to determine significance (*p<0.05).
Extended Data Figure 7. The malate-aspartate shuttle and mitochondrial citrate are required for proliferation in Th1 cells.
Proliferation of Cas9tg CD4 T cells transduced with empty vector control or one of three individual sgRNA targeting Acly, Slc25a1, Mdh1, Slc25a11, or Slc1a3 cultured in Th1 conditions at day 5 (n = 3 biological replicates). Representative plots and a graph summarizing the results of at least two independent experiments are shown. Mean and s.d. of replicates are presented on summarized plots and unpaired, two-tailed t-test used to determine significance (*p<0.05; **p<0.01).
Extended Data Figure 8. The malate-aspartate shuttle and mitochondrial citrate export regulate cellular acetyl-CoA levels and cellular metabolism.
a, Cellular acetyl-CoA measured by LC-MS analysis in Cas9tg CD4 T cells transduced with empty vector or 2 individual sgRNA targeting Slc25a1 as described on day 5 of culture in Th1 conditions (n = 2 biological replicates; n = 3 technical replicates). b, Volcano plot and, c, heatmap of all metabolites measured by LC-MS analysis in Cas9tg CD4 T cells transduced with empty vector or 2 individual sgRNA targeting Slc25a1 as described on day 5 of culture in Th1 conditions (n = 2 biological replicates; n = 3 technical replicates). d, Volcano plot and, e, heatmap of all metabolites measured by LC-MS analysis in Cas9tg CD4 T cells transduced with empty vector or 2 individual sgRNA targeting Slc25a1 as described on day 5 of culture in Th1 conditions (n = 2 biological replicates; n = 2 technical replicates). Mean and s.d. of replicates are presented on summarized plots and unpaired, two-tailed t-test used to determine significance (**p<0.01; ****p<0.0001).
Extended Data Figure 9. Complex I activity is required for aspartate production and cell cycle progression in activating Th1 cells.
a, Volcano plot and, b, heatmap of all metabolites measured by LC-MS analysis in WT CD4 T cells treated acutely for 4 hours on day 5 of culture in Th1 conditions (n = 3). c, Cell cycle analysis using Ki-67 and DAPI of WT CD4 T cells cultured in Th1 conditions at day 3 following 16-hour overnight treatment with DMSO or rotenone ± 20 mM aspartate (n = 3). n = number of technical replicates. Representative plots and a graph summarizing the results of at least two independent experiments are shown. Mean and s.d. of replicates are presented on summarized plots and unpaired, two-tailed t-test used to determine significance (**p<0.01; ****p<0.0001).
Extended Data Figure 10. Conceptual models of mitochondrial metabolite transport and the consequence of metabolic perturbations on Th1 cell activation.
a, Early-stage Th1 cell activation is supported by the malate-aspartate shuttle and mitochondrial citrate export. These mitochondrial transport systems provide the key substrates needed for cell division and histone acetylation. Citrate export results in cytosolic acetyl-CoA production that can be used to synthesize the fatty acids needed for plasma membrane expansion during division as well as the acetyl-groups used for histone acetylation. Interconnected with this export pathway is the malate-aspartate shuttle, a carbon-neutral cycle that results in the net movement of NAD+ to the cytosol and NADH into the mitochondria, whereby it can fuel the activity of electron transport chain (ETC) Complex I. Through the activity of Complex I, NAD+ can be continually recycled, enabling the production of aspartate, an essential precursor for nucleotide synthesis. These processes are antagonized by the activity of succinate dehydrogenase (SDH)/ETC Complex II, which consumes α-ketoglutarate, limiting its availability for the malate-aspartate shuttle and promoting Th1 cell effector function. b, Th cell activation is defined by two major phases: 1) a period of rapid division and epigenetic remodeling; and 2) cell cycle arrest and cytokine production. Each of these phases is supported by a discrete component of mitochondrial metabolism. The malate-aspartate shuttle and citrate export generate the material needed for early phase differentiation to occur. As differentiation continues, the activity of Complex II draws carbon away from the shuttle and thus acts to pull activated Th1 cells out of the differentiation process and to enable to them to fully engage their terminal effector cell program. When the mitochondrial transport networks are disrupted, Th1 cells are unable to properly proliferate or epigenetically reprogram. In contrast, inhibiting the activity of Complex II causes activated Th1 cells to continuously proliferate and remodel their chromatin, preventing them from exiting the differentiation phase and engaging their terminal effector program.
Supplementary Material
Acknowledgments
This work was supported by NIH grants R37 AR40072, R61 AR073948 (J.C. and R.A.F.), F31 AI1333855 (J.A.S.), T32 AI7019-41 (J.A.S.), R01 CA166025-04 (L.J.M), T32 GM065841-14 (L.J.M.), the Howard Hughes Medical Institute (R.A.F), European Union’s Horizon 2020, and Marie Sklodowska-Curie grant agreement No 751423 (J.C.G.C), and the Paradifference Foundation (L.J.M.).
Footnotes
Publishers note: Springer Nature remains neutral with regard to jurisdictional claims in publisher maps and institutional affilliations.
Data availability. The data that support the findings of this study are available from the corresponding author upon reasonable request. RNA-seq data sets have been deposited in Gene Expression Omnibus under the accession number GSE130713.
The authors declare no competing financial interests.
References
- 1.Buck MD, Sowell RT, Kaech SM & Pearce EL Metabolic Instruction of Immunity. Cell 169, 570–586 (2017). [DOI] [PMC free article] [PubMed] [Google Scholar]
- 2.Buck MD, O’Sullivan D. & Pearce EL T cell metabolism drives immunity. J. Exp. Med 212, 1345–60 (2015). [DOI] [PMC free article] [PubMed] [Google Scholar]
- 3.Klein Geltink RI et al. Mitochondrial Priming by CD28. Cell 171, 385–397.e11 (2017). [DOI] [PMC free article] [PubMed] [Google Scholar]
- 4.Buck MD et al. Mitochondrial Dynamics Controls T Cell Fate through Metabolic Programming Correspondence. Cell 166, 63–76 (2016). [DOI] [PMC free article] [PubMed] [Google Scholar]
- 5.Chang C-H et al. Posttranscriptional control of T cell effector function by aerobic glycolysis. Cell 153, 1239–1251 (2013). [DOI] [PMC free article] [PubMed] [Google Scholar]
- 6.Wang R. et al. The Transcription Factor Myc Controls Metabolic Reprogramming upon T Lymphocyte Activation. Immunity 35, 871–882 (2011). [DOI] [PMC free article] [PubMed] [Google Scholar]
- 7.Peng M. et al. Aerobic glycolysis promotes T helper 1 cell differentiation through an epigenetic mechanism. Science 354, 481–484 (2016). [DOI] [PMC free article] [PubMed] [Google Scholar]
- 8.Peters R. Biochemical Lessions and Lethal Synthesis. (Pergamon Press, 1963). [Google Scholar]
- 9.Contreras L. & Satrústegui J. Calcium signaling in brain mitochondria: interplay of malate aspartate NADH shuttle and calcium uniporter/mitochondrial dehydrogenase pathways. J. Biol. Chem 284, 7091–7099 (2009). [DOI] [PMC free article] [PubMed] [Google Scholar]
- 10.Safer B. Brief Reviews The Metabolic Significance of the Malate-Aspartate Cycle in Heart. Circ. Res 37, 527–533 (1975). [DOI] [PubMed] [Google Scholar]
- 11.LaNoue KF & Williamson JR Interrelationships between malate-aspartate shuttle and citric acid cyce in rat heart mitochondria. Metabolism 20, 119–140 (1971). [DOI] [PubMed] [Google Scholar]
- 12.Wellen KE et al. ATP-Citrate Lyase Links Cellular Metabolism to Histone Acetylation. Science 324, 1076–1080 (2009). [DOI] [PMC free article] [PubMed] [Google Scholar]
- 13.Birsoy K. et al. An Essential Role of the Mitochondrial Electron Transport Chain in Cell Proliferation Is to Enable Aspartate Synthesis. Cell 162, 540–551 (2015). [DOI] [PMC free article] [PubMed] [Google Scholar]
- 14.Sullivan LB et al. Supporting Aspartate Biosynthesis Is an Essential Function of Respiration in Proliferating Cells. Cell 162, 552–563 (2015). [DOI] [PMC free article] [PubMed] [Google Scholar]
Methods References
- 15.Platt RJ et al. CRISPR-Cas9 knockin mice for genome editing and cancer modeling. Cell 159, 440–55 (2014). [DOI] [PMC free article] [PubMed] [Google Scholar]
- 16.Gagliani N. et al. Coexpression of CD49b and LAG-3 identifies human and mouse T regulatory type 1 cells. Nat. Med 19, 739 (2013). [DOI] [PubMed] [Google Scholar]
- 17.Dobin A. et al. STAR: ultrafast universal RNA-seq aligner. Bioinformatics 29, 15–21 (2013). [DOI] [PMC free article] [PubMed] [Google Scholar]
- 18.Love MI, Huber W. & Anders S. Moderated estimation of fold change and dispersion for RNA-seq data with DESeq2. Genome Biol. 15, 550 (2014). [DOI] [PMC free article] [PubMed] [Google Scholar]
- 19.Lu W, Wang L, Chen L, Hui S. & Rabinowitz JD Extraction and Quantitation of Nicotinamide Adenine Dinucleotide Redox Cofactors. Antioxid. Redox Signal 28, 167–179 (2018). [DOI] [PMC free article] [PubMed] [Google Scholar]
- 20.Jang C. et al. The Small Intestine Converts Dietary Fructose into Glucose and Organic Acids. Cell Metab. 27, 351–361.e3 (2018). [DOI] [PMC free article] [PubMed] [Google Scholar]
- 21.Melamud E, Vastag L. & Rabinowitz JD Metabolomic Analysis and Visualization Engine for LC−MS Data. Anal. Chem 82, 9818–9826 (2010). [DOI] [PMC free article] [PubMed] [Google Scholar]
Associated Data
This section collects any data citations, data availability statements, or supplementary materials included in this article.


