Abstract
Tiopronin-protected silver nanoparticles (average diameter = 5 nm) were partially displaced by (2-mercapto-propionylamino) acetic acid 2,5-dioxo-pyrrolidin-1-ylesters via ligand exchange, and the succinimide-terminated silver particles were bound to amine-labeled Dextran 3000 (1 amine/per chain) or Dextran 10 000 (2.5 amine/per chain), respectively. The particle–Dextran 10 000 adducts were self-aggregated by interactions of multiple amines on Dextran and multi-functionalized ligands on the particle. The transverse plasmon band was blue shifted while the longitudinal plasmon at 575 nm increased, corresponding to the compact aggregation of particles. The particle–Dextran 3000 adducts, which were not aggregated, were coupled to Concanavalin A (Con A) to facilitate the aggregation of particles. The aggregated particles displayed an absorbance spectral change depending on the mole ratio of Con A/particle–Dextran 3000. The particle–Dextran 3000 adduct was released by a competitive complexation of glucose. This process was monitored by both the change in plasmon absorbance and wavelength, with the glucose concentration. The aggregation and dissociation of Con A/particle–Dextran complexes were also verified by TEM images.
Introduction
The ability to measure glucose levels in blood is an important diagnostic tool.1,2 Numerous efforts have been undertaken with noninvasive methods to ideally render minimal discomfort for patients.3,4 One such approach used fluorescence spectroscopy to investigate the effects of before and after binding blood glucose to labeled organic compounds or superstructures.5 Concanavalin A (Con A), a well-known glucose binding protein, can also bind to polysaccharides.6 The bound polysaccharide can be released from the Con A-polysaccharide complex by a competitive complexation of glucose, resulting in an obvious change in fluorescence intensity or lifetime if the Con A and polysaccharide are respectively labeled with donors and acceptors.7
Metallic nanoparticles are most suitable as nanoscale supports for binding biological materials to develop next-generation superstructures.8,9 The particles have a characteristic plasmon absorbance when the core diameter is larger than 2 nm,10,11 and the plasmon absorbance is sensitive to the surrounding medium and expected to change when the particles were aggregated.12 Such features could be useful for simple carbohydrate detection (Scheme 1). The particles, bound to amine-labeled Dextran, were aggregated on the Con A to yield Con A/Dextran—particle complexes. Using the particles as chromophores, the complexes were dissociated and the Dextran—particle adducts were released by the glucoses through a competitive complexation process, corresponding to the absorbance spectral change. This process may be expected to be used in glucose detection and the development of a novel glucose sensor.
SCHEME 1:
Preparation, Aggregation, and Competitive Dissociation of Silver Particles
The particles were required to have only a small quantity of functionalized groups on the metallic cores to prevent direct chemical binding between the particle and Con A. Organic monolayer-protected metallic nanoparticles have particularly interesting characteristics such as easy preparation, chemical stability, and quantitative controlling of their multiple function-alization.10,11 The sizes of metallic cores are controlled in an average range of 1 – 10 nm by using various mole ratios of organic thiol derivative/metallic salt in the preparation.13 The absorbance intensity and wavelength are sensitive to the core size and composition of the monolayer.14 The particles can also be suitably decorated by dye molecules either within/or on their monolayers,15,16 and the biological superstructures from particles can be determined simultaneously by the absorbance and luminescence spectra.
N-(2-mercaptopropionyl)glycine (tiopronin) monolayer-protected silver particles, which have been reported to display a high stability and solubility in water,17 were prepared. Thiolate succinimide ligands were partially displaced to the monolayer coated on the silver core by ligand exchange (Scheme 1).13 The mixed-monolayer particles were chemically bound to Dextran 3000 (1 amine/per chain) to produce a particle–Dextran adduct.18 They were also bound to Dextran 10 000 (2.5 amine/per chain) as a controlling reference. The particle–Dextran 3000 adducts were aggregated on the Con A, and the particle–Dextran 3000 adducts were released by competitive complexation of glucose. The complexation and releasing were monitored by optical density measurements, which could provide a novel approach to detect aqueous glucose.
Experimental Section
Chemicals.
All reagents (Aldrich), spectroscopic grade solvents (Fisher, Aldrich), and deuterated solvents (Aldrich) were used as received. Two kinds of amine-labeled Dextran (MW 3000, 1 average amine/per chain and MW 10 000, 2.5 average amines/per chain) were obtained from Molecular Probes, Inc. Concanavalin A (Con A) was purchased from Sigma. RC dialysis membrane (MWCO 8 000) was obtained from Spectrum Laboratories, Inc. Organic reactions were monitored by thin-layer chromatography on 0.25-mm Merck silica gel plates (60F-254), while Baxter silica gel 60Å (230–400 mesh ASTM) was used for flash column chromatography.
Synthesis of (2-mercapto-propionylamino) acetic acid 2,5-dioxo-pyrrolidin-1-ylester.
Condensation between tiopronin and N-hydroxysuccinimide occurred with 1,3-dicyclohexylcarbodiimide (DCC, 1.6 g, 8.0 mmol) as the condensation reagent.19 A mixture of tiopronin (1.12 g, 6.3 mmol), N-hydroxysuccinimide (0.73 g, 6.3 mmol), and DCC (1.6 g, 8.0 mmol) in 50 mL anhydrous THF was stirred at room temperature for 24 h. Removing the unsolvable solid by filtration, the solvent was removed under rotator evaporation. The residue was separated by chromatography on silica with CH2Cl2 / methanol (v/v = 10/1) as eluent. The product was 0.52 g and the yield was 32%. 1H NMR (CD3OD): 3.49 (m, 1H), 3.35 (s, 2H), 2.88 (s, 4H), 1.73 (d, 3H) ppm;13C NMR (CD3OD): 149.6, 141.7, 60.1, 42.2, 41.7, 32.2, 24.2 ppm. HRMS: calculated for: C9H12N2O5S: 260.0467; found: 260.0488.
Tiopronin-coated and Mixed Monolayer Silver Nanoparticles.
Tiopronin-coated silver nanoparticles (particle 1) were prepared using a modified Brust reaction11,20,21 with a mole ratio of tiopronin/silver nitrate = 1/1 in methanol. In a typical reaction, AgNO3 (0.68 g, 4.0 mmol) and tiopronin (0.65 g, 4.0 mmol) were codissolved in 50 mL methanol. NaBH4 (1.5 g, 40 mmol) in 20 mL of methanol was added dropwise with rapid stirring at 0 °C. The black suspension was stirred for an additional 1 h, then isolated on a Millipore porous filter (FHLC04700, 0.45 μm), washed with an excess amount of methanol, and dried in air. The particles were dissolved in water. The mixed monolayer nanoparticles (particle 2) were obtained by stirring a solution of particle 1 and thiolate active ester in methanol/water (v/v = 1/1) containing 1:5 mole ratios of thiolate active ester:tiopronin on particle 1 for 72 h at room temperature. The solvent was removed under vacuum and the residue was washed with methanol to remove uncapped thiolate compounds. The mixed monolayer compositions were assessed by 1H NMR spectra with mole ratio of double methylene on the succinimide/methyl on the tiopronin.10a
Coupling with Dextran (3000 and 10 000).
The particles 2 (20 mg, 4 × 10⁻⁵ mmol) were chemically bound to the Dextran 3000 (10 mg, 3.4 × 10⁻³ mmol) by stirring in 100 mL water for 24 h at room temperature. The mixture solution was concentrated to 20 mL under vacuum and dialyzed using a dialysis membrane (MWCO 8000) against water, to remove uncoupled Dextran. The particles 2 were bound to the Dextran 10 000 in a mole ratio of Dextran/particle 2 from 1/20–20/1. Dextran was not furthermore removed from particle–Dextran10 000 adducts solution for absorbance measurement or casting on the grid for electron micrographs (TEM) measurement.
Complexation with Con A and Dissolution by Competitive Complexation of Glucose.
The particle–Dextran 3000 adducts (particle 3, concentration = 1.5 × 10⁻⁶ M) were mixed with different concentrations of Con A (1.1 × 10⁻⁸−3.4 × 10⁻⁶M) to yield Con A/particle–Dextran complexes. The Con A/particle–Dextran 3000 complexes (particle concentration = 1.5 × 10⁻⁶ M) were dissociated by a competitive complexation of glucose in a range of concentration between 1.1 × 10⁻⁷−4.7 × 10⁻⁵ M. The particle–Dextran adducts, which were released in the glucose binding, were monitored by intensity and wavelength changes of plasmon absorbance.
Spectra.
1H NMR spectra were recorded on a GE-QE 300 spectrometer. Absorption spectra were monitored with a Hewlett-Packard 8453 spectrophotometer in a 1-cm cell. Transmission electron micrographs (TEM) were taken with a side-entry Philips electron microscope. Samples were cast from water solutions onto standard carbon-coated (200—300 Å) Formvar films on copper grids (200 mesh) by placing a droplet of a ca. 1 mg/mL aqueous sample solution on a grid, waiting 5 min, and removing excess solution by touching a small piece of filter paper to the edge of the grid. The grid was dried in air for 24 h.
Results and Discussion
Although both the tiopronin and silver nitrate are soluble in methanol, the final tiopronin-coated silver particles (particle1) were precipitated from methanol solution, and dissolved in water.20 Because of an excess amount of NaBH4 in the preparation, the particles 1 were expected to exist in the deprotonated form in water. When the solution was adjusted to pH = 3, the particles began to precipitate from water, indicating that the protonated particles had a poor solubility in water.
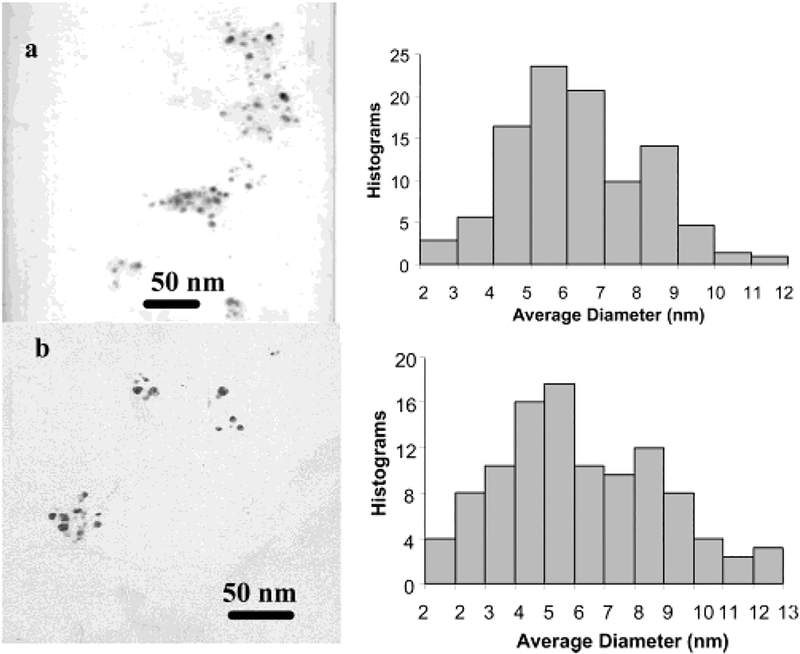
The particles 1 showed a poly-dispersion of size on TEM image (Figure 1a) and the average diameter was estimated to be 5 nm from the Histograms. Hence, the particles were determined to have an average composition of Ag1082(Tio)453 (molecular weight = 185 000) prior to ligand exchange.13 The succinimide-terminated particles (particle 2 in Scheme 1) were prepared by ligand exchanges to ensure that the functionalized ligands were displaced mildly onto the particle without a strong reduction of NaBH4 and the functionalized ligands were controlled in a small amount.10a The composition of mixed monolayer was determined by 1H NMR spectroscopy.11 It was shown that about 5% tiopronin ligands were replaced by the thiolate active esters, so that the particle 2 had an approximate composition of Ag1082(Tio)429(ester)24.
Figure 1.
Transmission electron micrographs (TEM) of (a) particle 1 and (b) particle 3 as well as their Histograms.
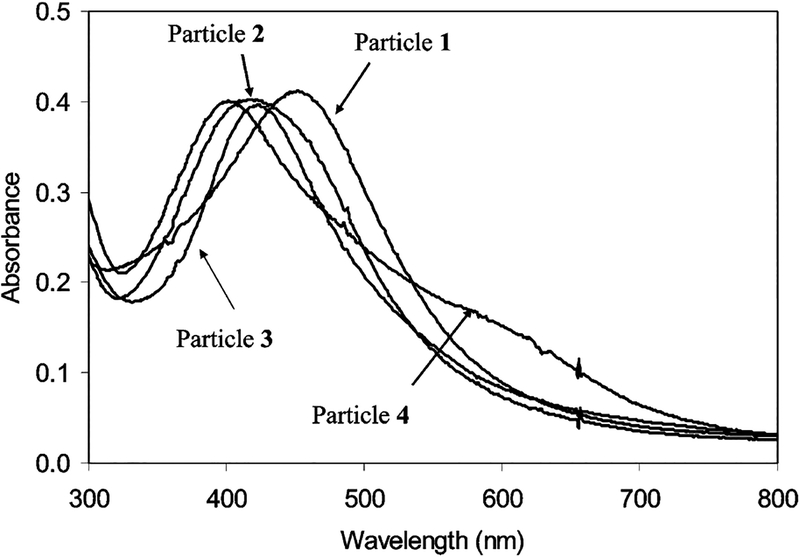
The particle 1 exhibited a plasmon maximum at 453 nm in water (Figure 3). After dialyzing with an RC dialysis membrane (MWCO 8000) against water, the particle had a blue-shifted plasmon absorbance at 410 nm, indicating that the particles 1 were aggregated slightly, which was ascribed to ionic interaction between the negatively charged surface of particles and salt cations in solution. No aggregate could be observed on the TEM image (Figure 1a), implying that the aggregation was weak. When the tiopronin ligands on the particles 1 were partially displaced by the thiolate active esters, the plasmon absorbance of particle 2 was shifted to 418 nm, suggesting that the plasmon absorbance was sensitive to the composition of the monolayer. The particle 2 displayed a TEM image analogous to the particle 1 with an average core size of 5 nm, showing that the ligand displacement did not change the core size.
Figure 3.
Absorbance spectra of particles 1, 2, 3, and 4 in water. The particle 4 had a mole ratio of Dextran 10 000/particle 2 = 1. Their absorbance maxima lie at 453, 418, 426, and 403 nm, respectively.
The terminal succinimides on particle 2 were chemically bound to the amine on Dextran derivatives to yield the particle–Dextran adduct. Because there were multiple active esters on the particle 2 and only one amine on each Dextran 3000 chain, one particle was expected to bind more than one Dextran 3000 chain (particle 3). In a typical binding reaction, the Dextran was on the particle three times relative to the succinimide to ensure that the most active esters on the particles were consumed to bind with Dextran. The particles 3 were individual without aggregation. The TEM image of particle 3 (Figure 1b), which had an average diameter of core was 5–6 nm as determined from the Histograms, verified this point. The particle 3 showed a red shift of plasmon absorbance to 426 nm (Figure 3), which was principally ascribed to the coupling of Dextran on the monolayer of the particle.
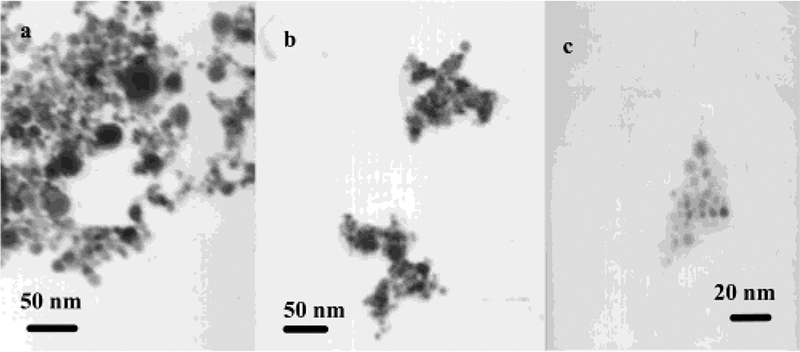
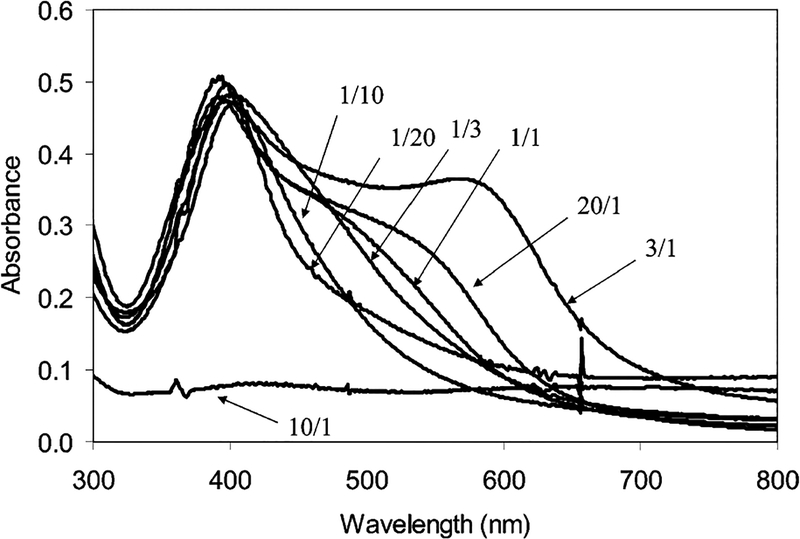
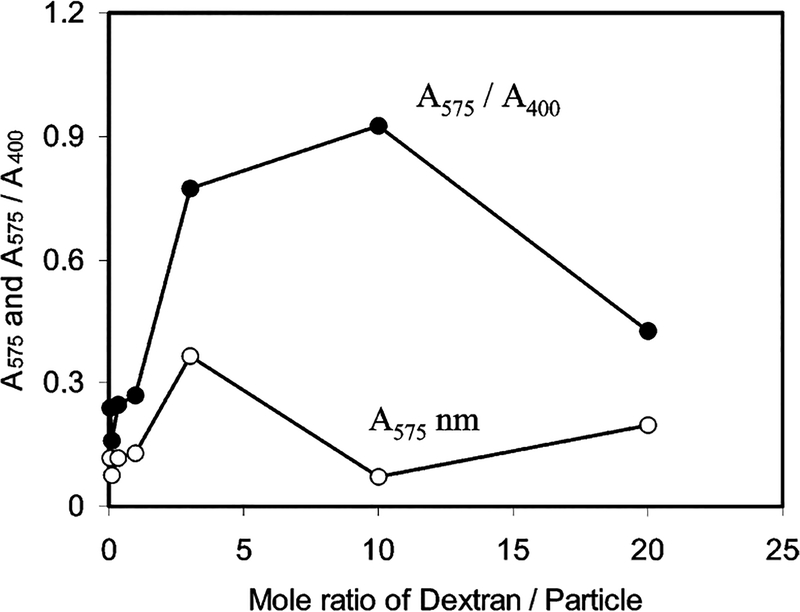
To investigate the interaction of the particle 2 and Dextran, the particles 2 were also bound to Dextran 10 000 (average 2.5 amines/each chain) as a controlling reference. Contrary to the particle 3, the particle–Dextran 10 000 adducts (particle 4) involved an obvious aggregation of particles, which could be outlined by a TEM image (Figure 2a). Meanwhile, the particle 4 displayed a blue shift of plasmon absorbance to 403 nm and a simultaneous rising at near 575 nm (Figure 4), verifying that the metallic particles were aggregated.12 If the absorbance at 403 nm was ascribed to transverse plasmon, the absorbance at 575 nm is subsequently ascribed to the longitudinal plasmon band. The aggregation was dependent on the mole ratio of Dextran 10 000/particle 2 (1/20—20/1) in solution. The absorbance of the longitudinal plasmon at 575 nm was enhanced with an increase of Dextran 10 000 until the mole ratio of Dextran 10 000/particle 2 = 3/1 (Figure 5). When the Dextran/particle mole ratio was 10/1, the succinimide/amine mole/ratio was estimated as about 1:1, and almost all aggregates were precipitated from solution with a negligible absorbance, suggesting that the aggregation was most efficient at this optimal ratio. Beyond that, the aggregate became water-soluble again. The decrease of longitudinal plasmon indicated that the aggregation was not so compact. The absorbance ratio of A575/A400 was plotted against the mole ratio of Dextran/particle 2 (Figure 5) and showed an analogous trend to the absorbance at 575 nm. The aggregation took 96 h to reach absorbance saturation, showing that it was a slow reaction. The steric hindrance took an important role in approaching, binding, and aggregation for the particles with the Dextran 10 000.
Figure 2.
Transmission electron micrographs (TEM) of (a) aggregation of particles by Dextran 10 000, (b) aggregation of particles 3 by Con A, and (c) dissociation of (b) by a competitive complexation of glucose.
Figure 4.
Dependence of the absorbance spectra of particle-Dextran 10 000 on the mole ratio of Dextran 10 000/particle 2 in water: (a) 1/20, (b) 1/10, (c) 1/3, (d) 1/1, (e) 3/1, (f) 10/1, and (g) 20/1.
Figure 5.
Plots of the absorbance at 575 nm (○) and absorbance ratio of A575/A400 (●) against the mole ratio of Dextran 10 000/particle 2 in water.
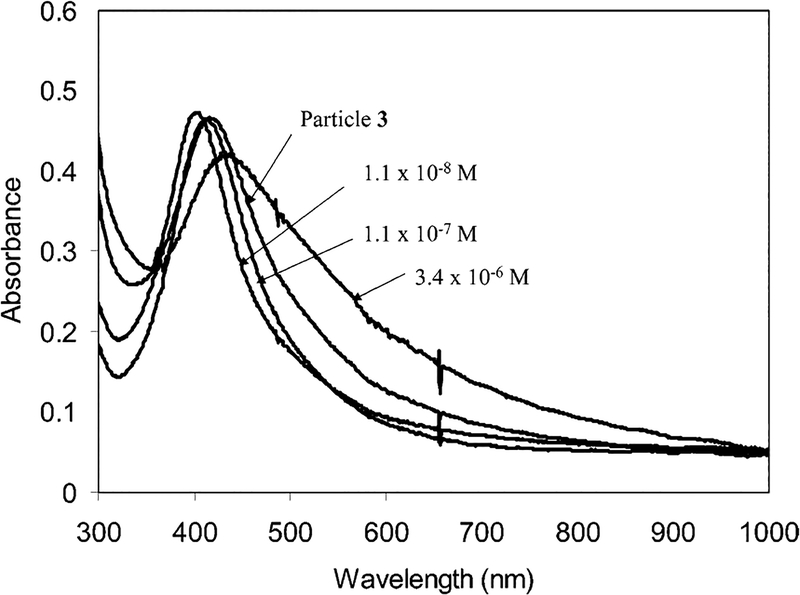
The particles 3 were not able to self-aggregate because of the single amine on each Dextran 3000 chain. They were coupled to the Con A by complexation, which led to their aggregation. At a mole ratio of particle/Con A = 0.5, the aggregates could be outlined clearly by TEM image (Figure 2b), indicating that the Con A was an efficient aggregation reagent. The aggregation depended on the mole ratio of particle/Con A in solution, which could be verified by the absorbance spectral change (Figure 6). At a low Con A concentration (particle = 1.5 × 10⁻⁶ M, Con A = 1.1 × 10⁻⁸ M, mole ratio of particle/Con A = 1.4 × 10²), the plasmon absorbance was blue shifted to 406 nm. With an increase of Con A concentration (Con A = 1.1 × 10⁻⁷ M, mole ratio of particle/Con A = 14), the wavelength began to red shift and return to a wavelength close to that of the particle 3. The wavelength was red shifted to 436 nm at a higher Con A concentration (3.4 × 10⁻⁶ M, mole ratio of particle/Con A = 0.5). The plasmon shift could be ascribed to the different aggregation states of particle 3 with Con A. At low Con A concentrations (mole ratio of particle/Con A = 1.4 × 10²), the particles 3 were coupled compactly on the Con A and the distance between the particles was shorter than their average diameter.12 An excess amount of particles also prevented crosslinking between the particle 3 and Con A. With an increase in Con A concentration, the particles became looser when binding on the Con A, and the absorbance wavelength of the complex was close to that of the particle 3 at the mole ratio of particle/Con A = 14. Further increasing the Con A concentration (mole ratio of particle/Con A = 0.5) led to an excess of Con A in solution, so that the particles were bound separately on the Con A, leading to a red shifting of plasmon wavelength. The multiple Dextran chains on each particle made it appropriate as a crosslinking reagent to interact with more than one Con A, which was verified by the broadened absorbance (Figure 6). The larger aggregated particles displayed a poor solubility in water, and became completely insoluble at mole ratio of 0.3 or higher, and the absorbance approached 0. The aggregation of particle 3 by Con A occurred much more quickly than the self-aggregation of the particle–Dextran 10 000, due to less steric hindrance for the coupling of particle 3 on the Con A. The less steric hindrance also involved a less compact packing, which resulted in a smaller longitudinal plasmon absorbance at 575 nm.
Figure 6.
Absorbance spectra of the Con A/particle 3 complex at various Con A concentration in water.
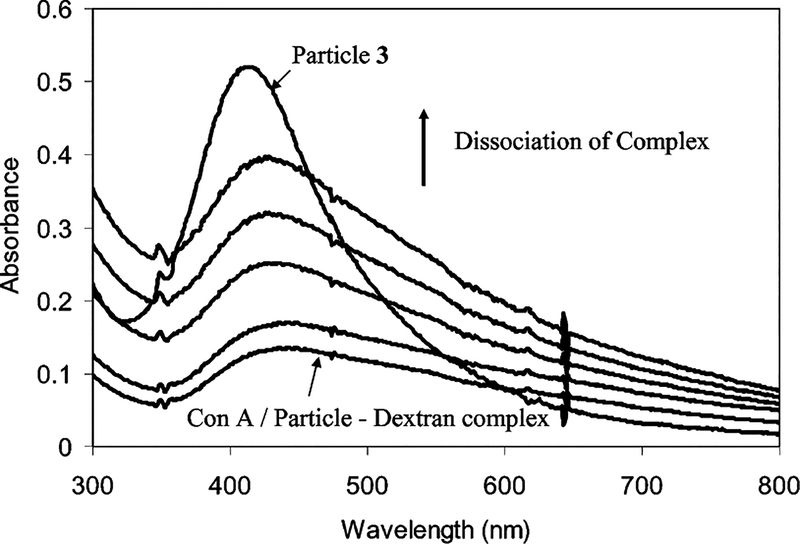
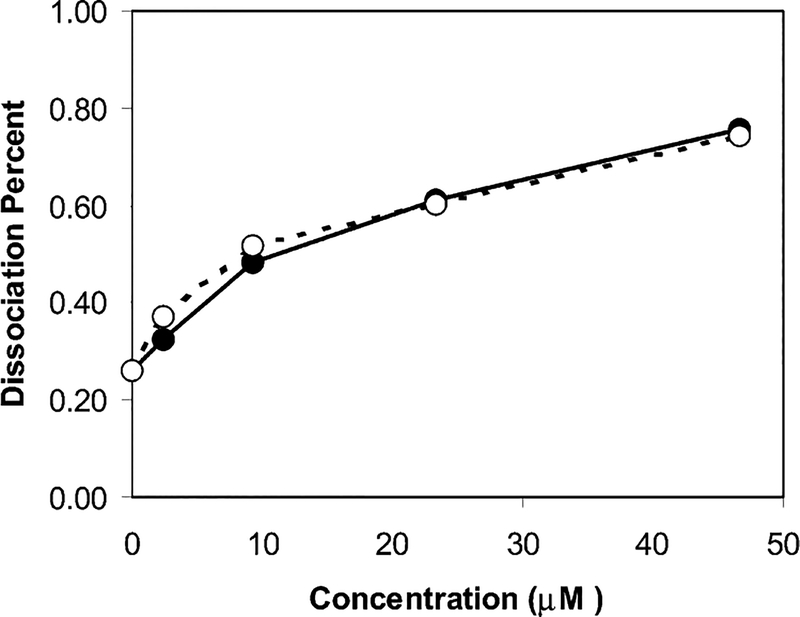
The Con A/particle–Dextran complexes were sensitive to a competitive complexation by glucose when the glucose was added in solution to form Con A/glucose complexes. The complexes were dissociated to release and the particle–Dextran adducts. When the complex sample had a mole ratio of particle/Con A = 0.3, the released particle–Dextran adduct became redissolved in water to cause an obvious absorbance spectral change with the glucose concentration. As a result, the plasmon absorbance was enhanced and the wavelength was shifted back to that of particles 3 with increasing the glucose concentration (Figure 7). The dissociation could also be verified by TEM image (Figure 2c), on which the larger aggregates were dissociated into small particles. If the absorbance and wavelength of particles 3 (Figure 6) were used as references, the dissociation percent could be estimated from the absorbance enhancement and wavelength shift, respectively, and plotted against the glucose concentration (Figure 8). Two series of data were very close, indicating the calculation was plausible. Because all succinimides on the particle were expected to bind to Dextran, the concentration of Dextran 3000 was estimated to be 4.1 × 10⁻⁵ M when the concentration of particle 3 was 1.5 × 10⁻⁶ M in solution. Each Dextran 3000 was composed of an average 18 carbohydrate units, so the carbohydrate concentration was 7.4 × 10⁻⁴ M. The Con A/particle—Dextran complexes were observed to dissociate when the glucose concentration was 4.7 × 10⁻⁵ M, indicating that the binding affinity of glucose with the Con A was 17 times higher than that of Dextran 3000 on the particle 3.
Figure 7.
Recovery of absorbance spectra of the particle 3 released by dissociation from the Con A/particle–Dextran complex at various concentrations of glucose in water.
Figure 8.
Plots of the dissociation percent of the Con A/particle–Dextran complex obtained from the plasmon absorbance intensity (●) and wavelength (○) against the glucose concentration.
However, the Con A/particle–Dextran complexes could not be dissociated completely by the competitive glucoses displacement to the particle–Dextran adducts. Even if the concentration of glucose was higher than 4.7 × 10⁻⁵ M, the absorbance could change only slightly. This was due to irreversible interactions between the Con A and particle–Dextran complexes. Although most of the succinimides on the particles 2 were believed to bind to the amines on Dextran, there was still a small quantity of the succinimide left without binding, which expected to bind to the amines on the Con A to cause irreversible interactions between the particles and Con A. The absorbance intensity and wavelength could be recovered to 80% relative to the original values (Figure 8), indicating that 20% of Con A/particle–Dextran complexes were influenced by such direct bindings. The absorbance band of the released particle–Dextran became broader relative the particle–Dextran complex, also showing that some particles might not be released completely from the aggregates. The authors herein hope to provide a novel approach to detect and subsequently monitor glucose concentrations. However, much work remains to be done before this approach can be employed in actual sensors. The concentration of glucose in the experiment was below the physiological level (mM in blood), so the competitive complexation approach can be used in the carbohydrate detection.
Summary
Tiopronin and N-hydroxysuccinimide were condensed with 1,3-dicyclohexylcarbodiimide (DCC) as a condensation reagent to yield thiolate active ester. Tiopronin-coated silver nanoparticles (particle 1) were prepared using a modified Brust reaction with a 1:1 mole ratio of tiopronin/AgNO3, which had an average core diameter = 5 nm. Tiopronin ligands on the particle 1 were partially displaced by thiolate active esters to prepare the succinimide-labeled particles (particle 2). Particles 2 were bound to Dextran 3000 (1 amine/per chain) and 10 000 (2.5 amine/per chain), respectively. Particle–Dextran 3000 adducts (particle 3) were not aggregated because of one amine on each Dextran chain, and the plasmon absorbance was shifted from 418 to 426 nm. Because of multiple amines on each chain, the particle–Dextran 10 000 adducts were aggregated, and the aggregates displayed a transverse plasmon at 403 nm and a longitudinal plasmon at 575 nm, verifying that the particles were aggregated compactly. The aggregation of particle and Dextran 10 000 depended on the mole ratio of Dextran/particle, with the optimal mole ratio being 10/1 (mole ratio of succinimide/amine = 1/1). The aggregation was a slow reaction because of steric hindrance. Particles 3 could be aggregated by the Con A, and the aggregation was dependent on the mole ratio of Con A/particle. At a high mole ratio of Con A/particle, the highly crosslinked aggregates were precipitated from water. The Dextran on the aggregates could be replaced competitively by the glucose to release the particle 3. The dissociation of the aggregates, determined by changes in optical density and wavelength, dependence on the glucose concentration. Further studies by our laboratory are underway.
Acknowledgment.
This research was supported by a grant from NIH, NCRR, RR-08119.
References and Notes
- (1).(a) James TD; Sandanayake KRAS; Shinkai S Nature 1995, 374, 345. [Google Scholar]; (b) Pickup JC; Thevenot DR In Advances in Biosensors, supplement 1; jAi Press: London, 1993, 273–288. [Google Scholar]; (c) Rolinski OJ; Birch DJS; McCartney LJ; Pickup JC In Proceedings of Advances in Fluorescence Sensing Technology IV; Lakowicz JR, Soper S, Thompson RB, Eds.; SPIE: San Jose, CA, 1999; pp 6–14. [Google Scholar]
- (2).(a) Frontiers in Biosensorics I. Fundamental Aspects; Scheller FW, Schubert F, Fedrowitz J, Eds.; Birkhauser Verlag: Berlin, 1997. [DOI] [PubMed] [Google Scholar]; (b) Frontiers in Biosensorics II. Practical Applications; Scheller FW, Schubert F, Fedrowitz J, Eds.; Birkhauser Verlag: Berlin, 1997. [Google Scholar]
- (3).(a) de Silva AP; Gunaratne HQN; Gunnhaugson T; Huxley AJM; McCoy CP; Rademacher JT; Rice TE Chem. Rev 1997, 97, 1515. [DOI] [PubMed] [Google Scholar]; (b) Marvin JS; Hellinga HW J. Am. Chem. Soc 1998, 120, 7. [Google Scholar]
- (4).Berroca l M. J.; Johnson RD; Badr IHA; Liu MD; Gao DY; Bachas LG Anal. Chem 2002, 74, 3644. [DOI] [PubMed] [Google Scholar]; (b) Tiessen RG; Rhemrev-Boom MM; Korf J Life Sci 2002, 70, 2457. [DOI] [PubMed] [Google Scholar]; (c) McCartney LJ; Pickup JC; Rolinski OJ; Birch DJ S. Anal. Biochem 2001, 292, 216. [DOI] [PubMed] [Google Scholar]
- (5).(a) Cao H; Diaz DI; DiCesare N; Lakowicz JR; Heagy MD Org. Lett 2002, 4, 1503. [DOI] [PMC free article] [PubMed] [Google Scholar]; (b) Meadows DL; Schultz JS Anal. Chim. Acta 1993, 280, 21. [Google Scholar]; (c) Ballerstadt R; Schultz JS Anal. Chim. Acta 1997, 345, 203. [Google Scholar]
- (6).Lakowicz JR; Emerging biomedical application of time-resolved florescence spectroscopy, in Topic in Fluorescence spectroscopy In Probe Design and Chemical Sensing.; Lakowicz JR, Ed.; Plenum Press: New York, 1994; Vol. 4, pp 1–9. [Google Scholar]
- (7).(a) Lakowicz JR; Maliwal BP Anal. Chim Acta 1993, 271, 155. [Google Scholar]; (b) Tolosa L; Szmacinski H; Rao G; Lakowicz JR Anal. Biochem 1997, 250, 102. [DOI] [PMC free article] [PubMed] [Google Scholar]; (c) Ye K; Schultz JS Anal. Chem 2003, 75, 3119. [DOI] [PubMed] [Google Scholar]
- (8).(a) Hayat MA, Ed. Colloidal Gold: Principles, Methods, and Applications; Academic Press: San Diego, 1991. [Google Scholar]; (b) Laser Spectroscopy and Photochemistry on Metal Surfaces; Dai HL, Ho W, Eds.; World Scientific: Singapore, 1995; Parts I and II. [Google Scholar]
- (9).(a) Allara D Characterization of Organic Thin Films; Ulman A, Ed.; Butterworth-Heinemann: Boston, 1995; Chapter 4. [Google Scholar]; (b) Ulman A Ultrathin Organic Films; Academic Press: San Diego, 1991. [Google Scholar]; (c) Ulman A Chem. Rev 1996, 96, 1533. [DOI] [PubMed] [Google Scholar]
- (10).(a) Ingram RS; Hostetler MJ; Murray RW J. Am. Chem. Soc 1997, 119, 9175. [Google Scholar]; (b) Templeton AC; Hostetler MJ; Kraft CT; Murray RW J. Am. Chem. Soc 1998, 120, 1906. [Google Scholar]; (c) Hostetler MJ; Templeton AC; Murray RW Langmuir 1999, 15, 3782. [Google Scholar]; (d) Hostetler MJ; Green SJ; Stokes JJ; Murray RW J. Am. Chem. Soc 1996, 118, 4212. [Google Scholar]
- (11).Templeton AC; Wuelfing WP; Murray RW Acc. Chem. Res 2000, 33, 27. [DOI] [PubMed] [Google Scholar]
- (12).(a) Esumi K; Matsushima Y; Torigoe K Langmuir 1995, 11, 3285. [Google Scholar]; (b) Link S; Mohamed MB; El-Sayed MA J. Phys. Chem. B 1999, 103, 3073. [Google Scholar]
- (13).Hostetler MJ; Wingate JE; Zhong C-J; Harris JE; Vachet RW; Clark MR; Londono JD; Green SJ; Stokes JJ; Wignall GD; Glish GL; Porter MD; Evans ND; Murray RW Langmuir 1998, 14, 17–30. [Google Scholar]
- (14).(a) Zhang J; Whitesell JK; Fox MA Chem. Mater 2001, 13, 2323. [Google Scholar]; (b) Hu J; Zhang J; Liu F; Kittredge K; Whitesell JK; Fox MA J. Am. Chem. Soc 2001, 123, 1464. [Google Scholar]
- (15).Aguila A; Murray RW Langmuir 2000, 16, 5949. [Google Scholar]; (b) Stellacci F; Bauer CA; Meyer-Friedrichsen T; Wenseleers W; Marder SR; Perry JW J. Am. Chem. Soc 2003, 125, 328. [DOI] [PubMed] [Google Scholar]; (c) Gu T; Whitesell JK; Fox MA Chem. Mater 2003, 15, 1358. [Google Scholar]
- (16).Kamat PV J. Phys. Chem. B 2002, 106, 7729 and references therein. [Google Scholar]
- (17).(a) Huang T; Murray RW J. Phys. Chem. B 2001, 105, 12498. [Google Scholar]; (b) Huang T; Murray RW Langmuir 2002, 18, 7077. [Google Scholar]
- (18).Huang X; Catignani GL; Swaisgood HE J. Agric. Food Chem 1995, 43, 895. [Google Scholar]
- (19).(a) Oya M; Hideo M; Iwao J-I; Funae Y Chem. Pharm. Bull 1981, 29, 63. [DOI] [PubMed] [Google Scholar]; (b) Roger J; Eric B Bull. Soc. Chim. Fr 2 1982, 11–12, 391. [Google Scholar]
- (20).Brust M; Walker M; Bethell D; Schiffrin DJ; Whyman RJ Chem. Soc., Chem. Commun 1994, 801. [Google Scholar]
- (21).Huang T; Murray RW J. Phys. Chem. B 2003, 107, 7434. [Google Scholar]


