

Down syndrome cell adhesion molecules (dscam and dscaml1) are essential regulators of neural circuit assembly, but their roles in vertebrate neural circuit function are still mostly unexplored. We investigated the functional consequences of dscaml1 deficiency in the larval zebrafish (sexually undifferentiated) oculomotor system, where behavior, circuit function, and neuronal activity can be precisely quantified.
Keywords: development, Dscaml1, eye movement, retina, saccade, zebrafish
Abstract
Down syndrome cell adhesion molecules (dscam and dscaml1) are essential regulators of neural circuit assembly, but their roles in vertebrate neural circuit function are still mostly unexplored. We investigated the functional consequences of dscaml1 deficiency in the larval zebrafish (sexually undifferentiated) oculomotor system, where behavior, circuit function, and neuronal activity can be precisely quantified. Genetic perturbation of dscaml1 resulted in deficits in retinal patterning and light adaptation, consistent with its known roles in mammals. Oculomotor analyses revealed specific deficits related to the dscaml1 mutation, including severe fatigue during gaze stabilization, reduced saccade amplitude and velocity in the light, greater disconjugacy, and impaired fixation. Two-photon calcium imaging of abducens neurons in control and dscaml1 mutant animals confirmed deficits in saccade-command signals (indicative of an impairment in the saccadic premotor pathway), whereas abducens activation by the pretectum-vestibular pathway was not affected. Together, we show that loss of dscaml1 resulted in impairments in specific oculomotor circuits, providing a new animal model to investigate the development of oculomotor premotor pathways and their associated human ocular disorders.
SIGNIFICANCE STATEMENT Dscaml1 is a neural developmental gene with unknown behavioral significance. Using the zebrafish model, this study shows that dscaml1 mutants have a host of oculomotor (eye movement) deficits. Notably, the oculomotor phenotypes in dscaml1 mutants are reminiscent of human ocular motor apraxia, a neurodevelopmental disorder characterized by reduced saccade amplitude and gaze stabilization deficits. Population-level recording of neuronal activity further revealed potential subcircuit-specific requirements for dscaml1 during oculomotor behavior. These findings underscore the importance of dscaml1 in the development of visuomotor function and characterize a new model to investigate potential circuit deficits underlying human oculomotor disorders.
Introduction
The Down syndrome cell adhesion molecule (DSCAM) family proteins are essential for neural circuit assembly and patterning. In humans, loss of DSCAM and DSCAM-like 1 (DSCAML1) is linked to autism spectrum disorder and cortical abnormalities (Iossifov et al., 2014; Karaca et al., 2015). At the cellular level, DSCAMs promote avoidance between neurites of the same cell or between similar cell types. DSCAMs are also involved in the regulation of cell death, synaptic adhesion, and neuronal morphogenesis (Yamagata and Sanes, 2008; Blank et al., 2011; Maynard and Stein, 2012; Zhang et al., 2015; Bruce et al., 2017). However, it remains unclear how the sum of these cellular functions contributes to neural circuit activity, behavior, and human disorders.
Here, we investigate DSCAML1 in the context of oculomotor behavior. Eye movement is an integral part of visual perception in vertebrates, enabling shifts in visual attention and preventing image blurring during motion (Leigh and Zee, 2015). We focus on saccade, fixation, and gaze stabilization movements, which are highly conserved among vertebrates. Saccades are fast eye movements that allow rapid gaze shifting and redirection of visual attention. After each saccade, gaze is maintained at a single location in a process termed fixation. Saccades also occur reflexively during gaze stabilization, for example, the optokinetic reflex (OKR) and vestibular ocular reflex (VOR). OKR is triggered by broad-field visual motion, during which the eyes counteract motion by velocity-matched eye movements. The periods of velocity matching, called “slow phase,” are interrupted by “fast phase” saccadic movements to the opposite direction, which reset eye position. Slow and fast phases are also triggered by the vestibular system in the VOR to counteract head motion.
In the oculomotor system, the neural circuitry is mapped in detail, and changes to eye movement kinematics can be attributed to specific subcircuit deficits (Büttner and Büttner-Ennever, 2006; Leigh and Zee, 2015). Sensory inputs and motor commands converge onto the brainstem, where premotor neurons generate motor signals encoding eye position and velocity. The premotor pathways, in turn, activate the motor neurons that innervate the extraocular muscles (see Fig. 1A). Three subcircuits are the focus of this study. The saccadic premotor pathway, which goes through the excitatory burst neurons in the midbrain and hindbrain, initiates saccade and encodes the appropriate eye velocity. The vestibular premotor pathway, which receives input from the eye and ear, controls slower eye movement and velocity matching during gaze stabilization. Last, the neural integrator premotor pathway integrates information from the saccade and vestibular pathways to maintain stable eye position over time. Deficits in these subcircuits are associated with human diseases, such as ocular motor apraxia (saccade deficit), OKR abnormalities (vestibular deficit), and gaze-evoked nystagmus (neural integrator deficit) (Leigh and Zee, 2015). Saccade deficits are also prevalent in neuropsychiatric and neurodegenerative patient populations, serving as a window into the underlying pathophysiology (Anderson and MacAskill, 2013; Bittencourt et al., 2013). However, our understanding of the genetic contributors for oculomotor circuit development and eye movement disorders is still limited.
Figure 1.
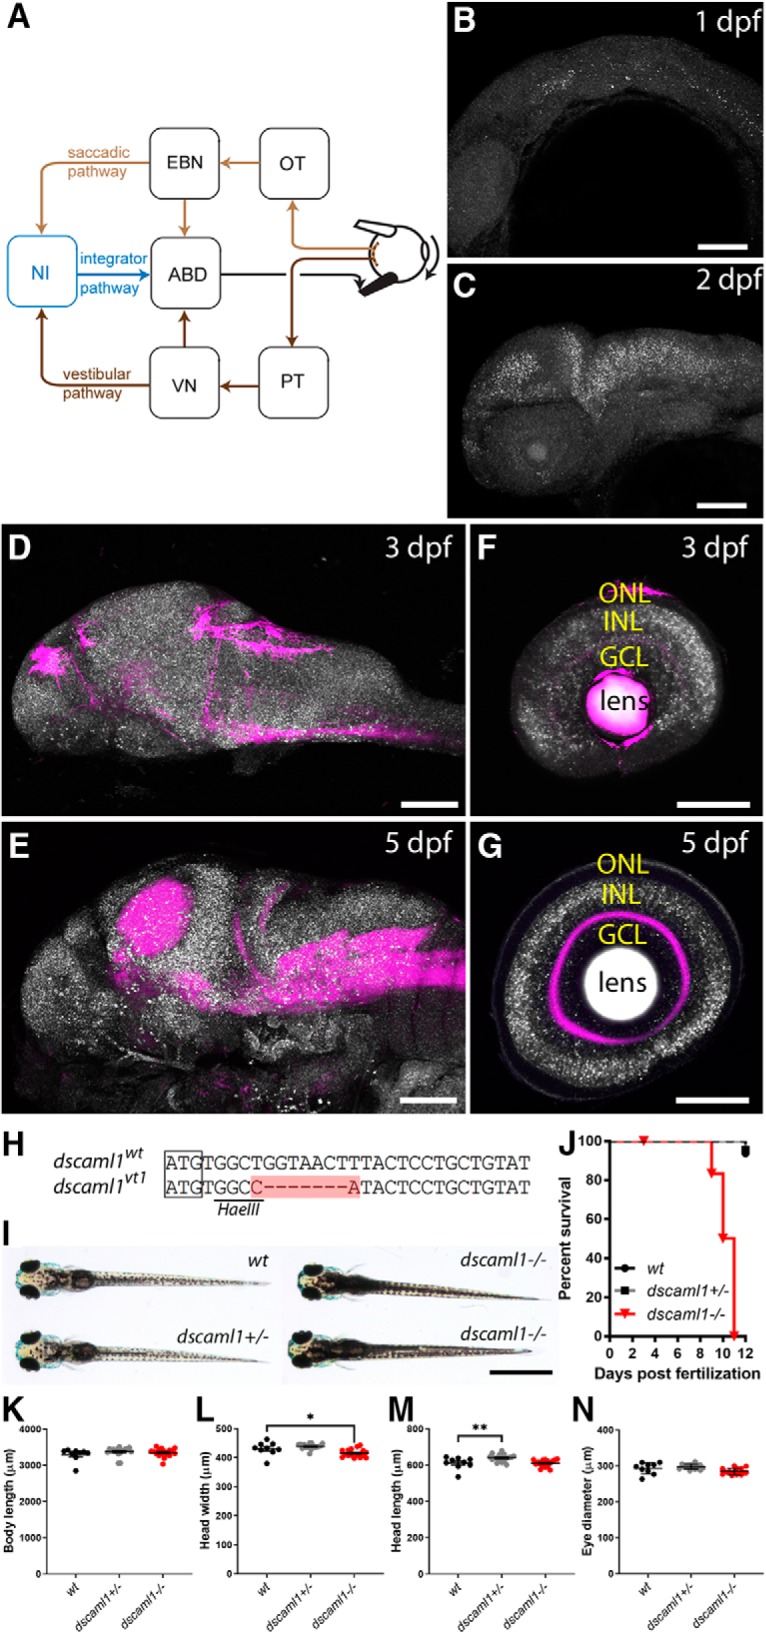
The oculomotor circuit, and the expression and gene targeting of dscaml1. A, Diagram of the oculomotor circuit for horizontal eye movement. Visual motion activates directional selective retinal ganglion cells, which innervate the optic tectum (OT) and pretectum (PT). PT provides input to the vestibular nucleus (VN). OT (along with other areas) activates the excitatory burst neurons (EBN). EBN and VN provide premotor input to the abducens nucleus (ABD), which innervates the extraocular muscles. EBN and VN also innervate the velocity-position neural integrator (NI), which provides an eye position signal to the ABD. The saccadic, vestibular, and integrator pathways are labeled light brown, dark brown, and blue, respectively. B–G, dscaml1 mRNA (white) labeled by FISH, with neuropil counterstained with anti-Syt2 antibody (magenta). Developmental staging as indicated. H, Alignment of WT and TALEN targeted dscaml1 genomic sequence. The start codon is boxed, and the region containing insertions and deletions is highlighted in red. I, Pigmentation pattern of different genotypes. dscaml1 mutant animals show darker overall pigmentation. J, Survival curve, sorted by genotype. K–N, Measurements of body length (K), head width (L), head length (M), and eye diameter (N) of 5 dpf larvae. GCL, Ganglion cell layer; INL, inner nuclear layer; ONL, outer nuclear layer. Scale bars: B–G, 100 μm; I, 1 mm. *p < 0.05, **p < 0.01.
We take advantage of the zebrafish oculomotor system as a framework to probe the developmental requirements of dscaml1, the zebrafish homolog of DSCAML1 (Galicia et al., 2018). Zebrafish oculomotor behavior is robust at the larval stage; the small size and optical translucency of zebrafish larvae make it possible to use two-photon calcium imaging to record neuronal activity en masse while the animal is behaving (Kubo et al., 2014; Daie et al., 2015; Kawashima et al., 2016). Additionally, the fish oculomotor system is well characterized and conserved with that of mammals (Straka et al., 2006; Masseck and Hoffmann, 2009). We found that genetic deletion of zebrafish dscaml1 affected retinal patterning, light adaptation, and oculomotor behaviors. For horizontal eye movements, the saccade and integrator subcircuits are affected in dscaml1 mutants. The mutant phenotype resembles congenital ocular motor apraxia (COMA) (OMIM 257550) and provides insight into the potential developmental deficits contributing to oculomotor disorders (Zee et al., 1977; Harris et al., 1996).
Materials and Methods
Zebrafish husbandry
Zebrafish (all ages) were raised under 14 h light/10 h dark cycle at 28.5°C. Embryos and larvae were raised in water containing 0.1% Methylene Blue hydrate (Sigma-Aldrich). At 24 h post-fertilization, embryos used for histological analyses were transferred to E3 buffer containing 0.003% 1-phenyl-2-thiourea (Sigma-Aldrich) to prevent pigment formation. Developmental stages are as described by Kimmel et al. (1995). Sex is not a relevant variable for this study, as laboratory zebrafish have a polygenic sex-determination system and remain sexually undifferentiated until 2 weeks of age, beyond the stages being used (0–7 d post fertilization [dpf]) (Maack and Segner, 2003; Wilson et al., 2014). All experimental procedures are performed in accordance with Institutional Animal Care and Use Committee guidelines at Augusta University, Virginia Tech, and Weill Cornell Medicine.
Mutant and transgenic zebrafish lines
dscaml1 (ZFIN gene name: Down syndrome cell adhesion molecule like 1) mutant was generated in TL/AB mixed background using TAL effector nucleases (TALENs) as previously described (Sander et al., 2011; Reyon et al., 2012). Two alleles were identified: one harbored a 6 bp insertion (in frame) and the other harbored a 7 bp deletion (frame shift). The 7 base deletion mutant (dscaml1vt1) was used for further analysis. The dscaml1vt1 allele generates an HaeIII (New England Biolabs) restriction site, which was used to distinguish between WT and dscaml1vt1 alleles. DNA prep and PCR were performed as described previously (Pan et al., 2013), followed by HaeIII digestion for 2 h at 37°C (primer sequences: aaatactgcacggtgcacacgtc and atgcagatcctacagcctcataatc). After HaeIII digestion, WT band was 395 bp (uncut), whereas mutant bands were 315 and 75 bp. Sequencing of dscaml1 transcript confirmed the incorporation of the 7 base deletion into the open reading frame. Tg(atoh7:GAP-RFP) animals were provided by Owen Randlett (Harvard University, Cambridge, MA) (Zolessi et al., 2006). Tg(elavl3:H2B-GCaMP6f) and casper (nac−/−;roy−/−) animals were provided by Misha Ahrens (HHMI Janelia Farm Research Campus, Ashburn, VA) (Vladimirov et al., 2014).
Larvae size measurements
Bright-field images of 5 dpf larvae were measured using the linear measurement tool in Fiji (Schindelin et al., 2012). Head width was measured between the left and right posterior edges of the eye sockets. Head length was measured from the tip of the nose to the line connecting the left and right ear. Body length was measured from the tip of the nose to the end of the tail fin.
Image acquisition and processing
Imaging procedures were as previously described (Pan et al., 2012). Fluorescent images were acquired using an Olympus FV1000 laser-scanning confocal system with a 20× XLUMPlanFl water-immersion objective or a Nikon A1 laser scanning confocal system with a CFI75 Apochromat LWD 25× water-immersion objective. Larvae were immobilized with 0.01% tricaine methanesulfonate (MS-222, Sigma-Aldrich), embedded in molten 1.5% low-melt agarose (Thermo Fisher Scientific) in a glass-bottom Petri dish (P50G-1.5–14-F, MatTek). Fish were mounted so that the surface to be imaged was facing the glass bottom.
Images were processed with Fiji (Schindelin et al., 2012) and Photoshop (Adobe Systems) software. To measure the extent of serotonergic amacrine cell aggregation, we acquired confocal stacks and determined the center of mass for each serotonin (5-HT)-positive cell in (x, y, z) coordinates. Intercellular distance between two cells was calculated by the distance formula: d = . For each cell, intercellular distances to all other cells in the same retina were calculated. Cells with neighboring cells within 3 cell diameter (≤10 μm) were categorized as aggregated. For each eye, the number of aggregating cells was divided by the total number of cells to calculate the aggregation ratio.
Quantification of the distribution of PKCα immunolabeling was performed as described by Nevin et al. (2008). Using Fiji, a rectangle was drawn across a relatively flat section of the inner plexiform layer (IPL) so that the top and bottom of the rectangle abut the boundaries of the IPL, as defined by SV2 immunolabeling. Next, the Plot Profile function was used to measure the average fluorescence intensity across the thickness of the IPL. After exporting numerical data to Excel (Microsoft), data were normalized to maximal fluorescence intensity and relative position within the IPL. The number of serotonergic neurons was estimated by manually counting 5HT+ cells from 7 optical sections (10 μm apart, at horizontal levels adjacent to the lens) in each fish.
For 3D rendering of retinal afferents, Tg(atoh7:GAP-RFP) transgenic fish were fixed with 4% PFA and mounted laterally. The eye on the imaged side was removed to allow visualization of the optic tract; 3D rendering was created using NIS-Elements software (Nikon).
FISH and immunohistochemistry
The dscaml1 probe was generated by 5′RACE (Smart RACE cDNA Amplification Kit, Clontech) using 3′ primers designed from Ensembl exon predictions. Amplified DNA was cloned into the pCRII-TOPO vector by TA cloning (Invitrogen). Probe sequence includes 127 bp of 5′ untranslated region and 545 bp of coding sequence. DIG-labeled dscaml1 probe synthesis and whole-mount ISH were performed as previously described (Pan et al., 2012). For 3 and 5 dpf samples, dextran sulfate (Sigma-Aldrich) and 4-iodophenol (Fluka) were added to the hybridization and tyramide solution to increase signal intensity (Lauter et al., 2011). Whole-mount immunohistochemistry was performed as described by Randlett et al. (2015). Primary antibodies used were as follows: anti-Syt2 (anti-synaptotagmin 2/znp-1, Developmental Studies Hybridoma Bank), anti-acetylated-tubulin (Sigma-Aldrich), anti-SV2 (Developmental Studies Hybridoma Bank), anti-HuC/D (Invitrogen), anti-HNK-1 (zn-12, Developmental Studies Hybridoma Bank), anti-5-HT (Sigma-Aldrich), anti-PKCα (Santa Cruz Biotechnologies), zpr-1 (Zebrafish International Resource Center), and anti-Blbp (Abcam). AlexaFluor-conjugated secondary antibodies were used after primary antibody incubation.
Locomotor assay
Individual 5 dpf larvae were placed into each well of a 24-well tissue culture plate (Thermo Fisher Scientific) and transferred into a Zebrabox imaging chamber (Viewpoint). Locomotor activity of each larva was tracked over 24 h, with white LED illumination turned off at 10:00 P.M. and on at 8:00 A.M. Total displacement over time was integrated every 10 min, measured as previously described (Farrell et al., 2011).
Oculomotor assays
Equipment and eye-position recording.
(1) VisioTracker 302060 (New Behavior TSE) was used for short- and long-periodicity OKR (5 Hz video sampling rate) behavioral analysis. Eye position was extracted using VisioTracker's proprietary software (Mueller et al., 2011). (2) Spontaneous saccades in the light and the dark were tested using a custom-built behavioral recording system. Eye movements of individual fish were recorded by an overhead CCD camera (Pike F-032B) (25 Hz sampling rate), with visual stimulation projected from below by an LED ring light (AmScope LED-144W-ZK) onto a circular arena (height: 5 cm; diameter: 7.5 cm). Eye positions were extracted with the OKRtrack software (Scheetz et al., 2018).
Mounting and stimulus conditions.
Zebrafish larvae were placed in the center of a 50 mm glass-bottom Petri dish (MatTek) and immobilized in 1.5%–2% low melting agarose (Thermo Fisher Scientific) in E3 buffer. Agarose around the eye was removed to allow free eye movement. The dish was then filled with E3. To test OKR slow-phase performance under short periodicity, the direction of black and white grating switched every 3 s with grating velocity at 7.5°/s. Each experimental run (trial) was 108 s long and included 12 9 s phases at varying contrast levels (0.99, 1.0, 0.5, 0.2, 0.1, 0.05, 0.02, 0.05, 0.1, 0.2, 0.5, and 1.0). For each animal, 5 or 6 trials were tested, and OKR response typically initiated during the first three trials (initiation trials). Contrast sensitivity was calculated using trials recorded after the initiation trials. OKR performance under long periodicity was tested using a trial that contains four phases: (1) uniform illumination (1–160 s); (2) square wave grating with direction switching every 40 s, contrast = 1, spatial frequency = 0.05 cycles/°, and velocity = 10°/s (161–400 s); (3) uniform illumination (401–480 s); and (4) square wave grating with direction switching every 8 s, contrast = 1, spatial frequency = 0.05 cycles/°, and velocity = 10°/s (481–560 s). Spontaneous saccades were tested in two phases: (1) uniform illumination (660 s) and (2) dark (660 s). During the dark phase, the only light source in the room was the 750 nm IR LEDs for video recording.
Analysis of OKR eye movements.
Eye velocity was calculated as the difference in eye position (smoothed with a 1 s median filter, MATLAB medfilt1) divided by the sample period. A fast-phase event (saccade) was defined as a sample period where the absolute eye velocity is >50°/s. Slow-phase eye velocity was measured as the mean velocity averaged across time within 1 s bins. We excluded sample periods that fell between 0.5 s before and 2 s after each saccade to remove the effects of saccades on slow-phase velocity. Additionally, to exclude the effect of response latency and the initial ramping up of eye velocity at stimulus onset (Sklavos et al., 2006), the first 1 s of each 3 s half period was excluded from analysis (Rinner et al., 2005). Lockup periods are defined as the (1 s) bins where the absolute average velocity is <1°/s. Lockup probability was defined as the average number of lockup periods across trials and both eyes.
Analysis of spontaneous saccade and fixation.
Instantaneous absolute eye velocity was calculated from unfiltered eye positions, with the same velocity threshold for saccades (50°/s). As each saccade contained several consecutive sample periods above the threshold (due to the higher sampling rate compared with OKR recordings), the first sampling period above the threshold was taken as the time when the saccade occurred. We defined the disconjugacy index as , where is the ratio of left and right eye maximum saccade velocities, with the eye with greater velocity as the denominator. The disconjugacy index ranges from 0 (when both eyes move with the same velocity, low disconjugacy) to 1 (when two eyes move at equal speeds in opposite directions, high disconjugacy). The main sequence is defined as the slope of the linear regression for peak velocity and amplitude (Beck et al., 2004; Chen et al., 2016). We estimated the main sequence using the maximum instantaneous eye velocity during the saccade. Note that there is likely an underestimation of the peak velocity due to the rate of sample acquisition (25 Hz).
To measure the drift rate in eye position following spontaneous saccades in the light and the dark, we used a quasi-Newton unconstrained optimization (MATLAB fminunc with Algorithm set to quasi-Newton) to minimize the squared error between eye position and the function as follows:
with variable parameters A and τ. E0 was fixed to the mean position for the eye being fit. The algorithm was initialized with tau set to 10 s and A set to the first eye position value in the sample. The results did not qualitatively change when we randomly varied the initial condition of tau between reasonable starting positions (1–30 s). We excluded positions that occurred between 0 and 1 s after each saccade to avoid fitting post-saccadic relaxation related to plant mechanics (Sklavos et al., 2006). We also excluded positions that occurred ≥10 s after saccade to avoid fitting epochs where the eyes had already relaxed to their null position. Exponential fits were required to meet either of the following two criteria (based on visual inspection of fit qualities): (1) sum-of-squared errors <(30°)2, or (2) sum-of-squared error <(200°)2 and 1 − and the ratio of mean squared-error to the sample variance (analogous to R2 in linear regression) > 0.4.
VOR assay
Torsional eye movements were measured in 5 dpf fish in response to step tilts delivered using an apparatus similar in design to Schoppik et al. (2017). All experiments took place in the dark. Larval fish were immobilized in 2% low-melting-temperature agar (Thermo Fisher Scientific), and the left eye freed. The agar was then pinned (0.1 mm stainless minutien pins, FST) to a ∼5 mm2 piece of Sylgard 184 (Dow Corning), which was itself pinned to Sylgard 184 at the bottom of a 10 mm2 optical glass cuvette (Azzota). The cuvette was filled with 1 ml of E3 media and placed in a custom holder on a 5 axis (x, y, z, pitch, roll) manipulator (ThorLabs, MT3 and GN2). The fish was aligned with the optical axes of two orthogonally placed cameras such that both the left utricle and two eyes were level with the horizon (front camera). The experimenter running behavior was blind as to the genotype of the fish.
The eye-monitoring camera (Guppy Pro 2 F-031, Allied Vision Technologies) used a 5× objective (Olympus MPLN, 0.1 NA) and custom image-forming optics to create a 100 × 100 pixel image of the left eye of the fish (6 μm/pixel), acquired at 200 Hz. The image was processed online by custom pattern matching software to derive an estimate of torsional angle (LabView, National Instruments), and data were analyzed using custom MATLAB scripts. A stepper motor (Oriental Motors, AR98 MA-N5–3) was used to rotate the platform holding the cameras and fish. The platform velocity and acceleration were measured using integrated circuits (IDG500, InvenSense; and ADXL335, Analog Devices) mounted together on a breakout board (Sparkfun, SEN-09268). Fish were rotated stepwise for 4 cycles: from 0° to −15°, where positive values are nose-down, then from −15° to 0°, from 0° to 15°, then back to 0°. Steps had a peak velocity at 35°/s. The interstep interval was 7.5 s.
The eye's response across the experiment was first centered to remove any offset introduced by the pattern-matching algorithm. Data were then interpolated with a cubic spline interpolation to correct for occasional transient slowdowns (i.e., missed frames) introduced by the pattern-matching algorithm. The eye's velocity was estimated by differentiating the position trace; high-frequency noise was minimized using a 4-pole low-pass Butterworth filter (cutoff = 3 Hz). Each step response was evaluated manually; trials with rapid deviations in eye position indicative of horizontal saccades or gross failure of the pattern-matching algorithm were excluded from analysis. Across all fish and all steps used to measure the behavior, the median number of usable responses was 7 of 10. The response to each step for a given fish was defined as the mean across all responses to that step across cycles. The gain was estimated by measuring the peak eye velocity occurring over the period 375–1000 ms after the start of the step. Only steps away from the horizon were analyzed. Of 9 fish, 1 was excluded because it had fewer than 10 steps for analysis; all others had at least 10. The median number of steps ± interquartile range was 18/15 ± 13.75/10.5 for nose-down/nose-up steps, respectively.
Two-photon calcium imaging during behavior
Embryos from crosses of dscaml1 heterozygous mutants (dscaml1+/−;casper+/− × dscaml1+/−;nac+/−; elavl3:H2B-GCaMP6f) were used. At 5–7 dpf, pigmentless (nac−/−) dscaml1 heterozygous and homozygous mutant siblings were immobilized in a gel of 1.8% low melting-temperature agarose (Sigma-Aldrich) in preparation for imaging. Agarose was removed from the eyes to allow them to move freely during imaging. Each fish was genotyped by PCR after imaging. Simultaneous eye tracking and two-photon calcium imaging were performed using a custom-built system as previously described (Daie et al., 2015).
Each image (185 μm × 185 μm) was acquired by raster scanning a mode-locked excitation laser (930 nm) through a 40× water-immersion lens to a horizontal plane ventral to the Mauthner cell that included rhombomeres 5–6, where the abducens motor complex (ABD) is located (Miri et al., 2011b; Lee et al., 2015; Vishwanathan et al., 2017). The ABD contains the abducens motor neurons and internuclear neurons, which control ipsilateral eye abduction and contralateral eye adduction, respectively (Leigh and Zee, 2015). The laser power at the sample varied between 15 and 25 mW. For each animal, we recorded 3–10 planes at a rate of 1.95 Hz and duration of 5 min per plane. Each plane was recorded while vertical stripes were projected onto a screen of diffusion film placed 1–3 cm in front of the animal, providing an optokinetic stimulus (Daie et al., 2015). The stripes moved at a constant velocity whose magnitude and direction changed in a repeating pattern that consisted of equal durations of positive, negative, and zero velocity, with each phase lasting 3.14 s (2 heterozygotes and 6 mutants) or 31.26 s (1 heterozygote and 1 mutant). Eye position was measured using a substage, infrared camera (Allied Vision Technologies, Guppy FireWire camera) that acquired frames at 13 Hz (Daie et al., 2015). Eye velocity and fast-phase events were determined as described for OKR behavioral assays.
ROIs corresponding to cells were extracted from GCaMP6f fluorescence movies based on pixel-by-pixel correlations of fluorescence with eye movement. Body motion artifacts were corrected by excluding frames that undergo large shifts from a time-averaged reference frame (Lee et al., 2015). For each pixel, we computed the maximum absolute Pearson correlation between fluorescence and eye position or between fluorescence and eye velocity. Eye position and velocity were direction-rectified and convolved with a 2 s exponentially decaying impulse to account for the cell's calcium buffering (Miri et al., 2011a). Single neurons that contained at least one pixel with an absolute fluorescence-eye correlation value ≥ 0.3 (with either eye position or velocity) were selected and the delta F over F (dF/F) time series for each cell were computed. Putative abducens neurons were identified as cells that were located in rhombomeres 5–6 with a whole-cell fluorescence-eye correlation ≥ 0.3. Saccade-triggered average activity (STA) was calculated by averaging dF/F traces across fast-phase events, aligned to the onset of each event. We excluded planes with <5 events available for STA measurement. Slow-phase associated average activity was calculated by averaging dF/F traces across optokinetic stimulus phases, aligned to the start of each phase. Slow-phase activity calculations used only traces where no fast-phase events occurred within the first 3 s following optokinetic stimulus onset. For both STA and slow-phase activity, dF/F traces across fast-phase events and stimulus phases were linearly interpolated to a grid of evenly spaced time bins 333 ms in width before averaging.
Experimental design and statistical analysis
Comparisons of genotypic effects were made between siblings from the same clutch. For histological and behavioral analyses, data acquisition and processing were done blind (i.e., without knowledge of genotype). For two-photon calcium imaging, mutant animals were preselected based on visual inspection of eye movements, followed by post hoc PCR genotyping. For normally distributed data, parametric tests (t test or ANOVA) were used to determine p values. Holm–Sidak's correction was used for multiple comparisons after one-way ANOVA. Benjamini–Hochberg adjustment (false discovery rate at 0.05) was used for multiple comparisons after repeated-measures two-way ANOVA. For non-normally distributed data, nonparametric tests (Mann–Whitney U, Kolmogorov–Smirnov test, or Kruskal–Wallis) were used to determine p values. Dunn's correction was used for multiple comparisons after Kruskal–Wallis test. All tests were two-tailed. The significance level was set at p < 0.05. Statistical calculations were done using the Prism 8 software (GraphPad). Individual cells were used as statistical units for the analysis of neuronal activity, as the scientific goal was to examine the responses and variability of individual neurons during OKR (Editorial, 2018).
Results
To investigate when and where dscaml1 may affect the development of visual function and circuit activity, we first examined its expression in zebrafish. Then we assessed how the loss of dscaml1 affected visual pathway development and locomotor behavior. Finally, we analyzed oculomotor behavior and neural activity to deduce the underlying neural circuit changes in dscaml1 mutants.
Expression and gene targeting of zebrafish dscaml1
We examined the expression of dscaml1 with whole-mount FISH, from the embryonic stage to 5 dpf, during which visually guided eye movements begin to mature (Easter and Nicola, 1997; Beck et al., 2004). dscaml1 expression was enriched in the nervous system and present in most brain regions (Fig. 1B–E). In the retina, dscaml1 was expressed in the inner nuclear layer (containing the amacrine, bipolar, and horizontal cells) and the ganglion cell layer (containing retinal ganglion cells and amacrine cells) at 3 dpf (Fig. 1F,G). At 5 dpf, dscaml1 expression was seen predominantly in the INL and sparsely in the ganglion cell layer. These early and late expression patterns match the expression of mouse Dscaml1 in the retina at P6 and P12, respectively (Fuerst et al., 2009).
To test the function of dscaml1, we generated a mutant allele of dscaml1 by TALEN-mediated gene targeting (Reyon et al., 2012). The mutant allele, dscaml1vt1, contains a 7 bp deletion (9 bp deletion plus 2 bp insertion) after the start codon (Fig. 1H). Incorporation of the TALEN-mediated deletion in the dscaml1 mRNA was confirmed by RT-PCR and sequencing. The deletion results in frame shift and a truncated open reading frame, which lacks the signal peptide and all functional domains. These results suggest that dscaml1vt1 is likely a hypomorphic or null allele.
Homozygous mutant animals showed behavioral and morphological changes associated with the visual system. At 5 dpf, homozygous mutant animals (dscaml1−/−) appeared to develop normally, with inflated swim bladders. Compared with heterozygous (dscaml1+/−) and WT (wt) siblings, however, mutant animals had darker pigmentation when placed on a light background (Fig. 1I). This deficit in background adaptation, a camouflage response that requires light detection, suggests that dscaml1−/− animals may be visually impaired (Wagle et al., 2011). The body, head, and eye sizes of larvae were similar, with only a modest reduction in head width in the mutants, and a modest increase in head length in the heterozygotes (one-way ANOVA with Holm–Sidak's correction; n = 9 for wt, 18 for dscaml1+/−, 17 for dscaml1−/−; head width: wt vs dscaml1−/−, p = 0.0317; head length: wt vs dscaml1+/−, p = 0.0092) (Fig. 1K–N). At later stages, lethality was observed in mutant animals at 8 dpf, and none survived past 11 dpf (Fig. 1J). dscaml1+/− animals are viable and fertile as adults. Despite the late larval stage lethality, dscaml1 mutant brain showed no gross abnormalities. Major longitudinal and commissural axon tracts, motor axon terminals, and peripheral ganglia are formed normally in mutants (Fig. 2A–C). The only observed morphological difference was in the optic tectum neuropil region, a major retinorecipient area important for sensory processing. The optic tectum neuropil was 23% larger in mutants (44,121 ± 1017 μm2) versus WTs (35,816 ± 656.5 μm2) or heterozygotes (36,715 ± 549 μm2) (one-way ANOVA; n = 26 for all genotypes; p < 0.0001; Fig. 2D).
Figure 2.
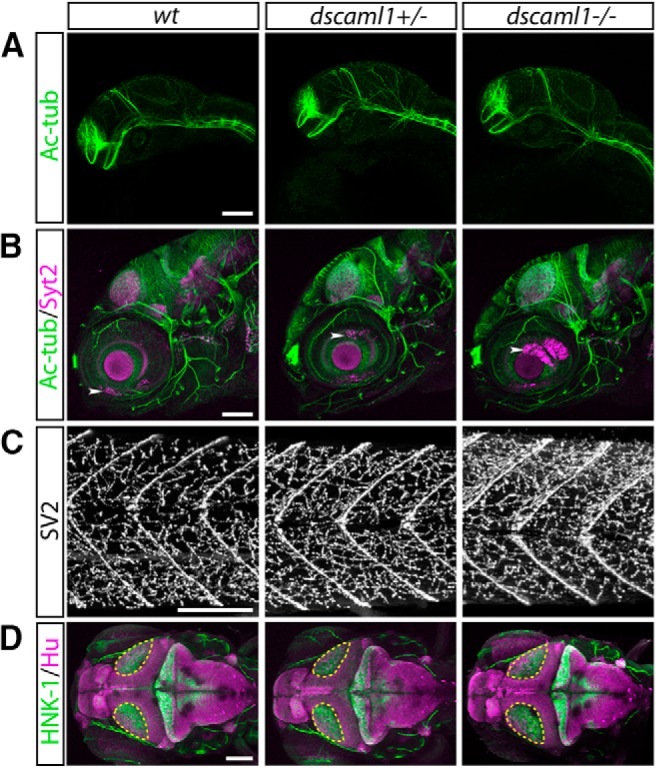
Brain morphogenesis is grossly normal in dscaml1 mutants. A, B, Lateral view of axon tracts (Ac-tub, green) and synapses (Syt2, magenta) at 1 and 5 dpf. A, In 1 dpf embryos, no differences were seen in the formation of the major commissures and longitudinal tracts (Ross et al., 1992). B, In 5 dpf larvae, no apparent abnormalities were seen in the morphology of sensory nerves, motor nerves, or distribution of synapses in the brain and retina (Higashijima et al., 2000; Fox and Sanes, 2007). White arrowheads indicate autofluorescence from eye pigmentation. C, Lateral view of the trunk myotomes (chevron-shaped stripes), stained with anti-SV2, a marker for the axon terminals at the neuromuscular junction. D, Dorsal view of 5 dpf larvae stained for mature neurons (Hu, magenta) and axon tracts (HNK-1, green). Areas outlined in yellow represent the optic tectum neuropil region. Images represent maximal intensity projection of confocal image stacks. Scale bars, 100 μm.
dscaml1 is required for planar and laminar patterning in the retina
Genetic studies in mice and chick demonstrated that Dscaml1 is required for planar patterning of retinal amacrine cells and laminar specific neurite termination in the IPL (Yamagata and Sanes, 2008; Fuerst et al., 2009; Garrett et al., 2016). We found that dscaml1 has conserved functions in retinal patterning in zebrafish. With H&E staining, we did not see visible perturbation of retina structure, with the exception that the IPL is thicker in the heterozygotes and mutants, compared with WTs (one-way ANOVA with Holm–Sidak's correction; n = 11 for all genotypes; wt vs dscaml1+/−, p < 0.0001; wt vs dscaml1−/−, p < 0.0001) (Fig. 3A,B). Increased IPL thickness was also seen in Dscam and Dscaml1 mutant mice, and may be caused by decreased developmental cell death (Fuerst et al., 2009; Garrett et al., 2016).
Figure 3.
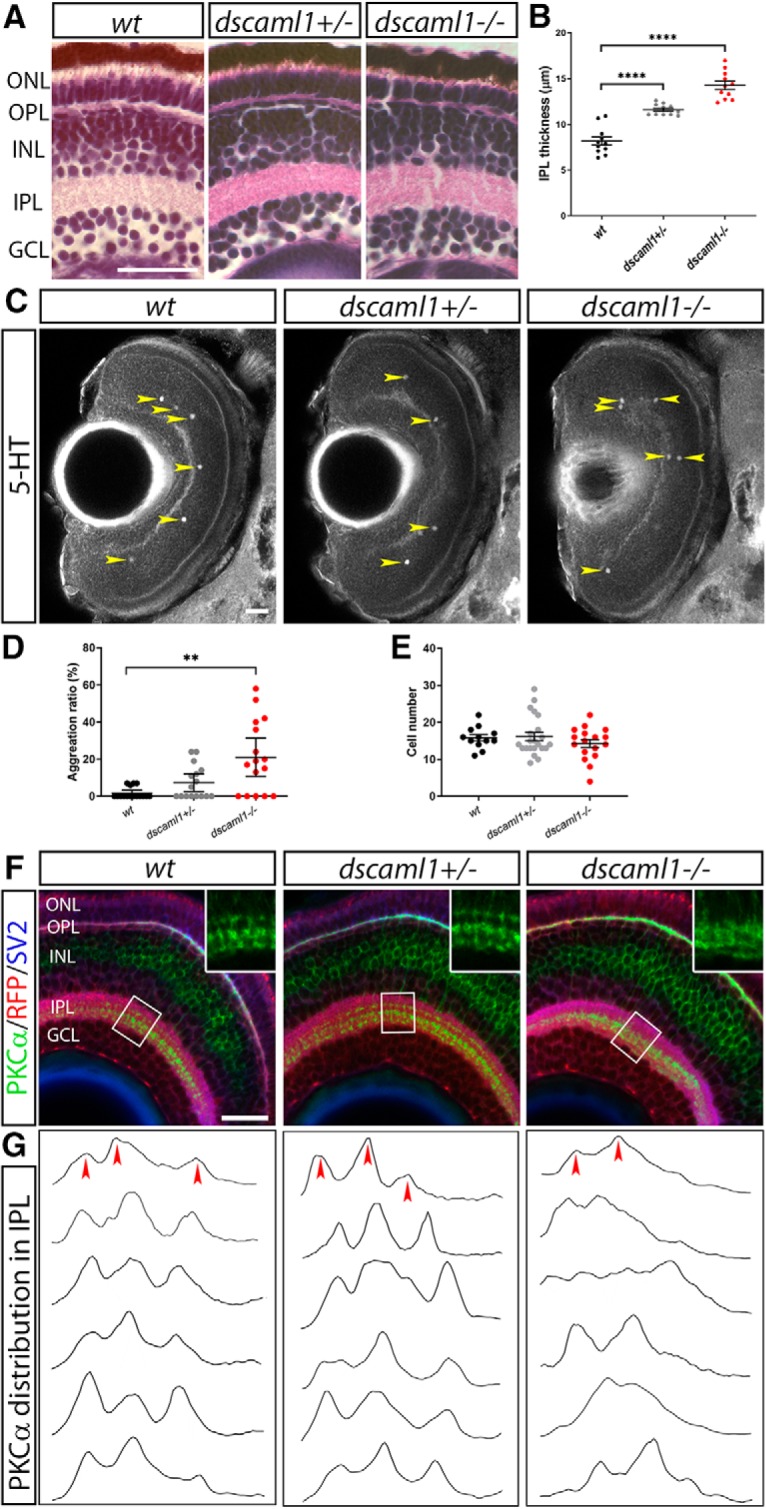
dscaml1 is required for planar and laminar patterning of the retina. A, H&E staining of 5 dpf retina. B, Quantification of IPL thickness, performed in confocal imaged 5 dpf larvae immunostained with anti-Syt2. Mutants have significantly thicker IPL compared with WT animals. Heterozygotes have an intermediate phenotype. C, Serotonergic amacrine cells, stained with an antibody against 5-hydroxytryptamine (5-HT). Yellow arrowheads indicate cell bodies. D, Percentage of cells that are immediately adjacent to another cell (within 10 μm, ∼3 cell diameter) is significantly higher in dscaml1−/− animals, compared with wt. Error bars indicate medians with 95% CI. E, The number of 5-HT-positive amacrine cells was similar among different genotypes. Error bars indicate mean ± SE. F, Immunostaining of ON-bipolar cell (PKCα, green), retinal ganglion cell [Tg(atoh7:GAP-RFP), red], and synapses (SV2, blue). Boxed areas are enlarged twofold and shown in the inset. Both mutants and morphants show loss of discrete stratification and mature terminal boutons in the ON (bottom) sublamina of the IPL. G, PKCα immunolabeling intensity (vertical axis) was plotted across the depth of the IPL (horizontal axis), normalized for maximal intensity and IPL thickness. Three prominent peaks can be discerned in WT and heterozygote animals (red arrowheads). The number and location of peaks are more variable in mutants and morphants. GCL, Ganglion cell layer; INL, inner nuclear layer; ONL, outer nuclear layer; OPL, outer plexiform layer. Scale bars, 25 μm. **p < 0.01, ****p < 0.0001.
To test dscaml1's role in planar patterning, we labeled the 5-HT-expressing amacrine cells. 5-HT cells represent a single amacrine cell type (S1) that is sparsely distributed in the retina, with very few contacts between cell bodies (Fig. 3C) (Maurer et al., 2010). In dscaml1 mutants, however, frequent clustering of 5-HT amacrine cells was observed. We calculated the probability of one cell being immediately adjacent to another, termed aggregation index (density recovery profile analysis was not possible due to the sparsity of this cell type in the larvae). Compared with WT animals, the aggregation index in mutants was significantly increased (Fig. 3D) (Kruskal–Wallis test with Dunn's correction; n = 16 for all genotypes; wt vs dscaml1+/−, p = 0.3657; wt vs dscaml1−/−, p = 0.0017). The increased aggregation seen in the mutants was not due to an increase in the number of 5-HT amacrine cells, which was not significantly different in heterozygote and mutant animals, compared with WT animals (Fig. 3E) (one-way ANOVA with Holm–Sidak's correction; n = 12 for wt, n = 22 for dscaml1+/−, n = 17 for dscaml1−/−; p = 0.8544 for wt vs dscaml1+/−, p = 0.6118 for wt vs dscaml1−/−).
We also found that loss of dscaml1 impacted laminar specific neurite termination in the IPL, specifically of the ON-bipolar cell axon terminals (visualized with anti-PKCα) (Wan et al., 2005). ON-bipolar cells transduce electrical activity in response to light increments (e.g., lights turning on) and have dendrites that extend toward the outer plexiform layer (where they synapse with photoreceptor cells) and axons that form three discrete layers in the inner half of the IPL (the ON sublamina) (Fig. 3F) (Schroeter et al., 2006). This distribution was quantified by measuring the fluorescent intensity of PKCα immunolabeling across the thickness of the IPL, as defined by SV2 immunolabeling (Nevin et al., 2008). In all WT and heterozygote animals, three distinct peaks at stereotypical positions can be discerned. In contrast, PKCα distribution in the mutants was more diffuse and did not form three discrete sublaminae (Fig. 3G). Cone photoreceptors and Müller glia appear morphologically normal in the dscaml1 mutant retina (Fig. 4A–F).
Figure 4.
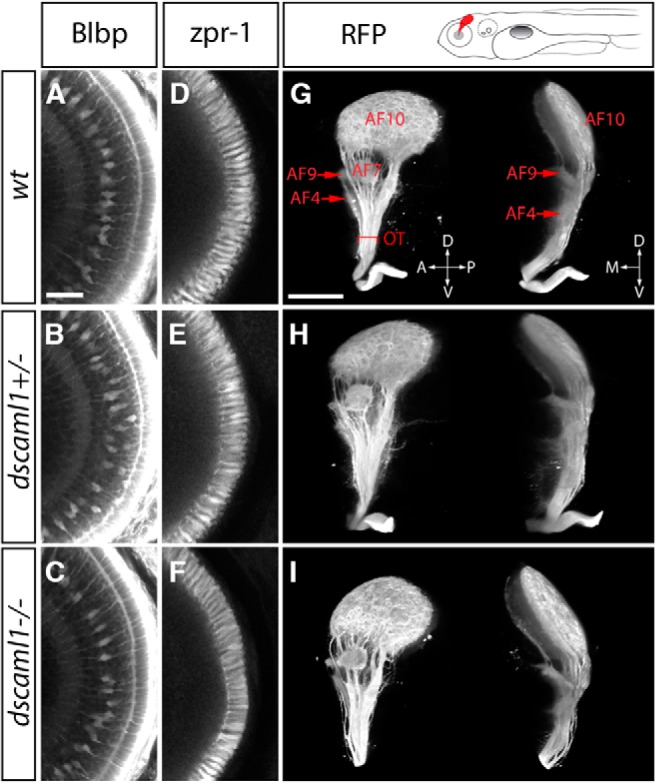
Normal development of Müller glia, outer retina, and optic tract in the dscaml1 mutant. A–F, No abnormalities were seen in cone photoreceptor cells (stained with zpr-1 antibody) and Müller glia (anti-Blbp). G–I, Retinal afferent projection in dscaml1 mutants. The panel above G represents an illustration of retinal afferents (red) in the Tg(atoh7:GAP-RFP) transgenic. Images represent the 3D reconstruction of retinal afferents viewed from the side (left images) and front (right images). Retinal arborization fields (AFs) in the thalamus (AF4), pretectum (AF7, 9), and optic tectum (AF10) are identified as described previously (Robles et al., 2014). No differences were observed among different genotypes. OT, Optic tract. A–F, Shown at the same scale. Scale bar: A, 25 μm. G–I, Shown at the same scale. Scale bar: G, 100 μm.
Loss of dscaml1 did not appreciably affect the afferent projections of the retina. We used the Tg(atoh7:GAP-RFP) transgenic line, which expresses membrane-tagged red fluorescent protein in retinal ganglion cells (Zolessi et al., 2006). In dscaml1 mutants, the optic nerve crossed the chiasm normally, and the axon terminals (arborization fields) of the optic tract were mostly indistinguishable from WT and heterozygous animals (Fig. 4G–I) (Robles et al., 2014). This suggests that the expression of dscaml1 in the ganglion cell layer is not required for the outgrowth of retinal ganglion cell axons. It remains possible, however, that the projections of a subset of retinal ganglion cells may be affected by the loss of dscaml1. Overall, the expression and mutant phenotypes of zebrafish dscaml1 demonstrate that it is functionally conserved with other vertebrates and required for both planar and laminar patterning in the retina.
Abnormal locomotor behavior in dscaml1 mutants
Given the retinal patterning deficits and background adaptation abnormality seen in the mutants, we asked whether light-induced locomotor activity is also affected. We monitored locomotor activity of individual 5 dpf larvae over 24 h, under normal circadian cycle (14 h day/10 h night; Fig. 5A) (Prober et al., 2006; Farrell et al., 2011). Consistent with previous studies, WT fish were more active during the day, less active at night, and responded robustly during day/night and night/day transitions (Prober et al., 2006). This diurnal rhythm was preserved in dscaml1 mutants. Loss of dscaml1 did not affect the duration of active periods, during either day or night (Fig. 5B,C). The amount of movement, however, was reduced in mutants during the day, compared with WTs (one-way ANOVA with Holm–Sidak's correction; n = 8 for all genotypes; p = 0.9679 for wt vs dscaml1+/−, p = 0.0330 for wt vs dscaml1−/−) (Fig. 5D). Mutants also had reduced response to lights turning on, compared with WT animals (one-way ANOVA with Holm–Sidak's correction; n = 8 for all genotypes; p = 0.5272 for wt vs dscaml1+/−, p = 0.0085 for wt vs dscaml1−/−) (Fig. 5F). Interestingly, the response in mutants to lights off was similar to WT and heterozygous siblings (Fig. 5G). These results show that dscaml1 mutants can detect light and move in response to a light offset, but are deficient in responding to light onset. These behavioral deficits are consistent with a partial deficit in the retinal ON pathway, potentially contributed by imprecise sublamina-specific ON-bipolar cell axon targeting.
Figure 5.

Locomotor activity in response to light. A, Locomotor activity over 24 h. Solid lines indicate mean movement (n = 8 for each group). Dotted lines indicate the range of SE. Lighting conditions are indicated on the x axis, with each tick marking 1 h. B, C, Percentage time active during the day (B) and night (C). D, E, Average movement during the day (D) and night (E). F, G, Total amount of movement 30 min after lights switch on (F) and off (G). *p < 0.05, **p < 0.01.
Abnormal OKR and eye lockup in dscaml1 mutants
To further test the role of dscaml1 in neural circuit function and sensorimotor integration, we examined the mutants' performance in OKR. OKR consists of visual motion (i.e., optic flow)-triggered tracking eye movements (slow phases) and intervening resetting saccades (fast phases) (Fig. 6A). The quality of OKR is measured by slow-phase gain, which is the ratio of eye velocity to the velocity of the visual motion. In zebrafish, OKR develops early and is robust by 3–4 dpf (Easter and Nicola, 1997). We tested 5–6 dpf larvae inside a circular arena where black and white moving gratings were projected onto the arena, and eye position was video-recorded simultaneously (Fig. 6A; Movie 1). Grating directions alternated between clockwise and counterclockwise every 3 or 40 s (Fig. 6B,E). Under short time scale (3 s), fast phase has little effect on OKR performance, and gain is directly related to the processing of optic flow via the vestibular premotor pathway (Fig. 1A) (Rinner et al., 2005; Kubo et al., 2014). Under long time scale (40 s), saccades are necessary to reset eye position periodically, and the oculomotor system needs to be robust against eye position drifts and fatigue in optic flow response (Beck et al., 2004; Smear et al., 2007; Schoonheim et al., 2010; Pérez-Schuster et al., 2016).
Figure 6.

OKR and VOR performance in dscaml1 mutants. A, Larvae were immobilized in the center of a circular arena, where black and white vertical bars are projected. Right, Diagram of eye position, with fast phases (red segments) and slow phases (blue segments). B–D, Short time-scale OKR. Eye position traces are shown for control (C) and dscaml1−/− (D) animals, aligned to the square wave stimulus (B). Right and left eye traces are in black and fuchsia, respectively. E–G, Long time-scale OKR. Eye position and velocity traces are shown for control (F) and dscaml1−/− (G), aligned to the stimulus (E). In mutants, the eyes intermittently became locked up (red arrowheads). H, Slow-phase velocity across a range of contrast levels. I, Saccade amplitude is lower in mutants during long time-scale OKR. J, Temporal dependency of lockup probability. K, Histogram of eye positions during lockup in dscaml1 mutants. L, M, Slow-phase gain including (L) or excluding (M) lockup periods. H, L, M, Positive gains are defined as eye movement in the same direction as the stimulus. Regression lines, means, SE (shaded areas), and decay constant (τs) are shown. A linear regression model was used in J and control group in L. Two-phase exponential decay regression model with plateau constrained to 0 was used for dscaml1−/− group in L and both groups in M. *p < 0.05, ****p < 0.0001.
OKR response. Control (left) and dscaml1−/− (right) animals performing OKR.
We found that visuomotor processing for optic flow is intact in dscaml1 mutants at short time scales. During short-period OKR, control (WT and heterozygote) and mutant animals exhibited qualitatively similar optokinetic responses (Fig. 6B–D). Genotype has varying effects on slow-phase gain at different contrast levels (repeated-measures two-way ANOVA; n = 42 for controls, n = 24 for dscaml1−/−; genotype-contrast interaction accounts for 0.75% of total variance, F(5,320) = 4.374, p = 0.0007). Slow-phase gain increased linearly with the logarithm of stimulus contrast in both groups, and there was no significant difference in gain at lower contrast levels (contrast ≤ 0.2) (Fig. 6H). Mutants did have lower slow-phase gain than the controls at higher contrast levels, although the deficit was mild (repeated-measures two-way ANOVA with Benjamini–Hochberg adjustment; p = 0.0239 for contrast = 0.5, p = 0.0239 for contrast = 1). These findings suggest that the dscaml1 mutation largely spared the pretectal-vestibular pathway, at least at the initial stages of the optokinetic response.
At longer time scales, however, it was clear that dscaml1 mutants exhibited deficits in OKR. In control animals, fast phase (resetting saccade) and slow phase alternated regularly, and saccades had consistent frequency and amplitude (Fig. 6F). In mutants, saccades and slow-phase again alternated, but resetting saccades were irregular and reduced in amplitude (unpaired t test; n = 14 for controls, n = 13 for dscaml1−/−; p < 0.0001) (Fig. 6G,I). Slow-phase gain in mutants during this sustained stimulus condition was also reduced. This was evident both in lower average velocity and periods where mutant eye movements would frequently pause. We refer to these pauses as “lockups” due to their similarity to the lockup phenotype seen in human with saccade deficits (Harris et al., 1996). The probability of lockup increased linearly over time, both in controls and mutants (Fig. 6J). The probability of lockup (time bins where velocity < 1°/s) was significantly higher in mutants, compared with controls (comparison of linear regression intercepts, p < 0.0001) (Smear et al., 2007; Pérez-Schuster et al., 2016). Lockup events could occur throughout the eye position range in the mutants, suggesting that lockup is not due to a failure to initiate fast phase at more eccentric positions (Fig. 6K). Concurrently, relative to controls, mutants had more pronounced decay of slow-phase gain over time, even when lockup periods were excluded (Fig. 6L,M) (Beck et al., 2004; Chen et al., 2014). In both control and mutant datasets, the decay of slow-phase gain was well fit with a double exponential. Loss of dscaml1 resulted in a drop in the contribution by the longer (later) component, and faster decay in the shorter (earlier) component (Table 1; decay constant, τ, for short component shown in Fig. 6L,M). These results suggest that dscaml1 plays an important role in the development of oculomotor circuits that support resetting saccades and sustained OKR.
Table 1.
Double exponential decay fit for slow-phase gain
| Control | dscaml1−/− | |
|---|---|---|
| With lockup | ||
| Y0 | 0.86 | 0.99 |
| Contribution of long component (%) | 47.31 | 25.87 |
| τ (short) | 7.25 | 2.31 |
| τ (long) | 305.00 | 72.01 |
| Without lock up | ||
| Y0 | 0.9461 | 1.297 |
| Contribution of long component (%) | 52.66 | 23.65 |
| τ (short) | 6.749 | 2.385 |
| τ (long) | 2.89E + 08 | 472.4 |
Abnormal torsional eye movements during VOR in dscaml1 mutants
Our OKR assays tested the capacity for horizontal gaze stabilization, which requires the use of vestibular circuits that are presynaptic to the motor neurons controlling lateral and medial recti. To test the functionality of vestibular circuits upstream of the other four extraocular motoneuron populations, we measured the gravito-inertial VOR in the torsional plane (Fig. 7). In response to nose-up pitch tilts, larvae will use their superior oblique and inferior rectus muscles to counter-rotate the eyes. Similarly, following nose-down pitch tilts, larvae stabilize their gaze using the superior rectus and inferior oblique muscles (Schoppik et al., 2017). As expected, WT larvae at 5 dpf showed strong VOR in response to 15° steps up or down away from horizontal, with a slightly stronger response to nose-up tilts. dscaml1 mutants were able to initiate VOR in a directionally appropriate manner but had lower gain (maximum eye velocity/maximum table velocity, 35°/s) to both up and down stimuli (Mann–Whitney U test; n = 4 for wt, n = 5 for dscaml1−/−; p = 0.0159 for up stimulus, and p = 0.0286 for down stimulus) (Fig. 7B). As fish develop VOR in the absence of light, this deficit is likely not due to any visual impairment (Easter and Nicola, 1997).
Figure 7.
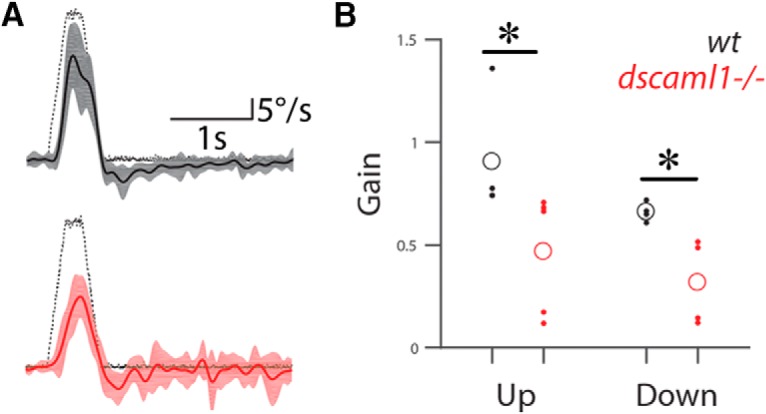
Torsional eye movements require dscaml1. Torsional eye movements of 5 dpf fish in response to upward or downward tilts of the head along the pitch axis. A, Eye velocity in response to a 35°/s tilt stimulus (black dotted line) in WT (top, solid black line) and dscaml1 mutant (bottom, solid red line). Shaded areas represent interquartile range. Torsional velocity was slower in mutants, compared with WT. B, Velocity gain of upward and downward tilts, both of which are lower in mutants. Open circles represent mean values. *p < 0.05.
Abnormal saccade and fixation in dscaml1 mutants
The pronounced reduction in fast-phase response and the severe fatigue in slow-phase response during OKR in the mutant suggested potential deficits in central oculomotor circuits. More specifically, the decrease in fast-phase velocity is consistent with a deficit in the saccadic premotor pathway, and the drop in OKR gain over time is consistent with a deficit in the horizontal velocity-to-position integrator. To test these possibilities, we examined spontaneous eye movements under uniform illumination (no gratings) or in the absence of vision (dark). Spontaneous eye movements in zebrafish consist of intermittent saccades, followed by periods of fixation, similar to mammalian scanning saccades (Beck et al., 2004; Schoonheim et al., 2010). This behavior is used to direct visual attention to the temporal retina, where photoreceptor density is highest (Schmitt and Dowling, 1999; Bianco et al., 2011). Spontaneous saccades also occur in the dark, which allowed us to test saccade and integrator pathway function in the absence of visual feedback (Mensh et al., 2004; Miri et al., 2011a; Chen et al., 2016).
We found that dscaml1 deficiency affected both visual-input-dependent and -independent aspects of saccade function. In the light, spontaneous saccades in the control animals alternated in direction and were usually bilaterally synchronized (conjugate) (Fig. 8A). In the mutants, saccades were more disconjugated, slower, and often moved in the same direction (Fig. 8B). We quantified these phenotypes and found that, in the light, mutants had significantly higher proportion of slower saccades (50°–125°/s) and lower proportion of faster saccades (>200°/s) (repeated-measures two-way ANOVA with Benjamini–Hochberg adjustment; n = 20 for control, n = 13 for dscaml1−/−; p = 0.1542 for 50°–125°/s, p = 0.0199 for 125°–200°/s, p = 0.0412 for >200°/s) (Fig. 8C). The overall velocity distribution of saccadic events was also significantly shifted toward lower velocities in the mutants, compared with controls (two-sample Kolmogorov–Smirnov test; p < 0.0001) (Fig. 8D, solid lines). In the dark, spontaneous eye movements were more similar between control and mutants (Fig. 8A′,B′). Saccade velocities were not significantly different between controls and mutants across different velocity bins (repeated-measures two-way ANOVA with Benjamini–Hochberg adjustment; n = 19 for control, n = 14 for dscaml1−/−; p > 0.9999 for all velocity bins) (Fig. 8C′). The overall distribution of saccadic events was also not significantly different (two-sample Kolmogorov–Smirnov test; p = 0.0660) (Fig. 8D, dashed lines). Interestingly, saccade conjugacy was not affected by lighting conditions; mutant saccades were significantly more disconjugated than controls both in the light and the dark (two-sample Kolmogorov–Smirnov test; p < 0.0001 for both light and dark) (Fig. 8E).
Figure 8.

Spontaneous saccade and fixation are abnormal in dscaml1 mutants. A, B′, Spontaneous saccades in control (A, A′) and dscaml1−/− (B, B′) were recorded during uniform illumination (light) or in the dark. Right and left eye traces are in black and fuchsia, respectively. Red arrowheads indicate disconjugated saccades. Black arrows indicate eye position decay after saccade. C, C′, The frequency of eye movements divided into angular velocity bins. C, In the light, controls had significantly more eye movements >200°/s compared with mutants, whereas mutants had more eye movements in the 125°–200°/s bin. C′, In the dark, eye velocities were similar between control and mutants across all bins. Data are mean ± SE. D, Cumulative frequency distribution of eye movements based on angular velocity. Control animals performed significantly more fast eye movements than mutants in the light (solid lines). No significant difference was found between controls and mutants in the dark (dashed lines). E, Cumulative distribution of saccade disconjugacy index for controls and mutants (higher value equals more disconjugated; see Materials and Methods). Controls had significantly lower disconjugacy index than mutants in the light (solid lines) and in the dark (dashed lines). F, F′, Spontaneous saccade amplitude. Controls had larger saccade amplitude than the mutants in the light (F) and the dark (F′). Median and 95% CI are shown. G, G′, Velocity and amplitude for each saccade event were plotted, along with linear regression (solid line). The slopes (main sequence) are similar between groups but significantly lower in the mutants in the light (p < 0.01, G). The slopes are not significantly different between groups in the dark (G′). H, I, Examples of TagRFP-T expressing abducens motor neurons [from Tg(mnx1:TagRFP-T)] in WT (G) and mutant (H) animal. Dorsal view, rostral to the left. Labeled structures represent motor axons (VIth nerve, white arrows), rostral abducens complex (green arrowheads), and caudal abducens complex (magenta arrowheads). Scale bar, 100 μm. J, J′, Eye position decay (A, B, arrows) calculated as τ (lower τ indicates faster decay). Controls had significantly higher τ than the mutants in the light (J) and the dark (J′). Error bars indicate median and 95% CI. *p < 0.05, ****p < 0.0001.
The reduced saccade velocity in mutants may reflect smaller saccade amplitudes, as saccade peak velocity and amplitude are linearly correlated, a relationship known as main sequence (Beck et al., 2004; Chen et al., 2016). Main sequence is a clinically relevant diagnostic metric for saccade: patients with COMA have smaller saccade amplitudes but normal velocity (normal main sequence), whereas patients with saccade deficits associated with neurodegenerative disorders have both smaller saccade amplitudes and lower velocity (lower main sequence) (Zee et al., 1977; Garbutt et al., 2001). We found that the mutants have significantly smaller saccade amplitudes in the light (Mann–Whitney U; n = 415 events from 20 control animals, n = 411 events from 13 dscaml1−/− animals; p < 0.0001) (Fig. 8F), and modestly lower main sequence (ANCOVA; 12.39 and 14.28 for dscaml1−/− and controls, respectively; p = 0.0039) (Fig. 8G). In the dark, the difference in saccade amplitude is smaller but still significant (n = 213 events from 19 control animals, n = 273 events from 14 dscaml1−/− animals; p < 0.0364) (Fig. 8F′). There was no significant difference in main sequence in the dark (12.21 and 13.79 for dscaml1−/− and controls, respectively; p = 0.0716) (Fig. 8G′). The relatively normal main sequence in the dark suggests that the ocular periphery is not significantly affected by the loss of dscaml1. Consistent with this finding, we did not see any gross abnormality in the abducens motor neuron projection to the lateral rectus muscle in the mutants (Fig. 8G,H).
In addition to saccade deficits, post-saccade fixation was significantly perturbed in dscaml1 mutants both in the light and in the dark, indicating a deficit in the neural integrator pathway. The integrator pathway provides tonic activation of motor neurons to maintain fixation, counteracting spring forces in the eye plant that would cause a drift back to the null position (Fig. 8A–B′, arrows); during sustained OKR in a given direction, this pathway is also necessary for converting tonic eye velocity commands to ramp-like eye position commands. We modeled this drift rate using an exponential decay function and found that eye position in mutant animals drifted toward baseline more rapidly than in controls both in the light (Mann–Whitney U; n = 637 events from 20 control animals, n = 341 events from 13 dscaml1−/− animals; median τ = 20.76 and 4.49 s for control and dscaml1−/−, respectively; p < 0.0001), and in the dark (Mann–Whitney U; n = 588 events from 19 control animals, n = 250 events from 14 dscaml1−/− animals; median τ = 12.96 and 4.72 s for control and dscaml1−/−, respectively; p < 0.0001) (Fig. 8J–J′). The deficit in the dark suggests dysfunction in the intrinsic processing of the neural integrator; the lack of improvement in the fixation time constant in the light for the mutant suggests an additional dysfunction in how the integrator processes signals from the pretectal-vestibular pathway.
Together, these results help to clarify the earlier findings from the optokinetic response. The minimal difference in saccade velocity and amplitude between the control and mutant animals in the dark suggests that the development of burst neurons and abducens neurons is not dependent on dscaml1. However, the increased disconjugacy of saccades and the pronounced decrease in saccade velocity and amplitude in the light (for both spontaneous and reflexive saccades) points to a deficit in upstream populations that determine saccade targets. The poor integrator function in the mutant helps to explain the severe drop in slow-phase gain at long time scales.
Loss of dscaml1 leads to neural activity deficits during OKR fast phase
To confirm the neurophysiological basis of the oculomotor phenotypes, we focused on the activity of the ABD, which controls the extraocular muscles for horizontal eye movements and serves as the convergence point for different premotor inputs (Fig. 1A). We performed two-photon calcium imaging in control (dscaml1+/−) and mutant (dscaml1−/−) fish in elavl3:H2B-GCaMP6f transgenic background while they performed OKR. Eye positions were recorded simultaneously with an infrared video camera, and oculomotor behavior-encoding ABD neurons (motor or internuclear) were then identified based on anatomical location and calcium activity (Fig. 9A,B). We projected a grating stimulus in front of the animal and then moved that stimulus in a repeating temporal pattern (Fig. 9C,D). We measured mean fluorescence following the onset of stimulus movement in either the ipsilateral (e.g., clockwise for right ABD) or contralateral (e.g., counterclockwise for right ABD) direction. Slow-phase ABD activity (a proxy for vestibular pathway activity) was calculated with deconvolved calcium signal for the first 3 s of the ipsilateral or contralateral phases. Fast-phase ABD activity (a proxy for saccadic pathway activity) was calculated with deconvolved average fluorescence following saccadic eye movements in both directions. Since ABD neuron responses are direction-selective, we could excite neurons in both hemispheres by alternating the direction of stimulus movement.
Figure 9.

Two-photon calcium imaging in abducens neural populations. A–D, Two-photon calcium imaging and simultaneous eye position recording during OKR. Circles in time-averaged images represent the locations of cells (A, B) with corresponding indices whose fluorescence activity is shown (C, D). Circles in the ABD are marked. E, Average fluorescence traces of individual cells (y axis) aligned to stimulus onset during slow-phase activity (x axis) in the ABD. F, Population average of fluorescence traces in E. G, Average fluorescence traces aligned to fast-phase eye movements for cells in the ABD. H, Activity in G averaged across the population. F, H, Error bars indicate the median absolute deviation of single-cell activities from the population average divided by the square root of the number of cells, normalized so that population responses are between −1 and 1. *p < 0.05, ****p < 0.0001. Scale bar, 20 μm.
As expected from the earlier findings that slow-phase behavioral responses are qualitatively normal on the short timescale, loss of dscaml1 did not affect ABD activity during slow phase. Population-average activity in the ABD was comparable in mutant and control animals following the onset of stimulus movement in the ipsilateral direction (n = 86 cells from 3 control animals; n = 424 cells from 6 mutant animals) (Fig. 9E,F). In the contralateral direction, ABD population-average activity reached similar steady-state levels in mutant and controls. This result is consistent with dscaml1's relatively mild effect on slow phase at short time scale and suggests that the pretectal-vestibular pathway is unaffected.
In contrast, ABD activity in mutants was substantially reduced during fast phase. The STA of ABD cells in the control animals was characterized by a rapid increase or decrease in deconvolved fluorescence following an ipsilateral or contralateral saccade, respectively (Fig. 9G,H). The STA of mutant ABD cells following fast-phase events in either direction was reduced in both directions, compared with controls (repeated-measures two-way ANOVA with Benjamini–Hochberg adjustment; n = 110 cells from 3 control animals, n = 178 cells from 7 mutant animals; p = 0.0166 at t = 0.333 s for ipsilateral direction, p < 0.0001 at t = 0.6667–2.333 s for contralateral direction) (Fig. 9H). This result confirms that the saccadic deficit is of central origin and not associated with any deficits at the neuromuscular junction.
Discussion
We investigated the functional consequences of zebrafish dscaml1 deficiency in the visual and oculomotor systems. Our results underscore the importance of DSCAM proteins in retinal patterning and establishing visuomotor function. Our neurophysiological findings further suggest that specific oculomotor subcircuits are impacted by the loss of dscaml1. Specifically, our data suggest that the saccadic and integrator premotor circuits were perturbed in the dscaml1 mutants, but the pretectum-vestibular pathway was largely intact. The collection of oculomotor deficits in dscaml1 mutants resembles the oculomotor phenotypes in human COMA.
dscaml1 and retinal development
In the retina, distinct cell types are organized in a mosaic pattern horizontally, and their neurites stratify vertically in the inner and outer plexiform layers (Hoon et al., 2014). Our results show that zebrafish dscaml1, like its mammalian orthologs, is required for both aspects of spatial patterning (Garrett et al., 2012). We show that, in zebrafish, loss of dscaml1 causes serotonergic amacrine cells to aggregate. In the IPL, axon terminals of ON-bipolar cells are more diffuse in dscaml1 mutants, which likely affects laminar specific synaptogenesis. As ON-bipolar cell axon maturation is activity-independent, this diffuse terminal morphology reflects a delay or failure in axon terminal development (Schroeter et al., 2006; Nevin et al., 2008). The retinal phenotypes observed in zebrafish are similar to those seen in Dscaml1 mutant mice, which showed abnormal aggregation of amacrine cells and impaired neurite stratification in the IPL (Fuerst et al., 2009; Garrett et al., 2016). These results demonstrate the functional conservation of Dscaml1 across vertebrate species.
How the retinal patterning deficits observed in dscaml1 mutants affect visual function in dscaml1 remains to be tested, but the collection of behavioral phenotypes provides some clues. The reduced light-on locomotor response and darker pigmentation in dscaml1 mutants are suggestive of a reduction in ON-pathway function. Consistent with this, the sluggish locomotor response to light-on observed in the dscaml1 mutant animals resembles the no optokinetic response c (nrc) mutant, which lacks retinal ON responses (Emran et al., 2007). The more diffuse targeting of ON-bipolar cell axons in dscaml1 mutants may lead to reduced strength or specificity of light-on responses. However, in contrast to nrc animals, which cannot perform OKR, dscaml1 animals can still perform OKR. Therefore, it is most likely that ON response is reduced but not completely abolished in dscaml1 mutants.
Oculomotor behavior and neural circuit function
The combination of behavioral assays and functional imaging showed that dscaml1 was necessary for oculomotor circuit function, potentially through its roles in neural patterning and neural circuit assembly. We focused our analysis on three subcircuits for horizontal eye movements: the saccadic, vestibular, and integrator premotor pathways.
Loss of dscaml1 strongly affected both OKR saccades (i.e., fast phase) and spontaneous saccades. This is confirmed by physiological observations showing that saccade-related activity in the abducens during OKR was decreased in the mutants, compared with controls. Notably, dscaml1 deficiency affected both visual input-dependent and -independent aspects of saccade function. We found that saccade conjugacy was not affected by lighting conditions in either control or mutants. Saccades were more disconjugated in dscaml1 mutants both in the light and the dark, indicating that disconjugacy was caused by an intrinsic deficit of the saccade premotor pathway. In contrast, spontaneous saccade velocity and amplitude were more substantially impaired in the mutants in the light, compared with the dark. The mutants' relatively normal saccade performance in the dark suggests that the saccade burst neurons were likely not affected by dscaml1 (Scudder et al., 2002). Instead, dscaml1 deficiency potentially impairs upstream saccade initiation pathways that process visual information (e.g., the optic tectum; Fig. 1A). It is hypothesized that the tectum encodes visually mediated saccade initiation signals, with the tectal place fields encoding saccade direction and amplitude (Salas et al., 1997). These place fields may be disrupted during visually guided saccades through the expected connectivity deficits induced by dscaml1 mutation.
We saw selective deficits in the vestibular pathway. OKR slow phase performance at short time scale was mostly normal in mutants, consistent with the normal ABD calcium dynamics during slow phase. dscaml1 mutant animal's performance dropped off at higher speeds, but the effects were relatively mild. Given the essential role of the retinal ON pathway in OKR (Emran et al., 2007) and the diminished behavioral responses to light onset (locomotor and background adaptation), the normal slow-phase performance may be due to compensatory mechanisms that overcome reduced retinal sensory input. It is also worth noting that torsional VOR was affected more strongly than horizontal OKR, indicating that dscaml1's effect on different subcircuits of the oculomotor system is not uniform.
Loss of dscaml1 resulted in a notable deficit in the function of the integrator pathway, both in the light and in the dark. This is most clearly seen in the fast decay of eye fixation after spontaneous saccade in dscaml1 mutants, relative to controls. Additionally, slow-phase deficits at long time scales in mutants may partly arise from the integrator pathway, which is necessary to integrate the velocity signal from the vestibular nuclei to encode a smooth ramp of eye position (Cannon and Robinson, 1987). The behavioral dysfunction observed in the mutant could arise from a deficit in the circuit connectivity within the integrator for supporting and coordinating persistent firing (Lee et al., 2015; Vishwanathan et al., 2017).
Lastly, the pronounced time-dependent fatigue (i.e., gain reduction and increased lockup during OKR) phenotypes in dscaml1 mutants are likely contributed by a combination of different pathways and broader effects beyond the oculomotor circuit. Decreased neurotransmitter release from optic nerve terminals and habituation of retinorecipient neurons have previously been shown to degrade visual response under prolonged stimulation; these mechanisms may underlie the reduced robustness in dscaml1 mutants (Smear et al., 2007; Pérez-Schuster et al., 2016). Similarly, lockup may result from changes in neuronal excitability and seizure-like episodes, analogous to what was seen in the zebrafish didy mutants (see Comparison with didy (Nav1.1b) mutants) (Schoonheim et al., 2010).
Comparison with didy (Nav1.1b) mutants
Some aspects of the dscaml1 phenotype are similar to a previously described zebrafish mutant, didy, which encodes the voltage-gated sodium channel Scn1lab (Nav1.1b) (Schoonheim et al., 2010). After 15 s of continuous OKR stimulation, didy mutants cease to initiate resetting saccades, resulting in lockup of the eyes. Another similarity between didy and dscaml1 is defective light adaptation (darker pigmentation, slow response to light stimulus). didy and dscaml1 may both affect the saccadic pathway, which progressively loses excitability in didy mutants. It is important to note, however, that the saccade phenotypes are distinct between didy and dscaml1. In didy animals, saccades have normal speed and amplitude (Schoonheim et al., 2010), whereas saccades in dscaml1 animals are slower and smaller, compared with controls. Furthermore, lockup events in dscaml1 mutants occur more sporadically and across the position range, whereas lockup only occurs at the most eccentric position at the end of a slow phase in didy mutants. These distinctions suggest that didy and dscaml1 likely affect saccade generation through independent mechanisms.
Relevance to human oculomotor disorder
dscaml1 mutant fish share several features of COMA: smaller saccade amplitudes, relatively normal main sequence, and intermittent lockup during horizontal OKR. COMA is an infantile-onset condition involving the failure of both voluntary and reflexive saccadic eye movements (Zee et al., 1977; Harris et al., 1996; Salman, 2015). The early onset of the disease suggests that it is developmental in origin, but the etiology of COMA remains poorly understood. The phenotypic similarities between dscaml1 mutants and COMA raise the possibility that there may be common underlying developmental deficits in either the visual or oculomotor circuits. Genomic regions surrounding the causative gene for juvenile nephronophthisis (NPHP1) have been suggested to contribute to COMA, but mutations in NPHP1 itself do not consistently cause COMA (Betz et al., 2000). NPHP1 has been linked to primary cilia function, which is crucial for the development of the cerebellum, a critical region involved in saccade control (Louie and Gleeson, 2005; Jauregui et al., 2008; Matsui et al., 2014). Although there is currently no genetic association between human DSCAML1 and COMA, further analysis of the dscaml1 mutants (e.g., cerebellum and extraocular motor neurons) may provide insights into the pathogenesis of COMA and the development of neural circuitry for saccades in general.
In conclusion, our investigations in zebrafish have revealed the functional consequences in visuomotor behavior and subcircuit activity resulting from the genetic lesion of dscaml1. Given the structural conservation of subcortical circuits and the functional conservation of dscaml1's roles in retinal patterning, it is plausible that the mammalian DSCAML1 will also contribute to the establishment of visuomotor behaviors. We recorded oculomotor circuit output dynamics in behaving animals and uncovered a specific dependence of the saccade pathway on dscaml1. Our physiological findings in both control and mutant contexts provide a neural basis for the saccade deficits seen in dscaml1 mutants and potentially for COMA. Our broad examination of oculomotor behaviors also revealed dscaml1's function in VOR, neural integration, and behavioral robustness. These behavioral characterizations will facilitate future studies on the link between dscaml1 and the development and disorders of sensorimotor circuits.
Footnotes
This work was supported by National Institutes of Health R01 EY024844 to Y.A.P., K99 EY027017 to A.D.R., R01 EY027036 and R01 NS104926 to E.R.F.A., Simons Global Brain Initiative 180073 to E.R.F.A., Center for Innovative Technology ER14S-001-LS to Y.A.P., the Medical College of Georgia, and Virginia Tech. We thank the animal care staff at Augusta University and Virginia Tech for animal husbandry; the Augusta University Electron Microscopy and Histology Core for retina histology preparation; Andrea Pauli for help generating the dscaml1 TALEN mutants; Jonathan Mathias for assistance with locomotor behavior analysis; Farrah Ali for technical assistance; and Kathryn Bollinger and Joshua Sanes for helpful discussions.
J.K.J. has financial interests in Beam Therapeutics, Editas Medicine, Pairwise Plants, Poseida Therapeutics, Transposagen Biopharmaceuticals, and Verve Therapeutics. J.K.J.'s interests were reviewed and are managed by Massachusetts General Hospital and Partners HealthCare in accordance with their conflict-of-interest policies. J.K.J. holds equity in Excelsior Genomics. J.K.J. is a member of the Board of Directors of the American Society of Gene and Cell Therapy. J.K.J. is a coinventor on various patents and patent applications that describe gene editing and epigenetic editing technologies. The remaining authors declare no competing financial interests.
References
- Anderson TJ, MacAskill MR (2013) Eye movements in patients with neurodegenerative disorders. Nat Rev Neurol 9:74–85. 10.1038/nrneurol.2012.273 [DOI] [PubMed] [Google Scholar]
- Beck JC, Gilland E, Tank DW, Baker R (2004) Quantifying the ontogeny of optokinetic and vestibuloocular behaviors in zebrafish, medaka, and goldfish. J Neurophysiol 92:3546–3561. 10.1152/jn.00311.2004 [DOI] [PubMed] [Google Scholar]
- Betz R, Rensing C, Otto E, Mincheva A, Zehnder D, Lichter P, Hildebrandt F (2000) Children with ocular motor apraxia type Cogan carry deletions in the gene (NPHP1) for juvenile nephronophthisis. J Pediatr 136:828–831. 10.1016/S0022-3476(00)01001-5 [DOI] [PubMed] [Google Scholar]
- Bianco IH, Kampff AR, Engert F (2011) Prey capture behavior evoked by simple visual stimuli in larval zebrafish. Front Syst Neurosci 5:101. 10.3389/fnsys.2011.00101 [DOI] [PMC free article] [PubMed] [Google Scholar]
- Bittencourt J, Velasques B, Teixeira S, Basile LF, Salles JI, Nardi AE, Budde H, Cagy M, Piedade R, Ribeiro P (2013) Saccadic eye movement applications for psychiatric disorders. Neuropsychiatr Dis Treat 9:1393–1409. 10.2147/NDT.S45931 [DOI] [PMC free article] [PubMed] [Google Scholar]
- Blank M, Fuerst PG, Stevens B, Nouri N, Kirkby L, Warrier D, Barres BA, Feller MB, Huberman AD, Burgess RW, Garner CC (2011) The Down syndrome critical region regulates retinogeniculate refinement. J Neurosci 31:5764–5776. 10.1523/JNEUROSCI.6015-10.2011 [DOI] [PMC free article] [PubMed] [Google Scholar]
- Bruce FM, Brown S, Smith JN, Fuerst PG, Erskine L (2017) DSCAM promotes axon fasciculation and growth in the developing optic pathway. Proc Natl Acad Sci U S A 114:1702–1707. 10.1073/pnas.1618606114 [DOI] [PMC free article] [PubMed] [Google Scholar]
- Büttner U, Büttner-Ennever JA (2006) Present concepts of oculomotor organization. Prog Brain Res 151:1–42. 10.1016/S0079-6123(05)51001-X [DOI] [PubMed] [Google Scholar]
- Cannon SC, Robinson DA (1987) Loss of the neural integrator of the oculomotor system from brain stem lesions in monkey. J Neurophysiol 57:1383–1409. 10.1152/jn.1987.57.5.1383 [DOI] [PubMed] [Google Scholar]
- Chen CC, Bockisch CJ, Bertolini G, Olasagasti I, Neuhauss SC, Weber KP, Straumann D, Ying-Yu Huang M (2014) Velocity storage mechanism in zebrafish larvae. J Physiol 592:203–214. 10.1113/jphysiol.2013.258640 [DOI] [PMC free article] [PubMed] [Google Scholar]
- Chen CC, Bockisch CJ, Straumann D, Huang MY (2016) Saccadic and postsaccadic disconjugacy in zebrafish larvae suggests independent eye movement control. Front Syst Neurosci 10:80. 10.3389/fnsys.2016.00080 [DOI] [PMC free article] [PubMed] [Google Scholar]
- Daie K, Goldman MS, Aksay ER (2015) Spatial patterns of persistent neural activity vary with the behavioral context of short-term memory. Neuron 85:847–860. 10.1016/j.neuron.2015.01.006 [DOI] [PMC free article] [PubMed] [Google Scholar]
- Easter SS Jr, Nicola GN (1997) The development of eye movements in the zebrafish (Danio rerio). Dev Psychobiol 31:267–276. 10.1002/(SICI)1098-2302(199712)31:4<267::AID-DEV4>3.0.CO;2-P [DOI] [PubMed] [Google Scholar]
- Editorial (2018) Recommendations for the design and analysis of in vivo electrophysiology studies. J Neurosci 38:5837–5839. 10.1523/JNEUROSCI.1480-18.2018 [DOI] [PMC free article] [PubMed] [Google Scholar]
- Emran F, Rihel J, Adolph AR, Wong KY, Kraves S, Dowling JE (2007) OFF ganglion cells cannot drive the optokinetic reflex in zebrafish. Proc Natl Acad Sci U S A 104:19126–19131. 10.1073/pnas.0709337104 [DOI] [PMC free article] [PubMed] [Google Scholar]
- Farrell TC, Cario CL, Milanese C, Vogt A, Jeong JH, Burton EA (2011) Evaluation of spontaneous propulsive movement as a screening tool to detect rescue of parkinsonism phenotypes in zebrafish models. Neurobiol Dis 44:9–18. 10.1016/j.nbd.2011.05.016 [DOI] [PMC free article] [PubMed] [Google Scholar]
- Fox MA, Sanes JR (2007) Synaptotagmin I and II are present in distinct subsets of central synapses. J Comp Neurol 503:280–296. 10.1002/cne.21381 [DOI] [PubMed] [Google Scholar]
- Fuerst PG, Bruce F, Tian M, Wei W, Elstrott J, Feller MB, Erskine L, Singer JH, Burgess RW (2009) DSCAM and DSCAML1 function in self-avoidance in multiple cell types in the developing mouse retina. Neuron 64:484–497. 10.1016/j.neuron.2009.09.027 [DOI] [PMC free article] [PubMed] [Google Scholar]
- Galicia CA, Sukeena JM, Stenkamp DL, Fuerst PG (2018) Expression patterns of dscam and sdk gene paralogs in developing zebrafish retina. Mol Vis 24:443–458. [PMC free article] [PubMed] [Google Scholar]
- Garbutt S, Harwood MR, Harris CM (2001) Comparison of the main sequence of reflexive saccades and the quick phases of optokinetic nystagmus. Br J Ophthalmol 85:1477–1483. 10.1136/bjo.85.12.1477 [DOI] [PMC free article] [PubMed] [Google Scholar]
- Garrett AM, Tadenev AL, Burgess RW (2012) DSCAMs: restoring balance to developmental forces. Front Mol Neurosci 5:86. 10.3389/fnmol.2012.00086 [DOI] [PMC free article] [PubMed] [Google Scholar]
- Garrett AM, Tadenev AL, Hammond YT, Fuerst PG, Burgess RW (2016) Replacing the PDZ-interacting C-termini of DSCAM and DSCAML1 with epitope tags causes different phenotypic severity in different cell populations. eLife 5:e16144. 10.7554/eLife.16144 [DOI] [PMC free article] [PubMed] [Google Scholar]
- Harris CM, Shawkat F, Russell-Eggitt I, Wilson J, Taylor D (1996) Intermittent horizontal saccade failure ('ocular motor apraxia') in children. Br J Ophthalmol 80:151–158. 10.1136/bjo.80.2.151 [DOI] [PMC free article] [PubMed] [Google Scholar]
- Higashijima S, Hotta Y, Okamoto H (2000) Visualization of cranial motor neurons in live transgenic zebrafish expressing green fluorescent protein under the control of the islet-1 promoter/enhancer. J Neurosci 20:206–218. 10.1523/JNEUROSCI.20-01-00206.2000 [DOI] [PMC free article] [PubMed] [Google Scholar]
- Hoon M, Okawa H, Della Santina L, Wong RO (2014) Functional architecture of the retina: development and disease. Prog Retin Eye Res 42:44–84. 10.1016/j.preteyeres.2014.06.003 [DOI] [PMC free article] [PubMed] [Google Scholar]
- Iossifov I, O'Roak BJ, Sanders SJ, Ronemus M, Krumm N, Levy D, Stessman HA, Witherspoon KT, Vives L, Patterson KE, Smith JD, Paeper B, Nickerson DA, Dea J, Dong S, Gonzalez LE, Mandell JD, Mane SM, Murtha MT, Sullivan CA, et al. (2014) The contribution of de novo coding mutations to autism spectrum disorder. Nature 515:216–221. 10.1038/nature13908 [DOI] [PMC free article] [PubMed] [Google Scholar]
- Jauregui AR, Nguyen KC, Hall DH, Barr MM (2008) The Caenorhabditis elegans nephrocystins act as global modifiers of cilium structure. J Cell Biol 180:973–988. 10.1083/jcb.200707090 [DOI] [PMC free article] [PubMed] [Google Scholar]
- Karaca E, Harel T, Pehlivan D, Jhangiani SN, Gambin T, Coban Akdemir Z, Gonzaga-Jauregui C, Erdin S, Bayram Y, Campbell IM, Hunter JV, Atik MM, Van Esch H, Yuan B, Wiszniewski W, Isikay S, Yesil G, Yuregir OO, Tug Bozdogan S, Aslan H, et al. (2015) Genes that affect brain structure and function identified by rare variant analyses of Mendelian neurologic disease. Neuron 88:499–513. 10.1016/j.neuron.2015.09.048 [DOI] [PMC free article] [PubMed] [Google Scholar]
- Kawashima T, Zwart MF, Yang CT, Mensh BD, Ahrens MB (2016) The serotonergic system tracks the outcomes of actions to mediate short-term motor learning. Cell 167:933–946.e20. 10.1016/j.cell.2016.09.055 [DOI] [PubMed] [Google Scholar]
- Kimmel CB, Ballard WW, Kimmel SR, Ullmann B, Schilling TF (1995) Stages of embryonic development of the zebrafish. Dev Dyn 203:253–310. 10.1002/aja.1002030302 [DOI] [PubMed] [Google Scholar]
- Kubo F, Hablitzel B, Dal Maschio M, Driever W, Baier H, Arrenberg AB (2014) Functional architecture of an optic flow-responsive area that drives horizontal eye movements in zebrafish. Neuron 81:1344–1359. 10.1016/j.neuron.2014.02.043 [DOI] [PubMed] [Google Scholar]
- Lauter G, Söll I, Hauptmann G (2011) Multicolor fluorescent in situ hybridization to define abutting and overlapping gene expression in the embryonic zebrafish brain. Neural Dev 6:10. 10.1186/1749-8104-6-10 [DOI] [PMC free article] [PubMed] [Google Scholar]
- Lee MM, Arrenberg AB, Aksay ER (2015) A structural and genotypic scaffold underlying temporal integration. J Neurosci 35:7903–7920. 10.1523/JNEUROSCI.3045-14.2015 [DOI] [PMC free article] [PubMed] [Google Scholar]
- Leigh RJ, Zee DS (2015) The neurology of eye movements, Ed 5 Oxford: Oxford UP. [Google Scholar]
- Louie CM, Gleeson JG (2005) Genetic basis of Joubert syndrome and related disorders of cerebellar development. Hum Mol Genet 14:R235–R242. 10.1093/hmg/ddi264 [DOI] [PubMed] [Google Scholar]
- Maack G, Segner H (2003) Morphological development of the gonads in zebrafish. J Fish Biol 62:895–906. 10.1046/j.1095-8649.2003.00074.x [DOI] [Google Scholar]
- Masseck OA, Hoffmann KP (2009) Comparative neurobiology of the optokinetic reflex. Ann N Y Acad Sci 1164:430–439. 10.1111/j.1749-6632.2009.03854.x [DOI] [PubMed] [Google Scholar]
- Matsui H, Namikawa K, Babaryka A, Köster RW (2014) Functional regionalization of the teleost cerebellum analyzed in vivo. Proc Natl Acad Sci U S A 111:11846–11851. 10.1073/pnas.1403105111 [DOI] [PMC free article] [PubMed] [Google Scholar]
- Maurer CM, Schönthaler HB, Mueller KP, Neuhauss SC (2010) Distinct retinal deficits in a zebrafish pyruvate dehydrogenase-deficient mutant. J Neurosci 30:11962–11972. 10.1523/JNEUROSCI.2848-10.2010 [DOI] [PMC free article] [PubMed] [Google Scholar]
- Maynard KR, Stein E (2012) DSCAM contributes to dendrite arborization and spine formation in the developing cerebral cortex. J Neurosci 32:16637–16650. 10.1523/JNEUROSCI.2811-12.2012 [DOI] [PMC free article] [PubMed] [Google Scholar]
- Mensh BD, Aksay E, Lee DD, Seung HS, Tank DW (2004) Spontaneous eye movements in goldfish: oculomotor integrator performance, plasticity, and dependence on visual feedback. Vision Res 44:711–726. 10.1016/j.visres.2003.10.015 [DOI] [PubMed] [Google Scholar]
- Miri A, Daie K, Burdine RD, Aksay E, Tank DW (2011a) Regression-based identification of behavior-encoding neurons during large-scale optical imaging of neural activity at cellular resolution. J Neurophysiol 105:964–980. 10.1152/jn.00702.2010 [DOI] [PMC free article] [PubMed] [Google Scholar]
- Miri A, Daie K, Arrenberg AB, Baier H, Aksay E, Tank DW (2011b) Spatial gradients and multidimensional dynamics in a neural integrator circuit. Nat Neurosci 14:1150–1159. 10.1038/nn.2888 [DOI] [PMC free article] [PubMed] [Google Scholar]
- Mueller KP, Schnaedelbach OD, Russig HD, Neuhauss SC (2011) VisioTracker, an innovative automated approach to oculomotor analysis. J Vis Exp 56:3556. 10.3791/3556 [DOI] [PMC free article] [PubMed] [Google Scholar]
- Nevin LM, Taylor MR, Baier H (2008) Hardwiring of fine synaptic layers in the zebrafish visual pathway. Neural Dev 3:36. 10.1186/1749-8104-3-36 [DOI] [PMC free article] [PubMed] [Google Scholar]
- Pan YA, Choy M, Prober DA, Schier AF (2012) Robo2 determines subtype-specific axonal projections of trigeminal sensory neurons. Development 139:591–600. 10.1242/dev.076588 [DOI] [PMC free article] [PubMed] [Google Scholar]
- Pan YA, Freundlich T, Weissman TA, Schoppik D, Wang XC, Zimmerman S, Ciruna B, Sanes JR, Lichtman JW, Schier AF (2013) Zebrabow: multispectral cell labeling for cell tracing and lineage analysis in zebrafish. Development 140:2835–2846. 10.1242/dev.094631 [DOI] [PMC free article] [PubMed] [Google Scholar]
- Pérez-Schuster V, Kulkarni A, Nouvian M, Romano SA, Lygdas K, Jouary A, Dipoppa M, Pietri T, Haudrechy M, Candat V, Boulanger-Weill J, Hakim V, Sumbre G (2016) Sustained rhythmic brain activity underlies visual motion perception in zebrafish. Cell Rep 17:1098–1112. 10.1016/j.celrep.2016.09.065 [DOI] [PMC free article] [PubMed] [Google Scholar]
- Prober DA, Rihel J, Onah AA, Sung RJ, Schier AF (2006) Hypocretin/orexin overexpression induces an insomnia-like phenotype in zebrafish. J Neurosci 26:13400–13410. 10.1523/JNEUROSCI.4332-06.2006 [DOI] [PMC free article] [PubMed] [Google Scholar]
- Randlett O, Wee CL, Naumann EA, Nnaemeka O, Schoppik D, Fitzgerald JE, Portugues R, Lacoste AM, Riegler C, Engert F, Schier AF (2015) Whole-brain activity mapping onto a zebrafish brain atlas. Nat Methods 12:1039–1046. 10.1038/nmeth.3581 [DOI] [PMC free article] [PubMed] [Google Scholar]
- Reyon D, Tsai SQ, Khayter C, Foden JA, Sander JD, Joung JK (2012) FLASH assembly of TALENs for high-throughput genome editing. Nat Biotechnol 30:460–465. 10.1038/nbt.2170 [DOI] [PMC free article] [PubMed] [Google Scholar]
- Rinner O, Rick JM, Neuhauss SC (2005) Contrast sensitivity, spatial and temporal tuning of the larval zebrafish optokinetic response. Invest Ophthalmol Vis Sci 46:137–142. 10.1167/iovs.04-0682 [DOI] [PubMed] [Google Scholar]
- Robles E, Laurell E, Baier H (2014) The retinal projectome reveals brain-area-specific visual representations generated by ganglion cell diversity. Curr Biol 24:2085–2096. 10.1016/j.cub.2014.07.080 [DOI] [PubMed] [Google Scholar]
- Ross LS, Parrett T, Easter SS Jr (1992) Axonogenesis and morphogenesis in the embryonic zebrafish brain. J Neurosci 12:467–482. 10.1523/JNEUROSCI.12-02-00467.1992 [DOI] [PMC free article] [PubMed] [Google Scholar]
- Salas C, Herrero L, Rodriguez F, Torres B (1997) Tectal codification of eye movements in goldfish studied by electrical microstimulation. Neuroscience 78:271–288. 10.1016/S0306-4522(97)83048-5 [DOI] [PubMed] [Google Scholar]
- Salman MS. (2015) Infantile-onset saccade initiation delay (congenital ocular motor apraxia). Curr Neurol Neurosci Rep 15:24. 10.1007/s11910-015-0543-3 [DOI] [PubMed] [Google Scholar]
- Sander JD, Cade L, Khayter C, Reyon D, Peterson RT, Joung JK, Yeh JR (2011) Targeted gene disruption in somatic zebrafish cells using engineered TALENs. Nat Biotechnol 29:697–698. 10.1038/nbt.1934 [DOI] [PMC free article] [PubMed] [Google Scholar]
- Scheetz SD, Shao E, Zhou Y, Cario CL, Bai Q, Burton EA (2018) An open-source method to analyze optokinetic reflex responses in larval zebrafish. J Neurosci Methods 293:329–337. 10.1016/j.jneumeth.2017.10.012 [DOI] [PMC free article] [PubMed] [Google Scholar]
- Schindelin J, Arganda-Carreras I, Frise E, Kaynig V, Longair M, Pietzsch T, Preibisch S, Rueden C, Saalfeld S, Schmid B, Tinevez JY, White DJ, Hartenstein V, Eliceiri K, Tomancak P, Cardona A (2012) Fiji: an open-source platform for biological-image analysis. Nat Methods 9:676–682. 10.1038/nmeth.2019 [DOI] [PMC free article] [PubMed] [Google Scholar]
- Schmitt EA, Dowling JE (1999) Early retinal development in the zebrafish, Danio rerio: light and electron microscopic analyses. J Comp Neurol 404:515–536. 10.1002/(SICI)1096-9861(19990222)404:4<515::AID-CNE8>3.0.CO;2-A [DOI] [PubMed] [Google Scholar]
- Schoonheim PJ, Arrenberg AB, Del Bene F, Baier H (2010) Optogenetic localization and genetic perturbation of saccade-generating neurons in zebrafish. J Neurosci 30:7111–7120. 10.1523/JNEUROSCI.5193-09.2010 [DOI] [PMC free article] [PubMed] [Google Scholar]
- Schoppik D, Bianco IH, Prober DA, Douglass AD, Robson DN, Li JM, Greenwood JS, Soucy E, Engert F, Schier AF (2017) Gaze-stabilizing central vestibular neurons project asymmetrically to extraocular motoneuron pools. J Neurosci 37:11353–11365. 10.1523/JNEUROSCI.1711-17.2017 [DOI] [PMC free article] [PubMed] [Google Scholar]
- Schroeter EH, Wong RO, Gregg RG (2006) In vivo development of retinal ON-bipolar cell axonal terminals visualized in nyx::MYFP transgenic zebrafish. Vis Neurosci 23:833–843. 10.1017/S0952523806230219 [DOI] [PubMed] [Google Scholar]
- Scudder CA, Kaneko CS, Fuchs AF (2002) The brainstem burst generator for saccadic eye movements: a modern synthesis. Exp Brain Res 142:439–462. 10.1007/s00221-001-0912-9 [DOI] [PubMed] [Google Scholar]
- Sklavos S, Dimitrova DM, Goldberg SJ, Porrill J, Dean P (2006) Long time-constant behavior of the oculomotor plant in barbiturate-anesthetized primate. J Neurophysiol 95:774–782. 10.1152/jn.00584.2005 [DOI] [PubMed] [Google Scholar]
- Smear MC, Tao HW, Staub W, Orger MB, Gosse NJ, Liu Y, Takahashi K, Poo MM, Baier H (2007) Vesicular glutamate transport at a central synapse limits the acuity of visual perception in zebrafish. Neuron 53:65–77. 10.1016/j.neuron.2006.12.013 [DOI] [PMC free article] [PubMed] [Google Scholar]
- Straka H, Beck JC, Pastor AM, Baker R (2006) Morphology and physiology of the cerebellar vestibulolateral lobe pathways linked to oculomotor function in the goldfish. J Neurophysiol 96:1963–1980. 10.1152/jn.00334.2006 [DOI] [PubMed] [Google Scholar]
- Vishwanathan A, Daie K, Ramirez AD, Lichtman JW, Aksay ER, Seung HS (2017) Electron microscopic reconstruction of functionally identified cells in a neural integrator. Curr Biol 27:2137–2147.e3. 10.1016/j.cub.2017.06.028 [DOI] [PMC free article] [PubMed] [Google Scholar]
- Vladimirov N, Mu Y, Kawashima T, Bennett DV, Yang CT, Looger LL, Keller PJ, Freeman J, Ahrens MB (2014) Light-sheet functional imaging in fictively behaving zebrafish. Nat Methods 11:883–884. 10.1038/nmeth.3040 [DOI] [PubMed] [Google Scholar]
- Wagle M, Mathur P, Guo S (2011) Corticotropin-releasing factor critical for zebrafish camouflage behavior is regulated by light and sensitive to ethanol. J Neurosci 31:214–224. 10.1523/JNEUROSCI.3339-10.2011 [DOI] [PMC free article] [PubMed] [Google Scholar]
- Wan L, Almers W, Chen W (2005) Two ribeye genes in teleosts: the role of ribeye in ribbon formation and bipolar cell development. J Neurosci 25:941–949. 10.1523/JNEUROSCI.4657-04.2005 [DOI] [PMC free article] [PubMed] [Google Scholar]
- Wilson CA, High SK, McCluskey BM, Amores A, Yan YL, Titus TA, Anderson JL, Batzel P, Carvan MJ 3rd, Schartl M, Postlethwait JH (2014) Wild sex in zebrafish: loss of the natural sex determinant in domesticated strains. Genetics 198:1291–1308. 10.1534/genetics.114.169284 [DOI] [PMC free article] [PubMed] [Google Scholar]
- Yamagata M, Sanes JR (2008) Dscam and sidekick proteins direct lamina-specific synaptic connections in vertebrate retina. Nature 451:465–469. 10.1038/nature06469 [DOI] [PubMed] [Google Scholar]
- Zee DS, Yee RD, Singer HS (1977) Congenital ocular motor apraxia. Brain 100:581–599. 10.1093/brain/100.3.581 [DOI] [PubMed] [Google Scholar]
- Zhang L, Huang Y, Chen JY, Ding YQ, Song NN (2015) DSCAM and DSCAML1 regulate the radial migration and callosal projection in developing cerebral cortex. Brain Res 1594:61–70. 10.1016/j.brainres.2014.10.060 [DOI] [PubMed] [Google Scholar]
- Zolessi FR, Poggi L, Wilkinson CJ, Chien CB, Harris WA (2006) Polarization and orientation of retinal ganglion cells in vivo. Neural Dev 1:2. 10.1186/1749-8104-1-2 [DOI] [PMC free article] [PubMed] [Google Scholar]
Associated Data
This section collects any data citations, data availability statements, or supplementary materials included in this article.
Supplementary Materials
OKR response. Control (left) and dscaml1−/− (right) animals performing OKR.