

Abstract
Background:
Prescription drug misuse (PDM) is most prevalent during young adulthood. We aimed to identify PDM trajectories for three classes (opioids, stimulants, sedatives/tranquilizers) from adolescence into adulthood, assess the extent to which different trajectories are associated with substance use disorder (SUD) symptoms, and identity factors associated with high-risk PDM trajectories.
Methods:
Nationally representative probability samples of 51,223 U.S. adolescents were followed longitudinally across eight waves from age 18 (cohorts 1976–1996) to age 35. Data were collected via self-administered paper questionnaires.
Findings:
Five PDM trajectories were identified and the defining characteristic that differentiated the five PDM trajectories was the age when past-year PDM high-frequency peaked: (1) rare misuse, (2) age 18 peak, (3) ages 19–20 peak, (4) ages 23–24 peak, and (5) ages 27–28 peak. Similar PDM trajectories were identified for each prescription drug class. However, the later peak misuse trajectory for sedatives/tranquilizers crested at an older age (age 35) than for the other classes. PDM trajectories, regardless of peak age, were all associated with significantly greater odds of having 2+ SUD symptoms at age 35, especially the later peak trajectories. In controlled analyses, risk factors associated with the high-risk latest peak PDM trajectory (e.g., ages 27–28) included high school heavy drinking, cigarette smoking, marijuana use, poly-PDM, White race, and not completing college.
Interpretation:
PDM trajectories are heterogeneous and any high-frequency PDM is a strong signal for SUD during adulthood, especially later peak PDM trajectories. The findings may help practitioners identify individuals at greatest risk for SUD and target intervention strategies.
Funding:
National Institute on Drug Abuse, National Institutes of Health.
Keywords: Adolescence, Prescription Drugs, Non-medical Use, Longitudinal, Prescription Opioids, Prescription Sedatives, Prescription Stimulants, Young Adulthood
Introduction
Prescription drug misuse (PDM) represents a worldwide public health concern, particularly in high-income countries such as the U.S.1–5 PDM-related consequences such as emergency room visits and overdoses are most prevalent in middle adulthood and have significantly increased over the past two decades.3–4 Approximately one in every seven (14·4%) individuals aged 18–25 in the U.S. report past-year PDM (7·2% prescription opioids, 7·4% prescription stimulants, and 5·5% prescription tranquilizers).5–7 There is a legitimate concern that the high prevalence of PDM places many adolescents and young adults at great risk for developing substance use disorder (SUD) symptoms and other adverse outcomes.8–10 Based on the high addiction potential associated with PDM, adolescents and young adults may not mature out of PDM in the same way that they mature out of other experimental substance use.11 Below, we briefly highlight the most commonly misused prescription medication classes: prescription opioids, stimulants, and sedatives/tranquilizers.
Prescription opioids:
Prescription opioid misuse is a significant cause of concern. Multiple studies have shown youth initiate prescription opioid misuse as early as elementary and middle school, where youth typically obtain prescription opioids from a friend or from their own leftover prescriptions to relieve physical pain.12–14 Adolescents who misuse prescription opioids are most likely to co-ingest prescription opioids with marijuana and alcohol, followed by cocaine and benzodiazepines.15 Several characteristics associated with prescription opioid misuse (e.g., frequency, co-ingestion, multiple opioids) have been shown to increase the risk of SUD symptoms.16 While most youth cease prescription opioid misuse over time, there is evidence that about one-third continue to misuse prescription opioids, placing themselves at high risk for adverse consequences such as overdose and SUD.12,16
Prescription stimulants:
Prescription stimulant misuse is most likely to be initiated during late adolescence, with some youth starting as early as elementary and middle school.13,14 Adolescents typically obtain these medications for free or buy them from a friend.13,14 Among young adults, full-time college students and college graduates have the highest prescription stimulant misuse rates.10,17 Approximately one in ten U.S. college students has engaged in past-year prescription stimulant misuse; the majority of these individuals have co-ingested with other substances, most often alcohol.10,17 While academic enhancement is the most prevalent motivation for prescription stimulant misuse among youth without attention deficit hyperactivity disorder, there is no evidence to support the efficacy of prescription stimulants to improve academic performance in real-world settings among youth without attention deficit hyperactivity disorder.18 A longitudinal study followed college students from one university and found that those who used prescription stimulants nonmedically were more likely to develop alcohol and cannabis use disorder symptoms over a four-year period.18
Prescription sedatives/tranquilizers:
Less longitudinal research has been done on prescription sedative/tranquilizer misuse among adolescents and young adults relative to other prescription classes.19 Youth are most likely to initiate prescription sedative/tranquilizer misuse during high school and most often obtain these medications for free from their friends to relax.13,14 Based on cross-sectional studies, prescription sedative/tranquilizer misuse is most prevalent during young adulthood,7,14 especially among young adults not attending college.10,17 Prescription sedative/tranquilizer misuse during adolescence often involves co-ingestion with alcohol and marijuana and has been shown to result in high-risk behavior such as impaired driving.20,21
Polysubstance use:
Polysubstance use involving prescription drugs and other substances is most prevalent among adolescents and young adults.7,12,21 A regional study followed first graders through age 21 and found that all individuals who reported heavy nonmedical prescription opioid misuse (i.e., ten times or more per year) had also used marijuana and other drugs.12 These findings reinforce the importance of taking into account frequency and polysubstance use when studying PDM trajectories. In addition, approximately 72·6% of adolescent prescription sedative/tranquilizer misusers have co-ingested with other substances including alcohol, marijuana, prescription opioids, and prescription stimulants.21 Co-ingestion of prescription drugs with other substances can have super-additive effects and increase the risk of acute and long-term substance-related consequences.16 The high rates of polysubstance use associated with PDM supports examining trajectories that combine prescription drug classes and assessing a wide range of substance-related consequences to account for the overlap in PDM and other substances.
Short-term longitudinal studies have examined the course of PDM during distinct developmental periods (e.g., adolescence or young adulthood) or for individual prescription drug classes.12,22 Although cross-sectional and short-term longitudinal studies are valuable, long-term longitudinal research is needed to understand PDM trajectories from adolescence to adulthood across multiple prescription drug classes (i.e., opioids, stimulants, and sedatives/tranquilizers), consider long-term associations with SUD symptoms, and determine the characteristics of PDM trajectories that are most problematic. Solely focusing on individual prescription drug classes and related consequences can obscure poly-PDM phenomena. To address key gaps in the literature, the main objectives of the present study are to (1) assess long-term PDM trajectories for three medication classes (opioids, stimulants, and sedatives/tranquilizers) from late adolescence (age 18) through adulthood (age 35), (2) examine the extent to which different long-term PDM trajectories are associated with SUD symptoms at age 35, and (3) identify risk factors associated with high-risk PDM trajectories.
Methods
Data and sample
The current study uses national U.S. panel data from the Monitoring the Future (MTF) study.17 Based on a three-stage sampling procedure, MTF surveyed nationally representative samples of approximately 17,000 U.S. high school seniors each year since 1975 using questionnaires administered in classrooms. Stage one was the selection of geographic areas; stage two was the selection of schools; and stage three was the selection of students within each school. Approximately 2,450 high school seniors (modal age 18) were randomly selected each year for biennial follow-ups and surveyed using mailed questionnaires through age 30, with one random half of each cohort starting biennial surveys at age 19 and the other random half starting at age 20 (for each cohort, the two halves were combined such that age 19 and 20 surveys constitute wave 2, etc). All respondents were also followed up at age 35. At each wave, all surveys contained measures regarding PDM (i.e., for opioids, stimulants, and sedatives/tranquilizers).
The analytic sample (n = 51,223) included 21 cohorts of high school seniors (cohorts 1976 through 1996) who were surveyed for eight waves at modal ages 18 (12th grade), 19/20, 21/22, 23/24, 25/26, 27/28, 29/30, and 35. Table 1 shows the sociodemographic characteristics of the analytic sample. The student response rates at baseline over the study period ranged from 77% to 86%. Most nonresponse was due to the respondent being absent (less than 1% refused to participate). The MTF panel oversamples drug users from the 12th-grade sample to secure a population of drug users to follow into adulthood (appropriate weights are then used to best approximate population estimates in the follow-up). The overall weighted retention rate for the longitudinal sample from baseline (12th grade) to age 35 was 54%. To help correct for potential attrition bias consistent with other MTF panel analyses,22–24 we incorporated attrition weights to account for respondent characteristics associated with nonresponse at follow-up. The MTF project design, protocol, and sampling methods are described in greater detail elsewhere.17 http://www.monitoringthefuture.org//pubs/monographs/mtf-vol2_2017.pdf
Table 1:
Descriptive information for the sample
| n = 51,223 | ||
|---|---|---|
| n (%) | n (% missing) | |
| Baseline variables (age 18) | ||
| Sex | ||
| Male | 25254 (48.3%) | 6 (0.01%) |
| Female | 25963 (51.7%) | |
| Race/ethnicity | ||
| White | 39068 (75.6%) | |
| African-American | 5443 (12.1%) | 626 (1.2%) |
| Hispanic | 2991 (6.2%) | |
| Other | 3095 (6.1%) | |
| Grade point average | ||
| B- or higher | 35565 (74.2%) | 1669 (3.3%) |
| C+ or lower | 13989 (25.8%) | |
| College plans | ||
| No | 28759 (56.9%) | 3081 (6.0%) |
| Yes | 19383 (43.1%) | |
| Parental level of education | ||
| Less than a college degree | 29648 (59.8%) | 1821 (3.6%) |
| College degree or higher | 19754 (40.2%) | |
| Cigarette use (30-day) | ||
| No | 31489 (69.5%) | 864 (1.7%) |
| Yes | 18870 (30.5%) | |
| Binge drinking (2 weeks) | ||
| No | 28042 (65.5%) | 2731 (5.3%) |
| Yes | 20450 (34.4%) | |
| Cannabis use (30-day) | ||
| No | 32921 (77.0%) | 1416 (2.8%) |
| Yes | 16886 (33.0%) | |
| Urbanicity | ||
| Large MSA (Urban) | 13416 (25.8%) | |
| Other MSA (Suburban) | 23218 (45.4%) | 0 (0.0%) |
| Non-MSA (Rural) | 14588 (28.9%) | |
| U.S. region | ||
| Northeast | 11266 (21.4%) | |
| Midwest | 14516 (28.0%) | 0 (0.0%) |
| South | 16375 (33.1%) | |
| West | 9065 (17.5%) | |
| Cohort year | ||
| 1976–1982 | 16784 (30.3%) | |
| 1983–1988 | 17192 (33.6%) | 0 (0.0%) |
| 1990–1996 | 17247 (36.1%) |
Notes: Unweighted sample sizes are provided. All estimates (percentages) provided use weights to adjust for oversampling of drug users into the longitudinal panel.
Measures
Prescription drug misuse was measured at each wave with identical questions based on separate measures assessing past-year nonmedical use of opioids, stimulants, and sedatives/tranquilizers (i.e., “…taken any…on your own—that is, without a doctor telling you to take them?”). Respondents were provided a list of several examples for each of the prescription drug classes (e.g., hydrocodone, oxycodone, and codeine for prescription opioids; methylphenidate and dexamfetamine for prescription stimulants; and diazepam and chlordiazepoxide for prescription sedatives/tranquilizers). The response scales for the questions ranged from (1) No occasions to (7) 40 or more occasions. This measure was treated as a continuous variable in the analyses to assess mean frequency. Moreover, an additional measure was created to assess the mean frequency of any PDM using a max.1 approach (i.e., the maximum frequency score across the three prescription drug classes was used for each wave).
SUD symptoms at age 35 were measured with several questions based on the DSM criteria for alcohol use disorder (AUD), cannabis use disorder (CUD), and opioid/other drug use disorder (ODUD). Respondents were asked to report SUD symptoms over the past five years related to AUD, CUD, and ODUD. Fifteen items were used to characterize eight of the 11 DSM-5 criteria that define AUD, CUD, and ODUD: (1) Substance use resulting in a failure to fulfill major role obligations; (2) Continued substance use when physically hazardous; (3) Continued substance use despite persistent or recurrent interpersonal or social problems; (4) Tolerance; (5) Withdrawal; (6) Persistent desire or unsuccessful efforts to cut down substance use; (7) Health-related issue(s) due to substance use; and (8) Craving. Criteria were summed to obtain an overall number of criteria endorsed for AUD, CUD, and ODUD, as well as any SUD. Although these measures of SUD symptoms do not yield a clinical diagnosis, the items we used are consistent with the way SUD has been measured in other large-scale surveys25–27 and reflects DSM-IV and DSM-5 AUD and CUD symptoms.23,24 We followed recommended practice that any use disorder (including mild, moderate, or severe) was indicated by meeting two or more of the criteria, resulting in estimates closely resembling other national estimates for similar age groups.28,29
Sociodemographic variables and substance use behaviors at baseline (age 18) included the following: sex (male, female), race/ethnicity (White, African-American, Hispanic, Other), U.S. Census geographic region (Northeast, Midwest, South, West), urbanicity based on metropolitan statistical area (Large MSA, MSA, Non-MSA), parental education (at least one versus no parent graduated from a four-year college), college aspirations while in 12th grade (would versus would not definitely graduate from a four-year college), average grade in high school (C+ or lower, B- or higher), cohort year (1976–1982, 1983–1989, 1990–1996), past 30-day cigarette use, past two-week binge drinking, and past 30-day marijuana use. Moreover, an additional measure was included to assess if respondents graduated from a four-year college by age 35.
Data analysis
The analysis included three major approaches. First, latent profile analysis was used to create general profiles of respondents’ PDM trajectories based on the major prescription drug classes (i.e., opioids, stimulants, sedatives/tranquilizers). The exploratory latent profile analysis (with no covariates) was conducted using Mplus (version 8.0; code available upon request), and model fit was compared across different class solutions separately for prescription opioids, stimulants, sedatives/tranquilizers, and the composite score for the three prescription drug classes combined. Class membership was determined using a modal approach, which involved identifying the highest posterior predicted probability of class membership for each of the respondents based on the best-fitting model.30 The resulting groups were then profiled. Second, descriptive statistics, odds ratios and adjusted odds ratios, were generated in Stata to examine the association between the trajectories (i.e., latent profiles) and prevalence of two or more SUD symptoms at age 35 based on eight DSM-5 criteria. Allowing for uncertainty in predicted class membership using three-step approaches in Mplus did not alter our conclusions.31 Third, adjusted odds ratios were then estimated in Stata to examine how the sociodemographic variables and substance use behaviors at baseline (modal age 18) were associated with each PDM trajectory.
All analyses incorporated the survey weights to account for differential probabilities of sample selection in estimation and variance estimation. For the analyses, all the respondents were included when possible. The latent profile analysis estimated in Mplus used full information likelihood estimation, meaning the majority of respondents were used to estimate the PDM trajectories. With respect to assessing the associations between PDM trajectories, SUD symptoms at age 35, and baseline characteristics, sample sizes varied across analyses due to responses with missing items. All descriptive and binary logistic analyses were conducted using STATA 15.0 (Stata Corp, College Station, Texas) and were weighted to adjust for differential attrition at age 35.24
Role of the funding source
The funders of the study had no role in study design, data collection, data analysis, data interpretation, writing, review, or approval of the manuscript. The first, second, and final authors had full access to all the data in the study and had final responsibility for the decision to submit for publication. There was no editorial direction or censorship from the sponsors.
Results
PDM trajectories from late adolescence through adulthood (Objective 1):
The results from the latent profile analysis, where model fit was assessed using both the Bayesian Information Criterion and entropy measures, indicated that a five-class solution for the eight waves assessing frequency of any PDM during the past year was determined to be the best fitting model (Supplemental Table 1). The five-class solution had the lowest Bayesian Information Criterion value (592500·779) among the six solutions and had a good entropy score (entropy=0·971) indicating good separation of the latent classes.32 The five-class solution was selected for each specific prescription drug class to facilitate comparison to the PDM trajectories for the three prescription drug classes combined and because fit indices indicated appropriateness of this solution (Supplemental Tables 2–4).
Based on the latent profile analyses, the five PDM trajectories for the three prescription drug classes combined included: (1) Rare PDM, (2) Age 18 peak PDM, (3) Ages 19–20 peak PDM, (4) Ages 23–24 peak PDM, and (5) Ages 27–28 peak PDM. The most prevalent PDM misuse trajectory was the “Rare PDM” trajectory that was characterized by no PDM or no instances of high frequency PDM over time (Figure 1 illustrates the five trajectory groups for past-year PDM between ages 18 and 35). Similar PDM trajectories were identified for each prescription drug class. However, the later peak misuse trajectory for sedatives/tranquilizers crested at a much older age than the other prescription drug classes.
Figure 1.

Trajectories of nonmedical prescription drug misuse from late adolescence to adulthood
Notes: Unweighted sample size (Any Nonmedical Prescription Drug Misuse: n = 51,112; Opioids: n = 50,964; Stimulants: n = 51,005; Sedatives/Tranquilizers: n = 51,052). Missing cases were due to non-response on any of the prescription drug misuse questions between ages 18 and 35. All estimates provided use weights to adjust for oversampling of drug users into the longitudinal panel.
PDM trajectories and SUD symptoms (Objective 2):
Relative to the “Rare PDM” trajectory, when controlling for background and other drug use covariates, all of the other PDM trajectories were associated with significantly increased odds of alcohol, cannabis, and other drug (including prescription drugs) use disorder symptoms at age 35, especially the later peak misuse trajectory (Figure 2). More specifically, the adjusted odds of indicating two or more AUD symptoms was approximately three times greater (Adjusted odds ratio = 3·20, 95% CI = 2·65, 3·86) among respondents profiled in the ‘ages 27–28 PDM peak’ trajectory when compared to respondents in the ‘Rare PDM” trajectory (Table 2). As shown in Table 2, the same general pattern was found when assessing each SUD and each prescription drug class separately. Most notably, respondents in the later peak PDM trajectories (i.e., peaking between age 27/28 and 35) had the largest adjusted odds of indicating two or more symptoms of AUD, CUD, ODUD, or any SUD versus the Rare PDM trajectory.
Figure 2.
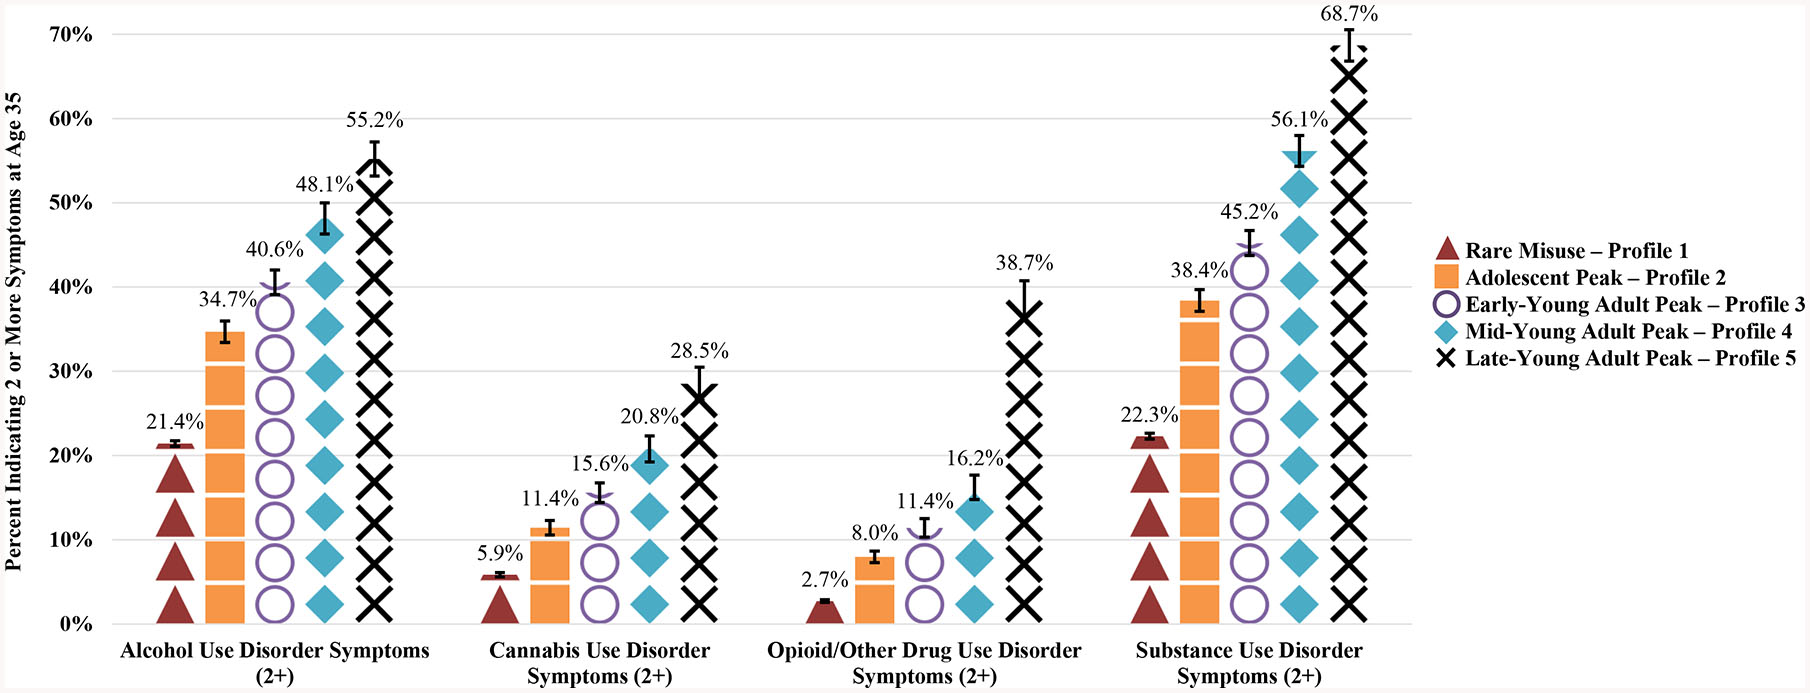
Prescription drug misuse trajectories from ages 18 to 35 and substance use disorder symptoms at age 35
Notes: Unweighted sample size (AUD 2+: n = 24,978; CUD 2+: n = 17,389; OUD 2+: n = 21,064). Missing cases were due to non-response on any of the prescription misuse items between ages 18 and 35 and non-response to any of the SUD items. All estimates provided use attrition weights to account respondents who dropped out of the study by age 35.
Table 2.
Substance use disorder symptoms as a function of prescription drug misuse trajectories for any (all three classes combined) and individual prescription drug classes (opioids, stimulants, and sedatives/tranquilizers)
| Substance Use Disorder Symptoms at Age 35 | ||||||||
|---|---|---|---|---|---|---|---|---|
| Prescription drug misuse profiles | Alcohol use disorder (AUD) (2+ symptoms) | Cannabis use disorder (CUD) (2+ symptoms) | Other drug use disorder (ODUD) (2+ symptoms) | Any substance use disorder (SUD) (2+ symptoms) | ||||
| n = 21,592 | n = 14,988 | n = 18,067 | n = 22,120 | |||||
| Any Prescription Misuse | p value | p value | p value | p value | ||||
| Rare misuse - Profile 1 | ||||||||
| Age 18 peak - Profile 2 | 0.005 | <0.0001 | <0.0001 | <0.0001 | ||||
| Ages 19–20 peak - Profile 3 | <0.0001 | <0.0001 | <0.0001 | <0.0001 | ||||
| Ages 23–24 peak - Profile 4 | <0.0001 | <0.0001 | <0.0001 | <0.0001 | ||||
| Ages 27–28 peak - Profile 5 | <0.0001 | <0.0001 | <0.0001 | <0.0001 | ||||
| Prescription Opioids | p value | p value | p value | p value | ||||
| Rare Misuse – Profile 1 | ||||||||
| Age 18 Peak – Profile 2 | 0.015 | <0.0001 | 0.012 | |||||
| Ages 19–20 Peak - Profile 3 | 0.065 | <0.0001 | <0.0001 | <0.0001 | ||||
| Ages 21–22 Peak - Profile 4 | <0.0001 | <0.0001 | <0.0001 | <0.0001 | ||||
| Ages 29–30 Peak - Profile 5 | <0.0001 | <0.0001 | <0.0001 | <0.0001 | ||||
| Prescription Stimulants | p value | p value | p value | p value | ||||
| Rare Misuse – Profile 1 | ||||||||
| Age 18 Peak – Profile 2 | 0.012 | <0.0001 | <0.0001 | |||||
| Ages 19–20 Peak - Profile 3 | <0.0001 | <0.0001 | <0.0001 | <0.0001 | ||||
| Ages 23–24 Peak - Profile 4 | <0.0001 | <0.0001 | <0.0001 | <0.0001 | ||||
| Ages 27–28 Peak - Profile 5 | <0.0001 | <0.0001 | <0.0001 | <0.0001 | ||||
| Sedatives/Tranquilizers | p value | p value | p value | p value | ||||
| Rare Misuse – Profile 1 | ||||||||
| Age 18 Peak – Profile 2 | 0.073 | 0.025 | <0.0001 | 0.009 | ||||
| Ages 19–20 Peak - Profile 3 | <0.0001 | <0.0001 | <0.0001 | <0.0001 | ||||
| Ages 21–22 Peak - Profile 4 | <0.0001 | <0.0001 | <0.0001 | <0.0001 | ||||
| Age 35 Peak - Profile 5 | <0.0001 | <0.0001 | <0.0001 | <0.0001 | ||||
Notes: AOR refers to adjusted odds ratio. “Reference” refers to the “Rare Misuse” profile in the presented models. Unweighted samples sizes for the full sample are provided. Sample sizes vary due to missing data. All estimates from the logistic regression models use attrition weights to account respondents who dropped out of the study by age 35. Models control for sex, race/ethnicity, parents level of education, urbanicity, U.S. region, cohort year, average GPA in their senior year, college aspirations in their senior year, past 30-day cigarette use in their senior year, past two-week binge drinking in their senior year, past 30-day marijuana use in their senior year, and whether they graduated from college during the study period (ages 18 to 35). The sample sizes for the models ranged from 14,988 (CUD) to 22,120 (any SUD).
Indicates a statistically significant difference at the .05 alpha level or lower when compared to the ‘ profile 1’ group.
Indicates a statistically significant difference at the .05 alpha level or lower when compared to the ‘ profile 2’ group.
Indicates a statistically significant difference at the .05 alpha level or lower when compared to the ‘ profile 3’ group.
Indicates a statistically significant difference at the .05 alpha level or lower when compared to the ‘ profile 4’ group.
Indicates a statistically significant difference at the .05 alpha level or lower when compared to the ‘ profile 5’ group.
Additional analyses revealed that the percentage of individuals who reported past-year PDM involving multiple prescription drug classes (i.e., poly-PDM) was 44·2% while the remainder of individuals reported past-year PDM involving one prescription drug class (i.e., mono-PDM). We examined how poly-PDM and mono-PDM were associated with trajectories of PDM and age 35 SUD symptoms (Supplemental Table 5–8). We found that adolescents who reported poly-PDM were more likely to be in the later PDM peak trajectory groups when compared to mono-PDM. Moreover, we found extremely high rates of SUD symptoms for the poly-PDM subgroup.
Risk factors associated with high-risk PDM trajectories (Objective 3):
As shown in Table 3, baseline adolescent (age 18) measures significantly associated with increased odds of belonging to the latest peak PDM trajectory, after adjusting for covariates, included high school heavy drinking, cigarette smoking, and marijuana use, and the age-35 measure of not having completed a college degree. In contrast, African-American race/ethnicity (vs. White) was associated with significantly lower odds of belonging to the latest peak PDM trajectory. The adolescent risk factors associated with the PDM trajectories for each of the individual prescription classes closely resembled the combined findings (Supplemental Tables 9–11).
Table 3.
Adolescent predictors’ of any prescription drug misuse (all three classes combined) trajectories over 17 years
| Rare Misuse - Profile 1 | Age 18 Peak - Profile 2 | Ages 19–20 Peak - Profile 3 | Ages 23–24 Peak - Profile 4 | Ages 27–28 Peak - Profile 5 | ||||||
|---|---|---|---|---|---|---|---|---|---|---|
| n = 22,417 | n = 22,417 | n = 22,417 | n = 22,417 | n = 22,417 | ||||||
| p value | p value | p value | p value | p value | ||||||
| Sex | ||||||||||
| Male | ||||||||||
| Female | 0.006 | <0.0001 | 0.001 | 0.022 | 0.151 | |||||
| Race/ethnicity | ||||||||||
| White | ||||||||||
| African-American | <0.0001 | <0.0001 | 0.001 | 0.008 | 0.008 | |||||
| Hispanic | 0.123 | 0.993 | 0.393 | 0.080 | 0.511 | |||||
| Other | 0.427 | 0.966 | 0.776 | 0.192 | 0.673 | |||||
| Grade point average | ||||||||||
| B- or higher | ||||||||||
| C+ or lower | 0.012 | 0.001 | 0.897 | 0.957 | 0.408 | |||||
| Parental level of education | ||||||||||
| Less than a college degree | ||||||||||
| College degree or higher | 0.030 | 0.673 | 0.005 | 0.451 | 0.840 | |||||
| Cigarette use (30-day) | ||||||||||
| No | ||||||||||
| Yes | <0.0001 | <0.0001 | <0.0001 | <0.0001 | <0.0001 | |||||
| Binge drink (2-week) | ||||||||||
| No | ||||||||||
| Yes | <0.0001 | <0.0001 | <0.0001 | 0.001 | 0.001 | |||||
| Cannabis use (30-day) | ||||||||||
| No | ||||||||||
| Yes | <0.0001 | <0.0001 | <0.0001 | <0.0001 | <0.0001 | |||||
| College plans while in high school | ||||||||||
| No | ||||||||||
| Yes | 0.076 | 0.031 | 0.292 | 0.707 | 0.828 | |||||
| Graduated college during the study period (ages 18 to 35) | ||||||||||
| No | ||||||||||
| Yes | <0.0001 | 0.122 | 0.138 | 0.330 | <0.0001 | |||||
Notes: AOR refers to adjusted odds ratio. “Reference” refers to the reference group for each baseline measure in the presented models. Unweighted samples sizes are provided. All estimates provided use weights to adjust for oversampling of drug users into the longitudinal panel. Models control for sex, race/ethnicity, parental level of education, urbanicity, U.S. region, cohort year, average GPA in high school, college plans while in high school, past 30-day cigarette use, past two-week binge drinking, past 30-day cannabis use, and whether they graduated from college during the study period (ages 18 to 35).
Discussion
This is the first national longitudinal study to examine PDM trajectories involving prescription stimulants, opioids, and sedatives/tranquilizers from late adolescence to adulthood. PDM is more prevalent in high-income countries largely due to increased prescription medication availability, and the findings of the present study have important implications for understanding the consequences associated with PDM trajectories.1–4 The PDM trajectories were heterogeneous, and the defining characteristic that differentiated the five PDM trajectories was the age period in late adolescence or adulthood during which PDM frequency peaked. The findings of the present study provide compelling evidence that all four PDM trajectories during the transition from adolescence to adulthood, compared to the Rare PDM trajectory, are strongly associated with SUD symptoms in adulthood, especially PDM trajectories that peak during the late-20s. There are several predictors associated with later peak PDM trajectories including high school heavy drinking, cigarette smoking, marijuana use, poly-PDM, White race, and not completing college.
The PDM trajectories for the three prescription drug classes combined (i.e., prescription stimulants, opioids, and sedatives/tranquilizers) were similar to the results for the PDM trajectories for each individual prescription drug class. The only exception was one unique trajectory for sedative/tranquilizer PDM, where frequency peaked later (age 35) relative to the other classes. These findings reinforce the importance of accounting for frequency of PDM in longitudinal research rather than relying solely on prevalence, as well as accounting for heterogeneity in individuals’ courses of substance use and misuse during the transition from late adolescence to adulthood.33
A particularly important contribution of this longitudinal study is the finding that all four problematic PDM trajectories were associated with elevated rates of SUD symptoms during adulthood compared to the Rare PDM trajectories, even when controlling for adolescent background characteristics and substance use. Most notably, later peak PDM was associated with significantly greater odds of having symptoms of any SUD at age 35, relative to early peak PDM and Rare PDM trajectories. Among those in the ages 27–28 later peak PDM trajectory for three prescription drug classes combined, more than two-thirds (68·7%) had two or more symptoms of any SUD (indicative of having a DSM-5 SUD at age 35), and over one-third (38·7%) had two or more ODUD symptoms (i.e., opioid/other drug use disorder other than alcohol or cannabis use disorder) at age 35. Prior work has shown that the majority of PDM during adolescence is associated with experimental use that ceases over time.12,22 The present study indicates that peaks in PDM in later 20s (e.g., ages 27–28) are more likely than Rare PDM to be associated with SUD symptoms. We also found a major increase in ODUD symptoms in the latest PDM peak that may be associated with higher rates of transitioning to other drugs with high abuse potential (e.g., heroin). These findings suggest there could be substantive differences between early vs. late peak PDM that warrant more attention. One potential explanation is that later peak PDM could be less associated with experimental use and more associated with self-management of symptoms related to untreated disorders leading to a greater likelihood of subsequent substance-related problems.
Previous work has found that PDM is most prevalent during late adolescence and young adulthood – particularly in White respondents, those of lower socio-economic status, and youth who have detached parents and friends who use illicit drugs.6–8 The present study found that race/ethnicity played a significant role in predicting PDM trajectories, as African-American youth were significantly more likely to belong to Rare PDM trajectories and significantly less likely to belong to high-frequency PDM trajectories than White youth. These racial/ethnic differences in PDM could be partially attributed to similar racial/ethnic differences in prescribing patterns of controlled medications.34 Educational attainment predicted PDM trajectories. Individuals who did not complete a four-year college degree were significantly more likely to belong to the high-risk PDM trajectories that peaked in the late 20s. This developmental period is a time when most traditional-aged college students have graduated, and these findings may reflect fewer opportunities and more “floundering” during this key period for non-college youth.35
To effectively address PDM among adolescents and young adults, a developmental perspective is instructive to understand the diversion sources used to obtain and misuse prescription medications. The majority of adolescents and young adults who misused controlled medications obtained from their peers and their own leftover medications.6,13 The risk of peer-to-peer diversion and PDM may increase during young adulthood as individuals become more responsible for their own medication management. As a result, future interventions should find innovative ways to monitor controlled medications and incentivize safe disposal of leftover medications to reduce PDM and diversion.
The finding that the majority of individuals in the ages 27–28 peak PDM trajectory were more likely to have two or more AUD symptoms than two or more ODUD symptoms has considerable clinical importance. These results correspond with the extremely high rates of polysubstance use involving PDM and other substances (primarily alcohol or cannabis), increasing the risk for acute consequences due to dangerous interaction effects and long-term substance-related problems.12,16 Taken together, these findings provide compelling evidence that (a) adolescents and young adults who engage in PDM should be screened for SUDs involving a wide range of substances and (b) interventions to reduce PDM need to be designed to treat PDM-related and other SUD symptoms, especially AUD symptoms.
The findings of the present study indicate that binge drinking, cigarette smoking, and cannabis use during high school served as robust predictors of subsequent high-risk PDM trajectories. Prior research has consistently shown high rates of polysubstance use involving PDM among adolescents and young adults, and the current study reinforces the importance of taking polysubstance use into account when working with youth and adults engaged in PDM.12,15,16 The present study adds valuable new information showing that more than two in every five adolescents who engage in PDM report poly-PDM. We found that adolescents who reported poly-PDM were significantly more likely than those who reported mono-PDM to be in the high-risk PDM peak trajectories and had extremely high rates of SUD symptoms in adulthood.
This study has several strengths and limitations that need to be considered when weighing the implications of the results. This is the first national longitudinal examination of PDM trajectories during developmental periods with the highest prevalence of PDM followed into adulthood. Strengths include national samples of multiple cohorts followed longitudinally across eight waves from ages 18 through 35 using consistent procedures and measures to examine PDM trajectories.
The present study contains the limitations of large-scale longitudinal survey research using self-administered surveys conducted in one country. High-risk subgroups such as high school dropouts and low-risk subgroups such as homeschooled students were missing from the Monitoring the Future study data collection.10 The omission of these high-risk and low-risk subgroups likely resulted in an under-representation of extreme trajectories such as rare misuse and the highest risk PDM trajectories. Further, some variables were not included in the Monitoring the Future study that are related to substance use at baseline and SUD symptoms at follow-up (e.g., anxiety, conduct or mood disorder diagnoses, family history of SUD). The current results should be viewed as preliminary until a more comprehensive analysis controlling for these measures is conducted in multiple countries. Furthermore, although a consistent number of five classes was selected based on the overall PDM trajectories for ease of presentation, there was variation across the specific prescription drug classes that needs to be explored in future studies. Finally, it should be noted that the criteria for opioid use disorder were included in the “other drug use disorder” category and the present study did not include all of the DSM-5 SUD criteria suggesting that the true rate of a DSM-5 SUD is likely even higher in the PDM trajectories.
In conclusion, the prevalence of PDM is highest during late adolescence and young adulthood and these developmental periods remain critical to intervene in and prevent progression to severe consequences associated with PDM. Based on the high rates of polysubstance use and peer diversion associated with PDM, there is a dire need to educate adolescents at the time of prescription about the risks associated with misusing and sharing these medications and incentivizing proper medication disposal to reduce leftover excess medication, diversion, and PDM.
Supplementary Material
Acknowledgments
The development of this manuscript was supported by research grants R01DA001411, R01DA016575, R01DA031160, R01DA036541, and R01DA043691 from the National Institute on Drug Abuse, National Institutes of Health. The funders had no role in the design and conduct of the study; collection, management, analysis and interpretation of the data; preparation, review, or approval of the manuscript; and decision to submit the manuscript for publication. The content is solely the responsibility of the authors and does not necessarily represent the official views of the National Institute on Drug Abuse or the National Institutes of Health. The authors would like to thank the respondents, school personnel and research staff for their participation in the study. The authors would also like to thank the anonymous reviewers and editorial team for their detailed review and helpful suggestions to earlier versions of the manuscript. We also would like to thank Ms. Kate Leary for her help editing this manuscript and assisting with the figures. The MTF data used in this study are restricted use data; public non-restricted and restricted use MTF data can be requested via the National Addiction & HIV Data Archive Program (https://www.icpsr.umich.edu/icpsrweb/NAHDAP/).
Footnotes
Disclosures
The authors report no financial relationships with commercial interests.
Contributor Information
Sean Esteban McCabe, Center for the Study of Drugs, Alcohol, Smoking and Health, Center for Human Growth and Development, Institute for Research on Women and Gender, Institute for Healthcare Policy and Innovation, School of Nursing, University of Michigan, Ann Arbor, MI, USA
Philip Veliz, University of Michigan, Center for the Study of Drugs, Alcohol, Smoking and Health, Institute for Research on Women and Gender, Ann Arbor, MI, USA
Kara Dickinson, University of Michigan, Center for the Study of Drugs, Alcohol, Smoking and Health, Ann Arbor, MI, USA.
Ty S. Schepis, Department of Psychology, Texas State University, San Marcos, TX, USA
John E. Schulenberg, Institute for Social Research and Department of Psychology, University of Michigan, Ann Arbor, MI, USA
References
- 1.GBD 2016 Alcohol and Drugs Use Collaborators. The global burden of disease attributable to alcohol and drug use in 195 countries and territories, 1990–2016: a systematic analysis for the Global Burden of Disease Study 2016. Lancet Psychiatry 2018; 5: 987–1012. [DOI] [PMC free article] [PubMed] [Google Scholar]
- 2.Giraudon I, Lowitz K, Dargan PI, Wood DM, Dart RC. Prescription opioid abuse in the UK. Br J Clin Pharmacol 2013; 76: 823–24. [DOI] [PMC free article] [PubMed] [Google Scholar]
- 3.Centers for Disease Control and Prevention. Annual Surveillance Report of Drug-Related Risks and Outcomes -- United States 2017. Surveillance Special Report 1. U.S. Department of Health and Human Services; 2017. Accessed online August 31, 2017. [Google Scholar]
- 4.Seth P, Scholl L, Rudd RA, Bacon S. Overdose deaths involving opioids, cocaine, and psychostimulants - United States, 2015–2016. MMWR Morb Mortal Wkly Rep 2018; 67: 349–58. [DOI] [PMC free article] [PubMed] [Google Scholar]
- 5.Pickover AM, Messina BG, Correia CJ, Garza KB, Murphy JG. A behavioral economic analysis of the nonmedical use of prescription drugs among young adults. Exp Clin Psychopharmacol 2016; 24: 38–47. [DOI] [PubMed] [Google Scholar]
- 6.McCabe SE, Teter CJ, Boyd CJ, Wilens TE, Schepis TS. Sources of prescription medication misuse among young adults in the United States: The role of educational status. J Clin Psychiatry 2018; 79: 17m11958. [DOI] [PMC free article] [PubMed] [Google Scholar]
- 7.Hughes A, Williams M, Lipari RN, Bose J, Copello EA, Kroutil LA. Prescription drug use and misuse in the United States: Results from the 2015 National Survey on Drug Use and Health. NSDUH Data Review; 2016. [Google Scholar]
- 8.Saha TD, Kerridge BT, Goldstein RB, et al. Nonmedical prescription opioid use and DSM-5 nonmedical prescription opioid use disorder in the United States. J Clin Psychiatry 2016; 77: 772–80. [DOI] [PMC free article] [PubMed] [Google Scholar]
- 9.Sheridan DC, Laurie A, Hendrickson RG, Fu R, Kea B, Horowitz BZ. Association of overall opioid prescriptions on adolescent opioid abuse. J Emerg Med 2016; 51: 485–90. [DOI] [PMC free article] [PubMed] [Google Scholar]
- 10.Schepis TS, Teter CJ, McCabe SE. Prescription drug use, misuse and related substance use disorder symptoms vary by educational status and attainment in U.S. adolescents and young adults. Drug Alcohol Depend 2018; 189: 172–77. [DOI] [PMC free article] [PubMed] [Google Scholar]
- 11.Schulenberg JE, Maggs JL. A developmental perspective on alcohol use and heavy drinking during adolescence and the transition to young adulthood. J Stud Alcohol Suppl 2002; 14: 54–70. [DOI] [PubMed] [Google Scholar]
- 12.Catalano RF, White HR, Fleming CB, Haggerty KP. Is nonmedical prescription opiate use a unique form of illicit drug use? Addict Behav 2011; 36: 79–86. [DOI] [PMC free article] [PubMed] [Google Scholar]
- 13.Miech RA, Johnston LD, O’Malley PM, Bachman JG, Schulenberg JE, Patrick ME. Monitoring the Future national survey results on drug use, 1975–2017: Volume I, Secondary school students. Ann Arbor, MI: Institute for Social Research, The University of Michigan; 2018. [Google Scholar]
- 14.Center for Behavioral Health Statistics and Quality. 2017 National Survey on Drug Use and Health: Detailed Tables. Rockville, MD: Substance Abuse and Mental Health Services Administration; 2018. [Google Scholar]
- 15.McCabe SE, West BT, Teter CJ, Boyd CJ. Co-ingestion of prescription opioids and other drugs among high school seniors: Results from a national study. Drug Alcohol Depend 2012; 126: 65–70. [DOI] [PMC free article] [PubMed] [Google Scholar]
- 16.McCabe SE, Veliz PT, Boyd CJ, Schepis TS, McCabe VV, Schulenberg JE. A prospective study of nonmedical use of prescription opioids during adolescence and subsequent substance use disorder symptoms in early midlife. Drug Alcohol Depend 2019; 194: 377–85. [DOI] [PMC free article] [PubMed] [Google Scholar]
- 17.Schulenberg JE, Johnston LD, O’Malley PM, Bachman JG, Miech RA, Patrick ME. Monitoring the Future national survey results on drug use, 1975–2017: Volume II, College students and adults ages 19–55. Ann Arbor, MI: Institute for Social Research, The University of Michigan; 2018. http://www.monitoringthefuture.org//pubs/monographs/mtf-vol2_2017.pdf [Google Scholar]
- 18.Garnier-Dykstra LM, Caldeira KM, Vincent KB, O’Grady KE, Arria AM. Nonmedical use of prescription stimulants during college: Four-year trends in exposure opportunity, use, motives, and sources. J Am Coll Health 2012; 60: 226–34. [DOI] [PMC free article] [PubMed] [Google Scholar]
- 19.Young AM, Glover N, Havens JR. Nonmedical use of prescription medications among adolescents in the United States: A systematic review. J Adolesc Health 2012; 51: 6–17. [DOI] [PubMed] [Google Scholar]
- 20.Whiteside LK, Walton MA, Bohnert AS, et al. Nonmedical prescription opioid and sedative use among adolescents in the emergency department. Pediatrics 2013; 132: 825. [DOI] [PMC free article] [PubMed] [Google Scholar]
- 21.Schepis TS, West BT, Teter CJ, McCabe SE. Prevalence and correlates of co-ingestion of prescription tranquilizers and other psychoactive substances by U.S. high school seniors: Results from a national survey. Addict Behav 2016; 52: 8–12. [DOI] [PMC free article] [PubMed] [Google Scholar]
- 22.McCabe SE, Schulenberg JE, O’Malley PM, Patrick ME, Kloska DD. Non-medical use of prescription opioids during the transition to adulthood: A multi-cohort national longitudinal study. Addiction 2014; 109: 102–10. [DOI] [PMC free article] [PubMed] [Google Scholar]
- 23.Merline A, Jager J, Schulenberg JE. Adolescent risk factors for adult alcohol use and abuse: stability and change of predictive value across early and middle adulthood. Addiction 2008; 103: 84–99. [DOI] [PMC free article] [PubMed] [Google Scholar]
- 24.Schulenberg JE, Patrick ME, Kloska DD, Maslowsky J, Maggs JL, O’Malley PM. Substance use disorder in early midlife: A national prospective study on health and well-being correlates and long-term predictors. Subst Abuse 2015; 9: 41–57. [DOI] [PMC free article] [PubMed] [Google Scholar]
- 25.Harford TC, Muthen BO. The dimensionality of alcohol abuse and dependence: A multivariate analysis of DSM-IV symptom items in the National Longitudinal Survey of Youth. J Stud Alcohol 2001; 62: 150–7. [DOI] [PubMed] [Google Scholar]
- 26.Muthen BO. Psychometric evaluation of diagnostic criteria: Application to a two-dimensional model of alcohol abuse and dependence. Drug Alcohol Depend 1996; 41: 101–12. [DOI] [PubMed] [Google Scholar]
- 27.Nelson CB, Heath AC, Kessler RC. Temporal progression of alcohol dependence symptoms in the U.S. household population: results from the National Comorbidity Survey. J Consult Clin Psychol 1998; 66: 474–83. [DOI] [PubMed] [Google Scholar]
- 28.Grant BF, Goldstein RB, Saha TD, et al. Epidemiology of DSM-5 alcohol use disorder: Results from the National Epidemiologic Survey on Alcohol and Related Conditions III. JAMA Psychiatry 2015; 72: 757–66. [DOI] [PMC free article] [PubMed] [Google Scholar]
- 29.Hasin DS, Kerridge BT, Saha TD, et al. Prevalence and correlates of DSM-5 Cannabis Use Disorder, 2012–2013: Findings from the National Epidemiologic Survey on Alcohol and Related Conditions-III. Am J Psychiatry 2016; 173: 588–99. [DOI] [PMC free article] [PubMed] [Google Scholar]
- 30.Collins LM, Lanza ST. Latent class and latent transition analysis: With applications in the social, behavioral, and health sciences. Hoboken, NJ: John Wiley & Sons, Inc.; 2010. [Google Scholar]
- 31.Asparouhov T, Muthen B. Auxiliary variables in mixture modeling: three-step approaches using Mplus. Struct Equ Modeling 2014; 21: 329–41. [Google Scholar]
- 32.Celeux G, Soromenho G. An entropy criterion for assessing the number of clusters in a mixture model. J Classif 1996; 13: 195–212. [Google Scholar]
- 33.Schulenberg JE, Maslowsky J, Jager J. Substance use and abuse are developmental phenomena: conceptual and empirical considerations. New York, NY: Oxford University Press; 2018. [Google Scholar]
- 34.Groenewald CB, Rabbitts JA, Hansen EE, Palermo TM. Racial differences in opioid prescribing for children in the United States. Pain 2018; 159: 2050–2057. [DOI] [PMC free article] [PubMed] [Google Scholar]
- 35.Settersten R, Ray BE. Not quite adults: Why 20-somethings are choosing a slower path to adulthood, and why it’s good for everyone. New York, NY: Bantam Books; 2010. [Google Scholar]
Associated Data
This section collects any data citations, data availability statements, or supplementary materials included in this article.