Abstract
Diffusion-weighted magnetic resonance (MR) imaging allows the detection of focal solid and cystic lesions in the abdomen and pelvis and, if pitfalls are to be avoided, is most effectively used in conjunction with other imaging sequences. It is important to recognize that the strength of the diffusion sensitizing gradient (b value) can and should be adjusted to ensure optimal evaluation of the body region or organ being imaged, and that more than one b value is necessary for tissue characterization. The success of lesion detection and characterization largely depends on the extent of tissue cellularity because increased cellularity is associated with impeded diffusion, as indicated by a reduction in the apparent diffusion coefficient. It is also important to recognize that certain normal tissues such as the endometrium are highly cellular and as such demonstrate restricted diffusion, which should not be misinterpreted as disease. Impeded diffusion can also be seen in highly viscous cystic lesions such as abscesses. Diffusion-weighted imaging is an evolving technology with the potential to improve tissue characterization when findings are interpreted in conjunction with findings obtained with other conventional MR imaging sequences.
© RSNA, 2009
LEARNING OBJECTIVES
After reading this article and taking the test, the reader will be able to:
-
•.
Discuss the basic concepts of diffusion-weighted MR imaging.
-
•.
Describe current applications of diffusion-weighted imaging in the abdomen and pelvis.
-
•.
Recognize common pitfalls and limitations of abdominopelvic diffusion-weighted imaging.
Introduction
Diffusion-weighted imaging in the abdomen and pelvis has been increasingly used since the 1990s with the development of stronger diffusion gradients, faster imaging sequences, and improvements in technology and magnetic resonance (MR) imaging instrumentation. Diffusion-weighted imaging of the liver may be performed with 14–24-second breath-hold sequences depending on the field strength and gradient strength of the magnet. At present, much of the implementation is limited to academic institutions, but a growing body of research indicates that this technique provides valuable qualitative and quantitative data regarding structural tissue changes at a cellular level. Broader utilization in community practice is likely in the near future, particularly once a consensus on sequence optimization and data interpretation is established. The principles of diffusion-weighted imaging involve exploitation of water movement in the intra- and extracellular spaces and vessels. Sensitizing diffusion gradients are used to manipulate the signal from water molecules in these different environments for the purpose of tissue characterization. Quantitative analysis may be performed with the generation of apparent diffusion coefficient (ADC) maps from diffusion images obtained at different b values. It is important to recognize that diffusion-weighted sequences must be tailored to the organ being assessed through appropriate b value selection, and that this modality has potential pitfalls and limitations.
In this article, we discuss and illustrate diffusion-weighted imaging in terms of basic principles, mechanism of qualitative and quantitative analysis, common pitfalls, technical challenges, and applications in the abdomen and pelvis, with special emphasis on imaging of the liver.
Principles of Diffusion-weighted MR Imaging
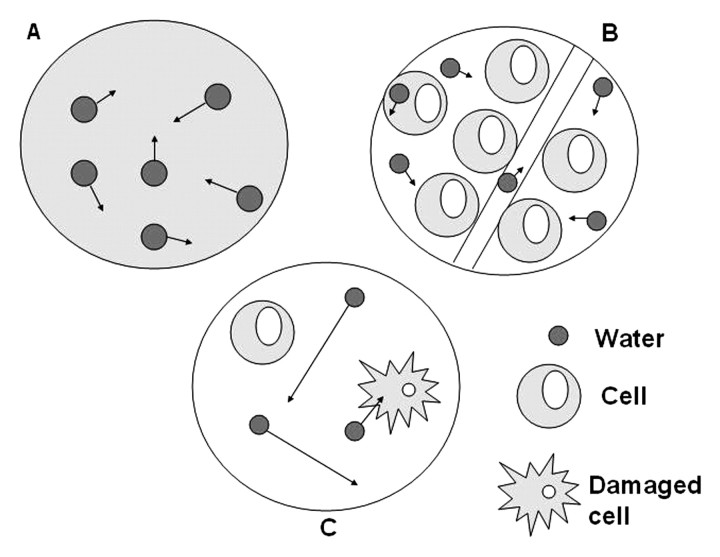
Diffusion-weighted imaging exploits the random motion of water molecules. In a totally unrestricted environment, water movement would be completely random, a phenomenon otherwise known as Brownian motion or free diffusion (1). Within biologic tissues, the movement of water is not completely random, but rather, is impeded by interaction with tissue compartments, cell membranes, and intracellular organelles. For purposes of simplification, water movement in tissues may be categorized as intravascular, intra-cellular, or extracellular (Fig 1) (2,3). The extent of tissue cellularity and the presence of intact cell membranes help determine the impedance of water molecule diffusion. Tissue types that have been reported to be associated with impeded diffusion include tumor, cytotoxic edema, abscess, and fibrosis. Tissues with low cellularity or that consist of cells with disrupted membranes permit greater movement of water molecules. The concept that diffusion-weighted imaging is a reflection of water movement at a cellular level is supported by the fact that the mean diameter of human cells is approximately 10 μm and the calculated root mean square displacement of water molecules during diffusion-weighted imaging is reported to be 8 μm (4,5).
Figure 1.
Schematic illustrates water molecule movement. In A, water molecules in a container alone move randomly (Brownian motion). In B, highly cellular tissue impedes the movement of water molecules. Their movement can be categorized as intravascular, intracellular, or extracellular. In C, tissue of low cellularity or with defective cells permits greater water molecule movement.
Measurement of Diffusion
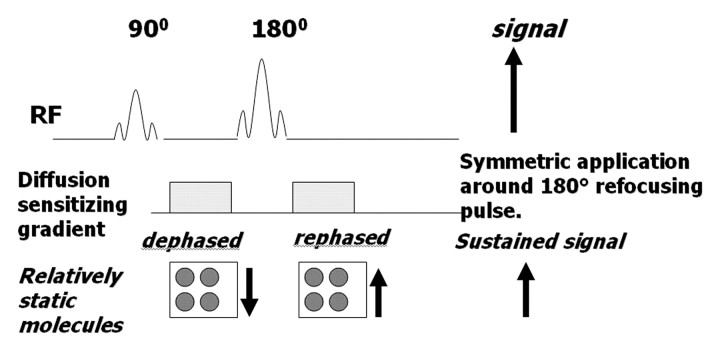
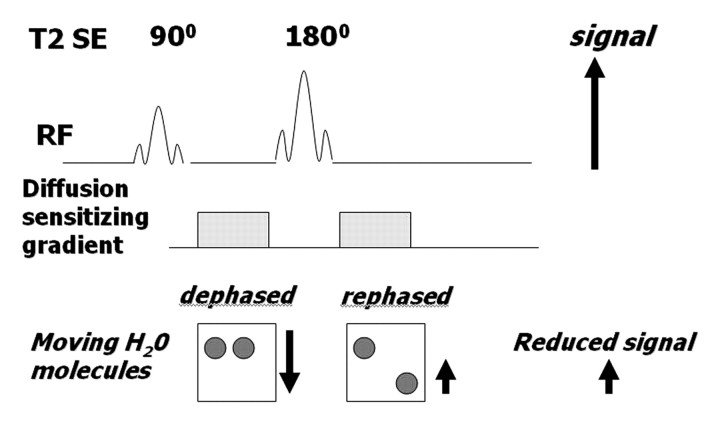
A diffusion-weighted sequence was initially described by Stejskal and Tanner in 1965 (2) as an adaptation of a T2-weighted sequence. The clinical sequence commonly used is an ultrafast spin-echo echoplanar T2-weighted sequence with parallel imaging. For over 20 years, this technique has been used for imaging of the brain. Not until the past decade, however, have applications in the abdomen been successfully developed, with the development of phased-array surface coils, high gradient amplitudes, and rapid imaging techniques (echoplanar imaging and parallel imaging) (1,6,7). The spin-echo T2-weighted sequence consists of a 90° radiofrequency (RF) pulse followed by a 180° RF pulse, with the T2 decay related to transverse relaxation. Measurement of water diffusion is possible with the application of a dephasing gradient (diffusion sensitizing gradient) prior to the 180° RF pulse. A symmetric rephasing gradient is then applied after the 180° RF pulse (Fig 2a). In a simplified model, the effect of the first (dephasing) gradient is cancelled out by the second (rephrasing) gradient in tissues with limited or impeded water movement, such as the highly cellular tissue of tumors. Therefore, there is little impact on the overall T2 decay, and the T2 signal of the tissue is maintained. In tissues with unimpeded water movement (low-cellularity tissue), water molecules may move a considerable distance between the dephasing and rephasing gradient applications. Consequently, the mobile water molecules will not be fully re-phased, resulting in a reduction in overall T2 signal intensity (Fig 2b). Therefore, the movement of water molecules is represented by a reduction in signal intensity on diffusion-weighted images and is proportional to the degree of signal loss.
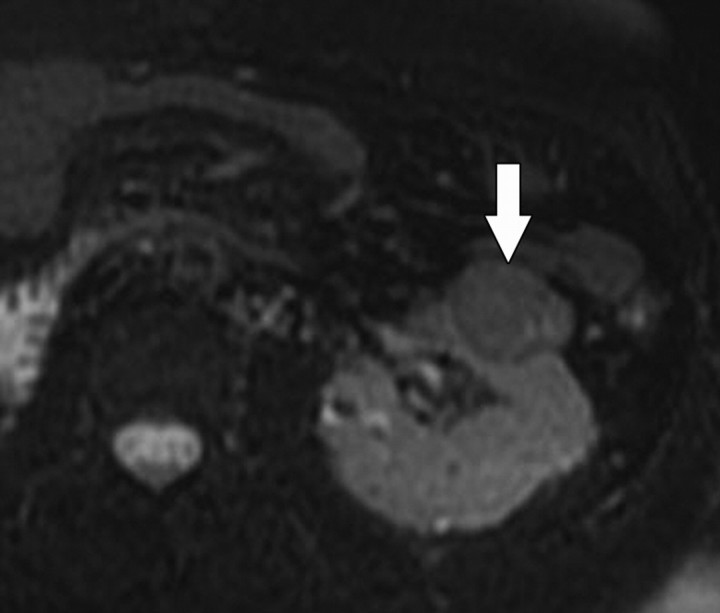
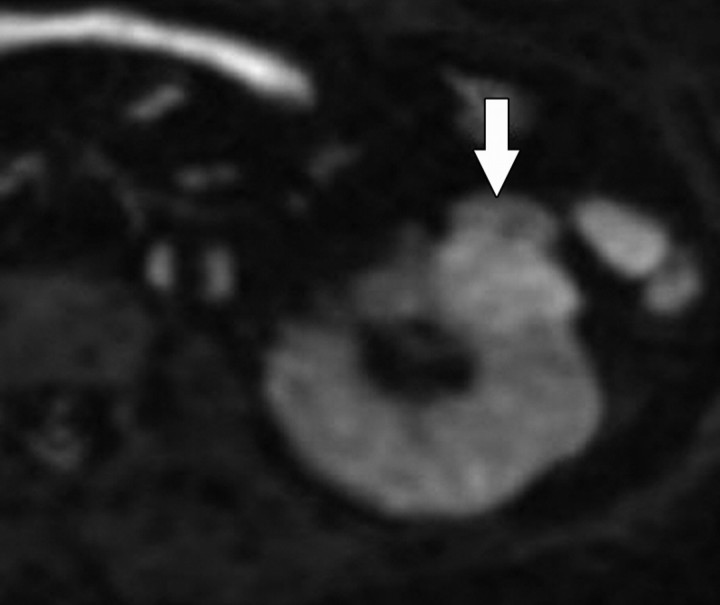
Figure 11c.
Renal cell carcinoma in a 54-year-old woman. (a) Fast spin-echo T2-weighted MR image shows a mass (arrow) that arises from the left kidney. The mass demonstrates intermediate signal intensity, a finding that is consistent with a solid mass or hemorrhagic cyst. (b) Axial diffusion-weighted image (b = 500 sec/mm2) shows the mass with high signal intensity (arrow). (c) On an axial ADC map, the mass (arrow) demonstrates low signal intensity (restricted diffusion), a finding that is consistent with a solid tumor.
Figure 2a.
(a) Schematic illustrates the effect of a diffusion-weighted sequence on water molecules (solid circles) within highly cellular tissue or a restricted environment. The diffusion-weighted sequence is fundamentally a T2-weighted sequence with the application of a dephasing gradient (diffusion sensitizing gradient) prior to the 180° RF pulse, followed by a symmetric rephasing gradient after the 180° pulse. Water molecules within a restricted environment do not move long distances and acquire phase shifts during the application of the first gradient that are cancelled out by phase shifts acquired during the second (opposing) gradient. As a result, no net loss in signal intensity occurs (aside from normal T2 decay). (b) Schematic illustrates the effect of a diffusion-weighted sequence on water molecules (solid circles) within tissue with low cellularity or a less restricted environment. Water molecules within a less restricted environment can move long distances. Such highly mobile molecules acquire phase information from the first gradient, but because of their motion, their signal does not completely rephase with the second gradient, resulting in a net loss in signal intensity in addition to normal T2 decay. SE = spin-echo.
Figure 2b.
(a) Schematic illustrates the effect of a diffusion-weighted sequence on water molecules (solid circles) within highly cellular tissue or a restricted environment. The diffusion-weighted sequence is fundamentally a T2-weighted sequence with the application of a dephasing gradient (diffusion sensitizing gradient) prior to the 180° RF pulse, followed by a symmetric rephasing gradient after the 180° pulse. Water molecules within a restricted environment do not move long distances and acquire phase shifts during the application of the first gradient that are cancelled out by phase shifts acquired during the second (opposing) gradient. As a result, no net loss in signal intensity occurs (aside from normal T2 decay). (b) Schematic illustrates the effect of a diffusion-weighted sequence on water molecules (solid circles) within tissue with low cellularity or a less restricted environment. Water molecules within a less restricted environment can move long distances. Such highly mobile molecules acquire phase information from the first gradient, but because of their motion, their signal does not completely rephase with the second gradient, resulting in a net loss in signal intensity in addition to normal T2 decay. SE = spin-echo.
What Is the b Value?
The term b value refers to the strength of the diffusion sensitizing gradient. The b value is proportional to the gradient amplitude, the duration of the applied gradient, and the time interval between paired gradients and is measured in seconds per square millimeter (8). The sensitivity of the diffusion sequence is adjusted by varying the b value, which is most readily achieved by altering the gradient amplitude (1).
Importance of the b Value
Because the b value is the strength of the diffusion sensitizing gradient, at a b value of 0 sec/mm2 (ie, no diffusion sensitizing gradient), free water molecules have high signal intensity, the signal intensity being based on T2 weighting.
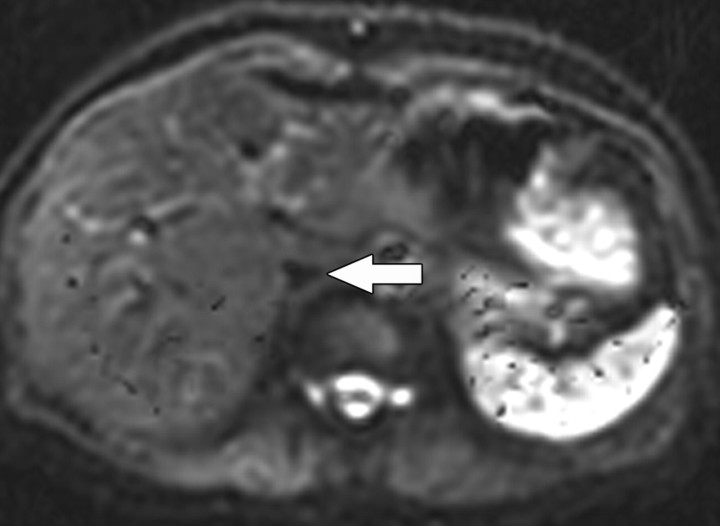
Small b values (50–100 sec/mm2) will result in signal loss in highly mobile water molecules such as occur within vessels. This is because the water molecules will have moved quickly over relatively longer distances by the time the rephasing gradient is applied, and consequently will not regain their original phase information after application of the rephasing gradient. The resulting images are referred to as “black-blood” images due to the signal loss in the fast-flowing blood within vessels (Fig 3) (1,3).
Figure 3.
Axial diffusion-weighted image (b = 0 sec/mm2) obtained in a 60-year-old woman shows a signal void within the inferior vena cava (arrow). Small b values will result in decreased signal of highly mobile water molecules such as occur within vessels. Such images are referred to as black-blood images due to the decreased signal of the fast-flowing blood within vessels.
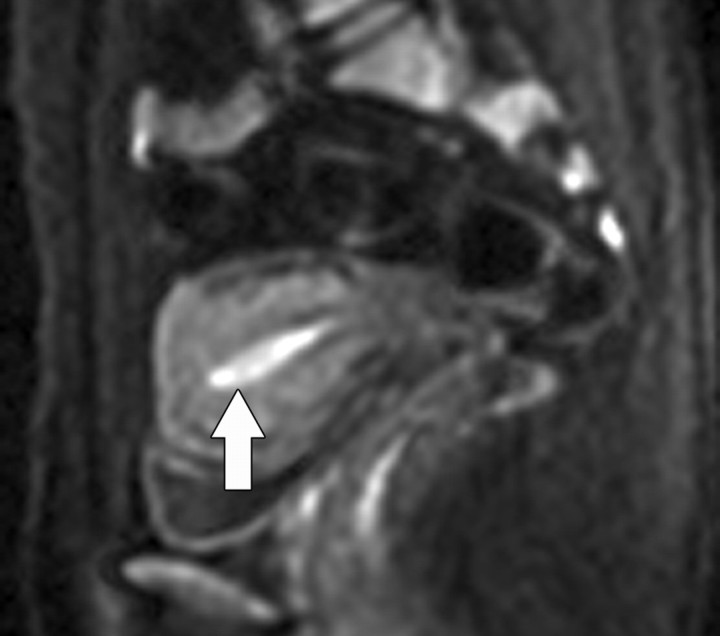
Because water movement in highly cellular tissues is restricted, the water molecules within such tissue retain their signal even at high b values (500–1000 sec/mm2). This explains why highly cellular tissues such as tumor, neurologic tissue (brain, spinal cord), normal lymphatic tissue, bowel mucosa, and normal endometrium appear persistently bright on diffusion-weighted images, even at high b values (Fig 4) (3).
Figure 4.
Sagittal diffusion-weighted image (b = 800 sec/mm2) obtained in a 38-year-old woman shows the endometrium with normal high signal intensity (arrow).
Qualitative Assessment of Diffusion-weighted Imaging
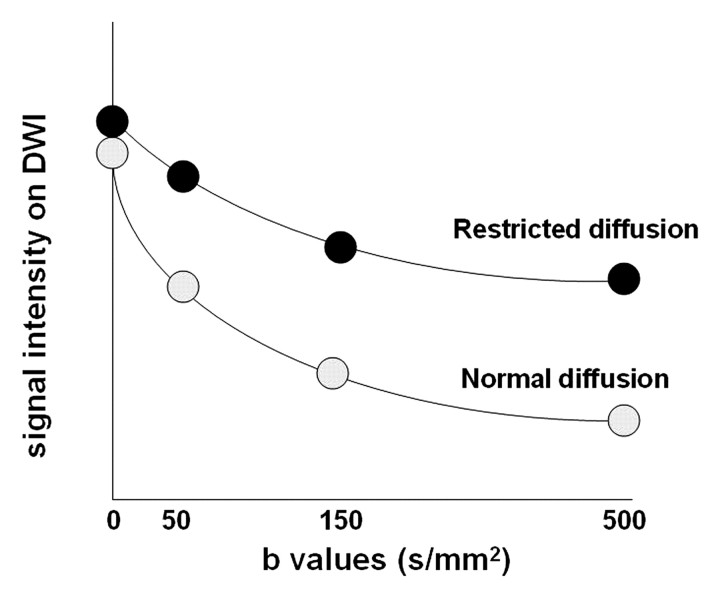
Diffusion-weighted imaging is performed with at least two b values, including a b value of 0 sec/mm2 and a higher b value of 500–1000 sec/mm2 depending on the body region or organ being imaged. The signal decay in tissues at different b values is generally biexponential (Fig 5a) (3). The initial component of signal decay is signal loss caused by flowing blood (fast-moving water molecules will dephase but will not readily rephase and will lose signal even with small b values). The second component is due to the movement of water in the intra- and extracellular spaces. A region of high signal intensity at high b-value diffusion-weighted imaging suggests restricted diffusion consistent with highly cellular tissue (tightly packed water molecules may readily be rephased by the rephasing gradient). The signal loss in water molecules at different b values can be used for lesion detection or characterization. However, interpretation of diffusion-weighted imaging findings should be performed in the context of other sequences (see “Common Pitfalls in Diffusion-weighted Imaging”).
Figure 5a.
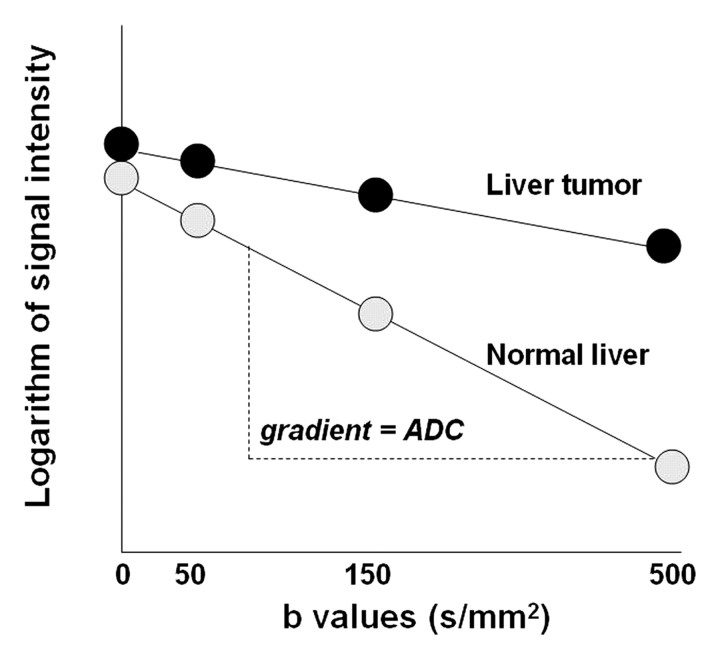
(a) Graph illustrates signal intensity versus b values at diffusion-weighted imaging (DWI) of tissue with normal versus restricted diffusion. (b) Graph illustrates the logarithm of signal intensity versus b values at diffusion-weighted imaging of normal liver versus liver tumor. The signal of water molecules decays exponentially with increasing b values for different tissue types. The decay in signal is reduced in tissues with restricted diffusion (eg, tumor). The ADC represents the slope (gradient) of the plotted lines. The greater the number of b values used in the analysis, the more accurate the ADC calculation.
Figure 5b.
(a) Graph illustrates signal intensity versus b values at diffusion-weighted imaging (DWI) of tissue with normal versus restricted diffusion. (b) Graph illustrates the logarithm of signal intensity versus b values at diffusion-weighted imaging of normal liver versus liver tumor. The signal of water molecules decays exponentially with increasing b values for different tissue types. The decay in signal is reduced in tissues with restricted diffusion (eg, tumor). The ADC represents the slope (gradient) of the plotted lines. The greater the number of b values used in the analysis, the more accurate the ADC calculation.
Quantitative Analysis of Diffusion-weighted Imaging Findings and ADC
The ADC represents the slope (gradient) of a line that is produced when the logarithm of relative signal intensity of tissue is plotted along the y-axis versus b values along the x-axis (Fig 5), thereby linearizing the exponential decay function. Quantitative analysis of diffusion-weighted imaging findings can be performed only if at least two b values are used for imaging. The optimal b values for tissue characterization depend on the tissue (organ) being evaluated. In the liver, b values of 0 and 500–600 sec/mm2 are typically used (9,10). Although at least two b values are required for diffusion-weighted imaging analysis, the application of a greater number of b values will improve the accuracy of the calculated ADC. The disadvantage of using multiple high b values is an associated increase in scanning time. The analysis of ADC is an automated process that is available as an application on most scanners or on a workstation. Calculation of ADC is independent of magnetic field strength and is made for each pixel of an image. The ADC can then be displayed as a parametric map and essentially reflects differences in tissue diffusivity at different b values. ADC measurements are then recorded for a given region by drawing regions of interest on the ADC map.
Common Pitfalls in Diffusion-weighted Imaging
T2 Shine-through
The signal intensity on diffusion-weighted images is dependent on water molecule diffusion and T2 relaxation time. Thus, lesions with a high fluid content (such as cysts or fluid in the gall-bladder) have a very long T2 relaxation time and demonstrate high signal intensity even at high b values, despite some signal loss in mobile water molecules (Fig 6). This pitfall may be avoided by referring to the ADC map (exponential image), which is a graphic representation of the ratio of the diffusion-weighted signal intensities (1). A cyst will demonstrate high signal intensity on T2-weighted images and on diffusion images obtained at b values of 0 and 500 sec/mm2, but also on the ADC map. Unlike a cyst, a region with truly restricted diffusion will demonstrate low signal intensity on the ADC map.
Figure 6a.
T2 shine-through in a 42-year-old woman with a small cyst in the left hepatic lobe. (a) T2-weighted image shows a cyst (arrow) with very high signal intensity despite its small size. (b) On a diffusion-weighted image (b = 500 sec/mm2), the cyst (arrow) reflects T2 shine-through rather than restricted diffusion.
Figure 6b.
T2 shine-through in a 42-year-old woman with a small cyst in the left hepatic lobe. (a) T2-weighted image shows a cyst (arrow) with very high signal intensity despite its small size. (b) On a diffusion-weighted image (b = 500 sec/mm2), the cyst (arrow) reflects T2 shine-through rather than restricted diffusion.
Slow-flowing Blood
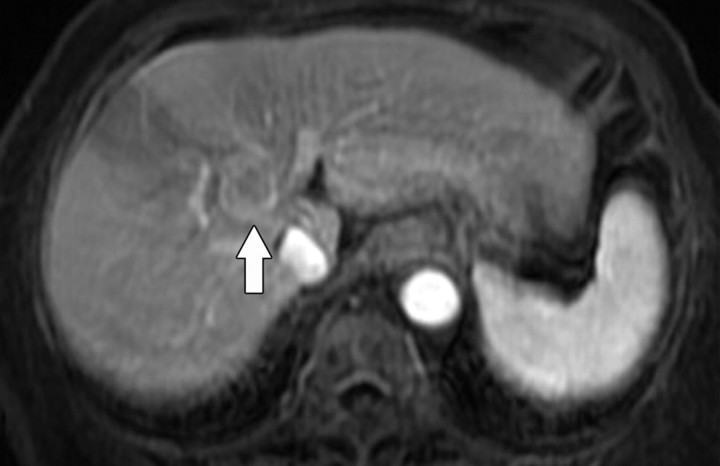
Whereas water molecules within vessels are highly mobile and readily lose signal at low b values, slow-flowing blood within a region may demonstrate the signal intensity characteristics of a highly cellular lesion. This pitfall is readily observed on diffusion-weighted images of a hemangioma, which demonstrates high signal intensity at a b value of 500 sec/mm2 due to the presence of slow-flowing blood and may also demonstrate low signal intensity on the ADC map. Consequently, a hemangioma could be mistaken for a solid liver tumor or metastatic lesion. In this situation, interpretation of the findings obtained with other MR sequences is very helpful, since even very small hemangiomas characteristically have very high signal intensity on T2-weighted images, whereas larger hemangiomas demonstrate the typical interrupted peripheral nodular enhancement pattern with progressive centripetal filling (Fig 7).
Figure 7a.
Hemangioma. (a) Gadolinium-enhanced gradient-echo T1-weighted MR image shows a hemangioma with peripheral nodular enhancement (arrow). (b) On a fast spin-echo T2-weighted MR image, the hemangioma (arrow) is lobulated and demonstrates very high signal intensity. (c) On a diffusion-weighted image (b = 500 sec/mm2), the hemangioma (arrow) demonstrates high signal intensity due to slow-flowing blood. (d) ADC map shows the diffusion of the hemangioma (arrow) to be similar to that of background liver (ie, unimpeded).
Figure 7b.
Hemangioma. (a) Gadolinium-enhanced gradient-echo T1-weighted MR image shows a hemangioma with peripheral nodular enhancement (arrow). (b) On a fast spin-echo T2-weighted MR image, the hemangioma (arrow) is lobulated and demonstrates very high signal intensity. (c) On a diffusion-weighted image (b = 500 sec/mm2), the hemangioma (arrow) demonstrates high signal intensity due to slow-flowing blood. (d) ADC map shows the diffusion of the hemangioma (arrow) to be similar to that of background liver (ie, unimpeded).
Figure 7c.
Hemangioma. (a) Gadolinium-enhanced gradient-echo T1-weighted MR image shows a hemangioma with peripheral nodular enhancement (arrow). (b) On a fast spin-echo T2-weighted MR image, the hemangioma (arrow) is lobulated and demonstrates very high signal intensity. (c) On a diffusion-weighted image (b = 500 sec/mm2), the hemangioma (arrow) demonstrates high signal intensity due to slow-flowing blood. (d) ADC map shows the diffusion of the hemangioma (arrow) to be similar to that of background liver (ie, unimpeded).
Figure 7d.
Hemangioma. (a) Gadolinium-enhanced gradient-echo T1-weighted MR image shows a hemangioma with peripheral nodular enhancement (arrow). (b) On a fast spin-echo T2-weighted MR image, the hemangioma (arrow) is lobulated and demonstrates very high signal intensity. (c) On a diffusion-weighted image (b = 500 sec/mm2), the hemangioma (arrow) demonstrates high signal intensity due to slow-flowing blood. (d) ADC map shows the diffusion of the hemangioma (arrow) to be similar to that of background liver (ie, unimpeded).
Iron Overload
Diffusion-weighted imaging is most commonly performed with an echoplanar sequence, which is highly susceptible to artifact. The presence of increased levels of liver iron has been suggested to result in signal loss at diffusion-weighted imaging, and it is postulated that the susceptibility effect of iron could be exploited to facilitate detection of liver metastases: Superparamagnetic iron oxide particles would be taken up by Kupffer cells in nontumorous liver, which would lose signal intensity on diffusion-weighted images, thereby increasing the relative signal intensity of metastases (11,12). Naganawa et al (11) reported an improvement in the detection of liver malignancy with a combination of superparamagnetic iron oxide particles and diffusion-weighted imaging. The advantage of improved contrast between metastases and nontumorous liver that may result from the use of superparamagnetic iron oxide particles relative to the potential disadvantage of poorer detection of small metastatic foci owing to adjacent iron-related susceptibility artifact has not been established.
Technical Challenges
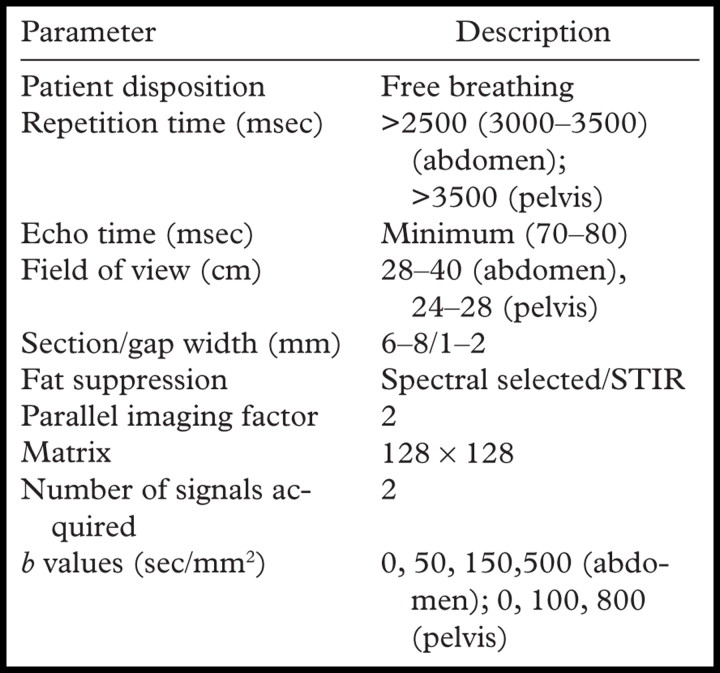
Diffusion-weighted imaging may be performed with a number of different techniques, including spin-echo, fast spin-echo, gradient-echo, and echoplanar imaging, with the latter being the most commonly used (1,13,14). The major limitations of diffusion-weighted MR imaging are (a) the low signal-to-noise ratio (SNR) inherent in the technique; and (b) susceptibility to artifact, which is associated with echoplanar imaging. Strategies that may be used to increase SNR include imaging at a higher field strength (3.0 T vs 1.5 T); minimizing echo time (<100 msec); increasing the number of signals acquired (two or three), which must be balanced against the resulting increase in imaging time; and use of a coarse matrix (128 × 128 at 1.5 T, 256 × 256 at 3.0 T). The SNR may also be increased by increasing the section thickness (typically a minimum of 6–7 mm) and field of view. The use of parallel imaging techniques permits rapid imaging and reduction in motion artifact, which also helps improve the accuracy of ADC calculation. Faster imaging allows the application of b values in multiple directions (generally three orthogonal planes are used in the liver) with the use signal averaging to increase SNR. Free-breathing techniques are associated with a higher SNR than are breath-hold techniques, and the longer possible acquisition time readily allows the application of multiple b values. However, the advantage of breath-hold imaging is the reduction in susceptibility artifact due to motion. Ghosting from respiratory motion and chemical shift artifact are reduced by fat suppression, which may be performed with a number of different techniques such as spectral fat suppression; water excitation; short inversion time inversion recovery, which provides uniform fat suppression over large volumes; and chemical fat-selective saturation and selective water excitation for analysis of smaller volumes made possible by the higher SNR of the images (14). To minimize T1 effects, a long repetition time is used. The repetition time for diffusion-weighted imaging in the liver is at least three times the T1 of a typical metastasis (>2500 msec). A commonly used protocol for diffusion-weighted imaging in the abdomen and pelvis is shown in the Table. It is important to note that ADC measurements obtained from breath-hold diffusion-weighted images cannot be directly translated into those obtained with free-breathing or respiratory-triggered techniques, which are reportedly associated with higher ADC values (15). ADC measurements may vary not only with different imaging parameters, but also with different types of scanners. The mechanism for comparative analysis of ADC has yet to be determined.
Commonly Used Protocol for Diffusion-weighted Imaging of the Abdomen and Pelvis
Note.—STIR = short inversion time inversion recovery.
Clinical Applications of Diffusion-weighted Imaging in the Liver
The clinical applications of diffusion-weighted imaging in the liver include detection and characterization of focal lesions, evaluation of posttreatment changes in the tumor microenvironment, and evaluation of diffuse liver disease.
Focal Liver Lesion Detection
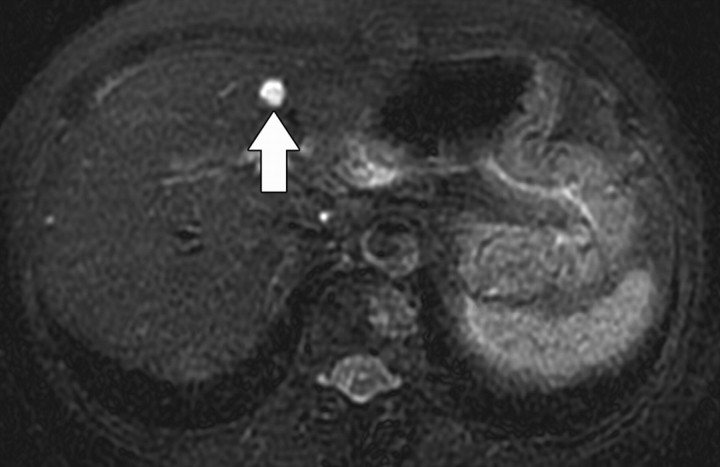
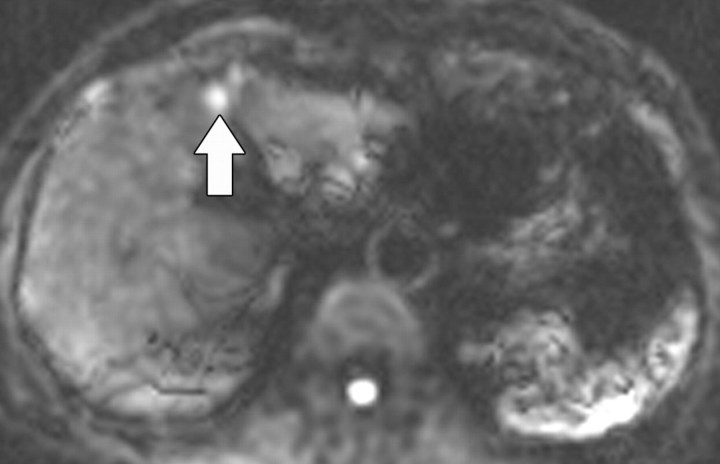
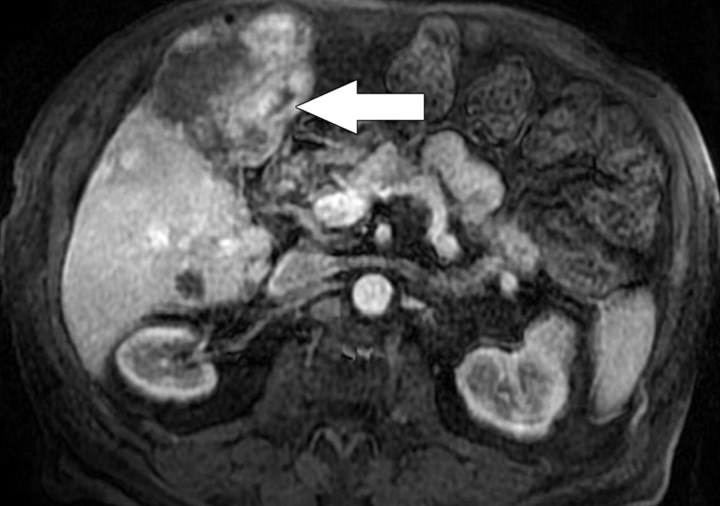
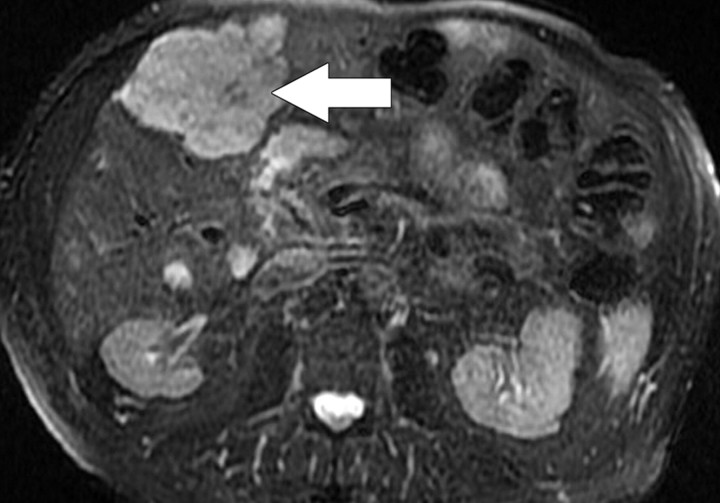
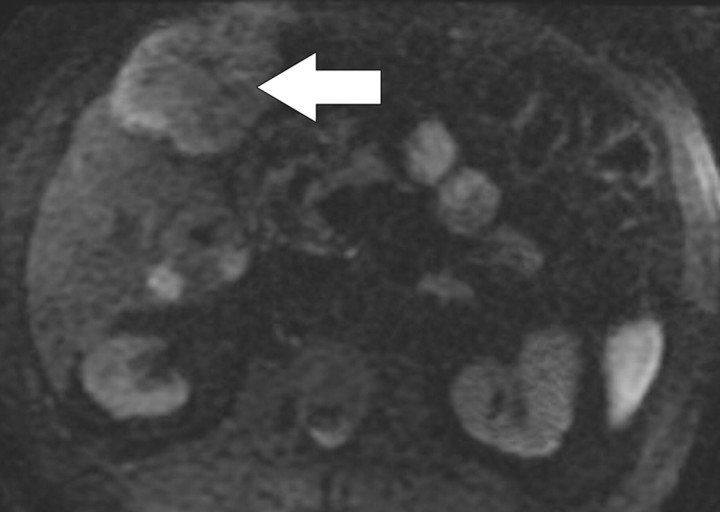
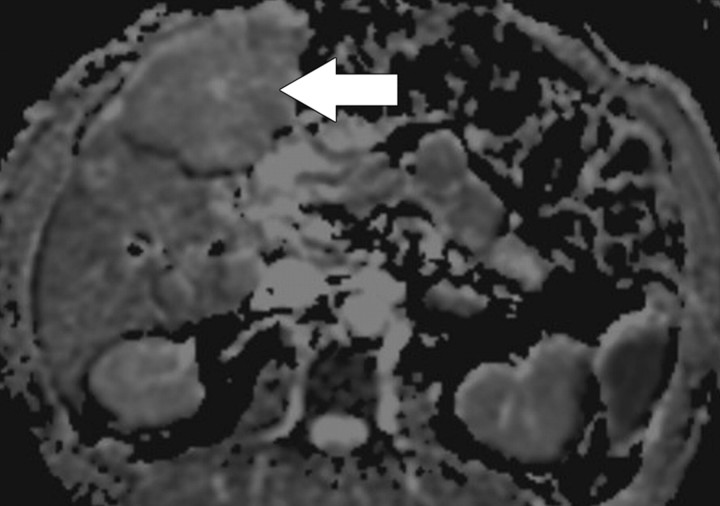
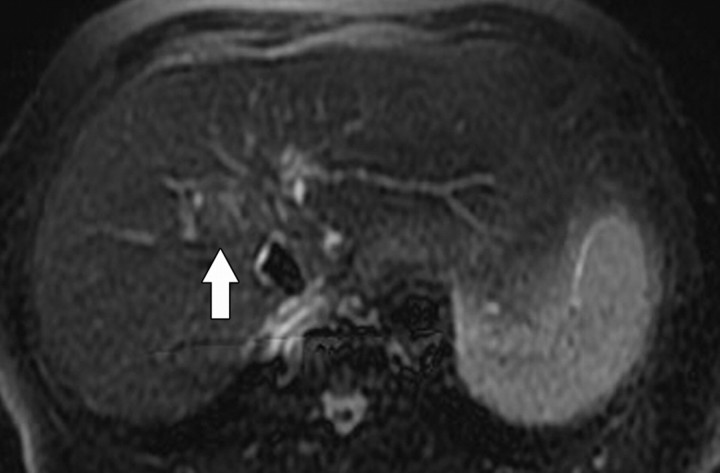
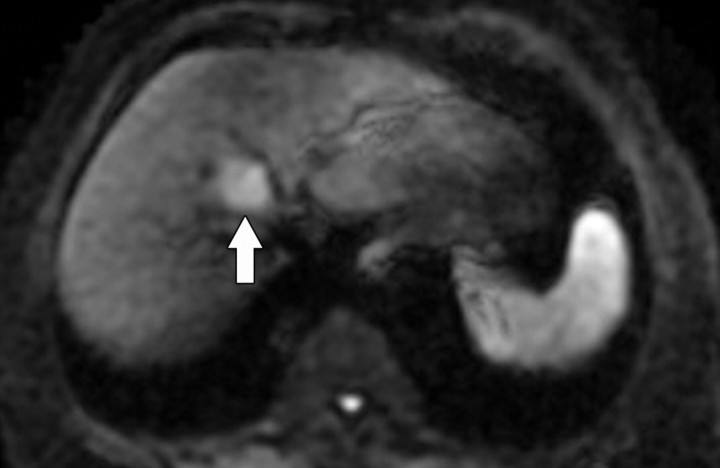
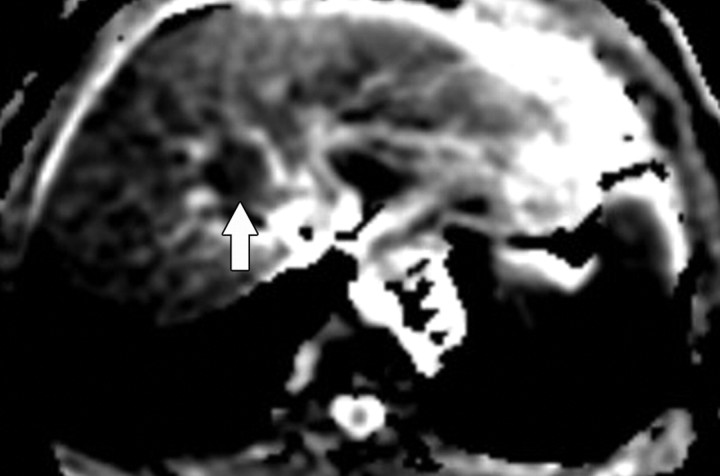
The ability to detect tumors with diffusion-weighted imaging is based on the premise that tumors have increased cellularity compared with healthy background tissue. Consequently, tumors demonstrate relatively higher signal intensity on diffusion-weighted images, with the contrast being accentuated by the relative reduction in signal intensity of the less cellular normal liver parenchyma (Fig 8). Diffusion-weighted imaging is increasingly being used for the detection of liver metastases (14). The actual detection of liver tumor is reported to be greater at low b values (50–150 sec/mm2); Parikh et al (16) reported significant improvement in the detection of focal liver lesions with low b-value diffusion-weighted imaging (88% accuracy) compared with T2-weighted imaging (70%) (17). High b values are considered to be more important for the characterization of focal liver lesions; however, the high signal intensity of a lesion at high b values is most effectively interpreted in conjunction with the lesion characteristics seen with other conventional MR sequences. Quantitative measurement of ADC has also been shown to be an indicator of malignancy in focal liver lesions, with a reduction in mean ADC (low signal intensity on an ADC map) of malignant lesions (Fig 8) compared with benign lesions (18). Bruegel et al (18) reported that an ADC threshold of 1.63 × 10⁻³ mm2/sec could be used to correctly characterize 88% of lesions as either benign or malignant. In the context of a partially necrotic tumor, the region of necrosis would be expected to demonstrate a higher ADC (less impeded diffusion) than would the nonnecrotic portion; therefore, a region of necrosis would result in heterogeneity of the signal intensity of the metastasis on diffusion-weighted images, such that the necrotic portion would show progressive reduction in signal intensity with increasing b values, unlike the nonnecrotic portion (1). The interpretation of absolute measurements has yet to be clarified, since there are many factors (instrumental, sequencing, biologic) that may potentially influence ADC measurement. Despite its current limitations with respect to focal lesion characterization, however, diffusion-weighted imaging may be helpful in lesion detection in patients with impaired renal function or contrast allergies precluding the use of dynamic gadolinium-enhanced imaging.
Figure 8a.
Hepatocellular carcinoma in an 81-year-old woman. (a) Gadolinium-enhanced T1-weighted MR image shows a hypervascular mass (arrow). (b) On a fat-suppressed fast spin-echo T2-weighted MR image, the mass is slightly hyperintense (arrow). (c) Diffusion-weighted image (b = 500 sec/mm2) shows the mass with high signal intensity (arrow). (d) On an ADC map, the mass demonstrates restricted diffusion (arrow).
Figure 8b.
Hepatocellular carcinoma in an 81-year-old woman. (a) Gadolinium-enhanced T1-weighted MR image shows a hypervascular mass (arrow). (b) On a fat-suppressed fast spin-echo T2-weighted MR image, the mass is slightly hyperintense (arrow). (c) Diffusion-weighted image (b = 500 sec/mm2) shows the mass with high signal intensity (arrow). (d) On an ADC map, the mass demonstrates restricted diffusion (arrow).
Figure 8c.
Hepatocellular carcinoma in an 81-year-old woman. (a) Gadolinium-enhanced T1-weighted MR image shows a hypervascular mass (arrow). (b) On a fat-suppressed fast spin-echo T2-weighted MR image, the mass is slightly hyperintense (arrow). (c) Diffusion-weighted image (b = 500 sec/mm2) shows the mass with high signal intensity (arrow). (d) On an ADC map, the mass demonstrates restricted diffusion (arrow).
Figure 8d.
Hepatocellular carcinoma in an 81-year-old woman. (a) Gadolinium-enhanced T1-weighted MR image shows a hypervascular mass (arrow). (b) On a fat-suppressed fast spin-echo T2-weighted MR image, the mass is slightly hyperintense (arrow). (c) Diffusion-weighted image (b = 500 sec/mm2) shows the mass with high signal intensity (arrow). (d) On an ADC map, the mass demonstrates restricted diffusion (arrow).
Prediction of Tumor Response and Evaluation of Posttreatment Tumor Changes
There is a growing interest in the prediction of tumor response to therapy with the application of diffusion-weighted imaging (3). Koh et al (19) described the observation of high ADC of colorectal metastases to the liver as an indicator of poor response to chemotherapy. A possible rationale for this observation is that higher ADC values may indicate tumor necrosis, which is thought to be representative of reduced perfusion and therefore reduced response to chemotherapy. A number of other studies have also reported an increase in lesion ADC following chemotherapy (1,3,20,21). Kamel et al (22) recently reported a significant increase in the ADC value of hepatocellular carcinoma 1–2 weeks after transarterial chemoembolization. The ability to detect early tumor response to therapy or to characterize features that are indicative of poor response is clearly clinically important, and further research is required in this area.
Evaluation of Diffuse Liver Disease
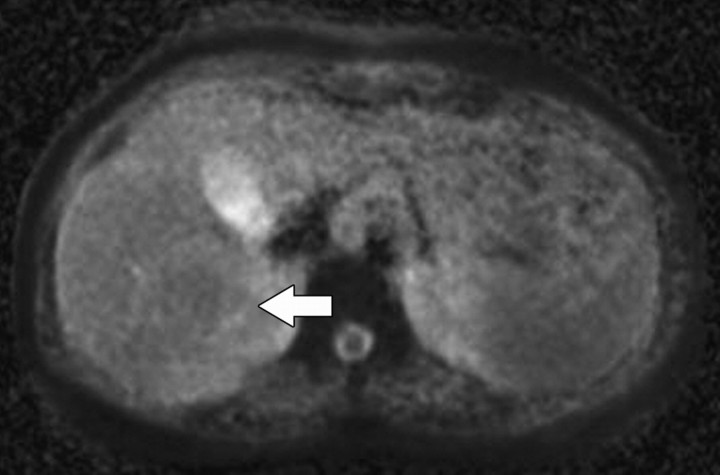
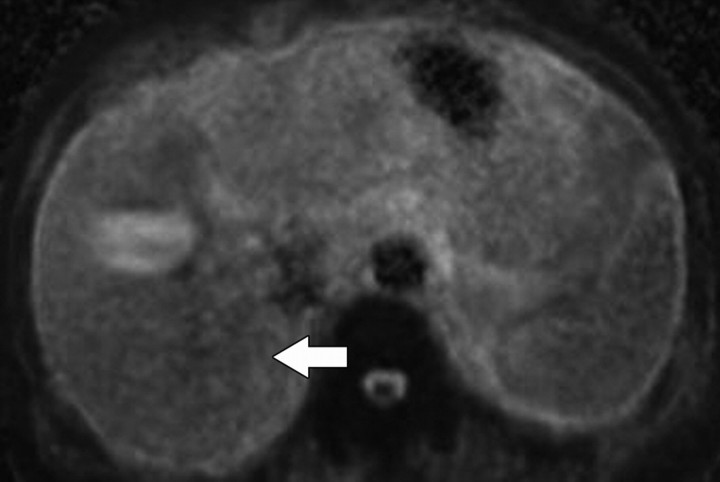
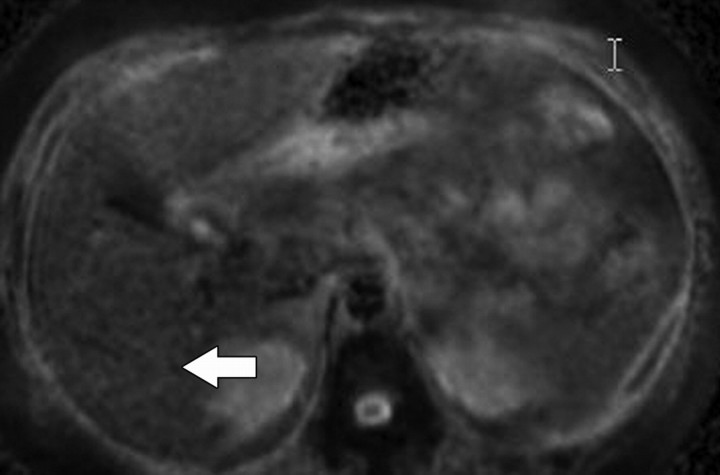
The obesity epidemic in the United States and the resultant burgeoning of obesity-related complications has led to an increased prevalence of nonalcoholic fatty disease with the potential to progress to significant liver injury (23,24). Increased hepatic steatosis and, in particular, collagen deposition in fibrosis and cirrhosis are associated with a reduction in ADC (Fig 9) (25), and it has been shown that the ADC in the liver is significantly reduced in patients with cirrhosis (9,26–29). An inverse correlation of ADC with severity of liver disease in patients with viral hepatitis has been documented but with variable results (27,30,31). Boulanger et al (30) studied 18 patients with hepatitis C and 10 control subjects and reported no correlation between ADC and fibrosis scores. Koinuma et al (27) reported a significant decrease in ADC with increased fibrosis score in 31 patients (21 with chronic hepatitis and 10 with cirrhosis). Taouli et al (9) reported that ADC could be used to detect stage 2 or greater fibrosis in 19 patients with chronic hepatitis. In preliminary studies (n = 63), Qayyum et al (25) observed that liver ADC was significantly lower in patients with nonalcoholic fatty liver disease than in healthy volunteers, with an area under the ROC (receiver operating characteristic) curve of 0.98. In addition, the correlation between ADC and liver fibrosis significantly increased with use of an ADC value of less than 1.6 × 10⁻³ mm2/sec when fat correction was performed on liver ADC values (25,32).
Figure 9a.
Diffuse liver disease. (a) ADC map obtained in a 36-year-old woman with grade 0 steatosis and stage 0 fibrosis shows no pathologic findings. Arrow indicates the right hepatic lobe. (b, c) ADC maps obtained in a 56-year-old man with nonalcoholic fatty liver disease, grade 1 steatosis, and stage 0 fibrosis (b) and in a 50- year-old woman with nonalcoholic fatty liver disease, grade 1 steatosis, and stage 1 fibrosis (c) show restricted diffusion in the right hepatic lobe (arrow). Regions of interest placed in the right hepatic lobe may be used to measure ADC. ADC measurements of the left lateral segment are typically degraded by cardiac motion.
Figure 9b.
Diffuse liver disease. (a) ADC map obtained in a 36-year-old woman with grade 0 steatosis and stage 0 fibrosis shows no pathologic findings. Arrow indicates the right hepatic lobe. (b, c) ADC maps obtained in a 56-year-old man with nonalcoholic fatty liver disease, grade 1 steatosis, and stage 0 fibrosis (b) and in a 50- year-old woman with nonalcoholic fatty liver disease, grade 1 steatosis, and stage 1 fibrosis (c) show restricted diffusion in the right hepatic lobe (arrow). Regions of interest placed in the right hepatic lobe may be used to measure ADC. ADC measurements of the left lateral segment are typically degraded by cardiac motion.
Figure 9c.
Diffuse liver disease. (a) ADC map obtained in a 36-year-old woman with grade 0 steatosis and stage 0 fibrosis shows no pathologic findings. Arrow indicates the right hepatic lobe. (b, c) ADC maps obtained in a 56-year-old man with nonalcoholic fatty liver disease, grade 1 steatosis, and stage 0 fibrosis (b) and in a 50- year-old woman with nonalcoholic fatty liver disease, grade 1 steatosis, and stage 1 fibrosis (c) show restricted diffusion in the right hepatic lobe (arrow). Regions of interest placed in the right hepatic lobe may be used to measure ADC. ADC measurements of the left lateral segment are typically degraded by cardiac motion.
Continuing technical improvements in diffusion-weighted imaging, with reduction in acquisition time and motion artifact as well as the ability to obtain multiple b values, is likely to improve the ability to stage diffuse liver disease. In addition to the many technical hurdles, quantitative analysis of diffusion-weighted images is hampered by factors of disease heterogeneity, confounding biologic factors such as the presence of liver fat versus fibrosis, the potential susceptibility effects of increased liver iron in advanced liver disease, and conditions caused by iron overload such as hemachromatosis.
Other Abdominopelvic Applications of Diffusion-weighted Imaging
Diffusion-weighted imaging is being used for a number of other investigational applications in the abdomen and pelvis, including detection of prostate cancer and uterine cancer and the assessment of focal renal disease.
Prostate cancer is a major cause of morbidity and mortality in American men and represents the second most common fatal cancer in this population. However, many cases of prostate cancer are subclinical, and microscopic foci of incidental prostate cancer can be detected in up to 40% of men at autopsy (33).
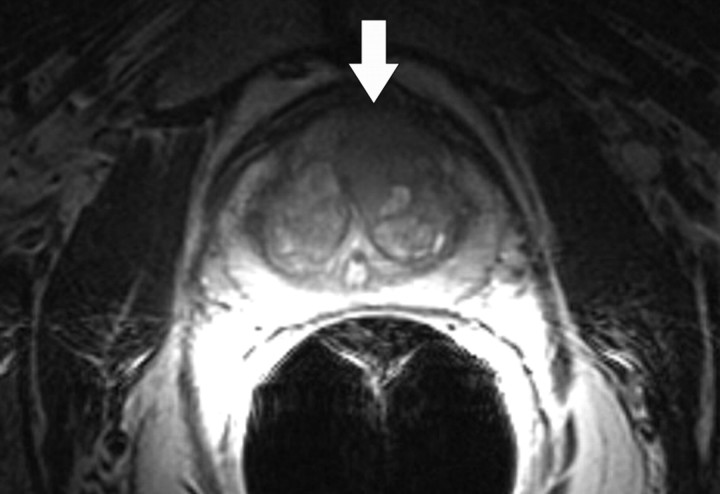
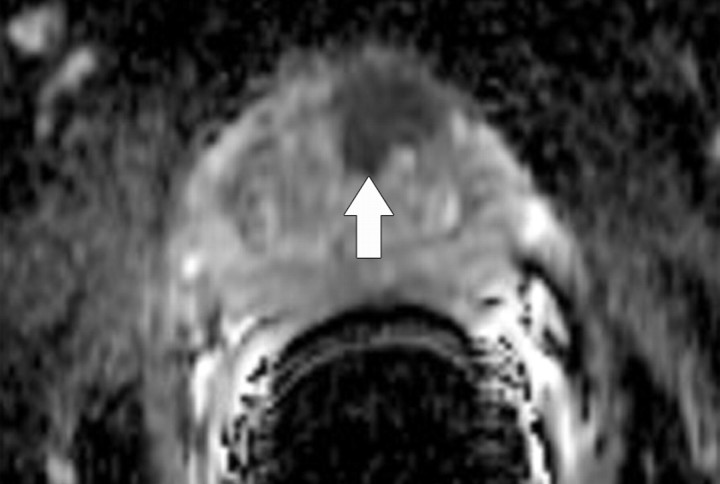
Prostate cancer commonly occurs in the peripheral zone of the prostate gland, with only approximately 20% of tumors arising from the central portion of the gland. The characteristic appearance of peripheral zone prostate cancer at MR imaging is a focal ovoid lesion with low T2 signal intensity. The difference in contrast between the tumor (low T2 signal intensity) and the peripheral zone (high T2 signal intensity) allows the detection of prostate cancer. Although this classic imaging appearance of tumor has been recognized for some time (34), low T2 signal intensity in the peripheral zone is nonspecific and may be caused by other nonmalignant conditions such as prostatitis, hemorrhage, and treatment change, which may make the MR imaging detection and staging of prostate cancer difficult. Prior studies have reported MR imaging to have a sensitivity of 77%–81% and a specificity of 46%–61% for the regional detection of prostate cancer (localization is commonly based on an arbitrary division of the prostate gland into six regions or sextants by subdividing the right and left halves of the gland into an apex, midgland, and base) (35). The detection of central gland tumors with conventional MR imaging poses a greater challenge due to the very heterogeneous T2-weighted appearance of the central gland typical of benign prostatic hypertrophy (Fig 10). Within the past decade, diffusion-weighted imaging has also been introduced as a means of detecting prostate cancer (36). Diffusion-weighted imaging of the prostate gland requires very high b values (1400–1600 sec/mm2) to overcome the effect of T2 shine-through within the peripheral zone. Studies have suggested that malignant nodules may have a lower ADC than does normal peripheral zone glandular tissue (1.30 × 10⁻³ mm2/sec vs 1.7 × 10⁻³ mm2/sec) (37). Prostate cancer demonstrates high signal intensity on diffusion-weighted images obtained at high b values and has low signal intensity on ADC maps (Fig 10). The imaging features of prostate cancer on diffusion-weighted images may be particularly helpful in the evaluation of regions of variable T2 signal intensity, such as within the central gland. The combined use of T2-weighted and diffusion-weighted imaging has been reported to be superior to T2-weighted imaging alone for tumor detection in the peripheral zone (38). It is important to note that the range of absolute ADC values typically overlaps when benign and malignant nodules are compared, and furthermore, that ADC variations may even occur in a patient as he or she ages (39).
Figure 10a.
Prostate cancer in a 64-year-old man. (a) On an axial T2-weighted MR image obtained with an endorectal coil, the peripheral zone of the prostate gland appears normal (ie, has high signal intensity), but a questionable focus of hypointensity is seen in the anterior left central portion of the gland (arrow). (b) Axial ADC map more clearly depicts the questionable area as a hypointense focal region of restricted diffusion (arrow).
Figure 10b.
Prostate cancer in a 64-year-old man. (a) On an axial T2-weighted MR image obtained with an endorectal coil, the peripheral zone of the prostate gland appears normal (ie, has high signal intensity), but a questionable focus of hypointensity is seen in the anterior left central portion of the gland (arrow). (b) Axial ADC map more clearly depicts the questionable area as a hypointense focal region of restricted diffusion (arrow).
A few studies have evaluated the role of diffusion-weighted imaging in the cervix. Normal cervical stroma contains large amounts of fibrous tissue, so that it demonstrates low signal intensity on T2-weighted images and delayed enhancement on gadolinium-enhanced images. Because of the greater cellularity of cervical cancer compared with the normal fibroelastic cervical stroma, tumor demonstrates higher signal intensity on T2-weighted images and greater enhancement on gadolinium-enhanced T1-weighted images. The relatively greater cellularity of cervical cancer may also explain the appearance of this tumor on diffusion-weighted images. Cervical carcinoma has been shown to demonstrate impeded diffusion relative to normal cervical stroma, and a significantly lower ADC has been reported in cervical carcinoma (1.09 ± 0.2 × 10⁻³ mm2/sec) compared with the normal cervix (1.79 ± 0.24 × 10⁻³ mm2/sec) (39). Although a few studies have investigated the use of diffusion-weighted imaging for lymph node assessment in malignancies (40), there is no established consensus as to whether this technique offers an advantage in gynecologic cancers. According to Whittaker et al (41), both benign and malignant lymph nodes demonstrate high signal intensity at high b values (>1000 sec/mm2). Furthermore, the presence of necrosis within a lymph node represents a potential pitfall in lymph node analysis.
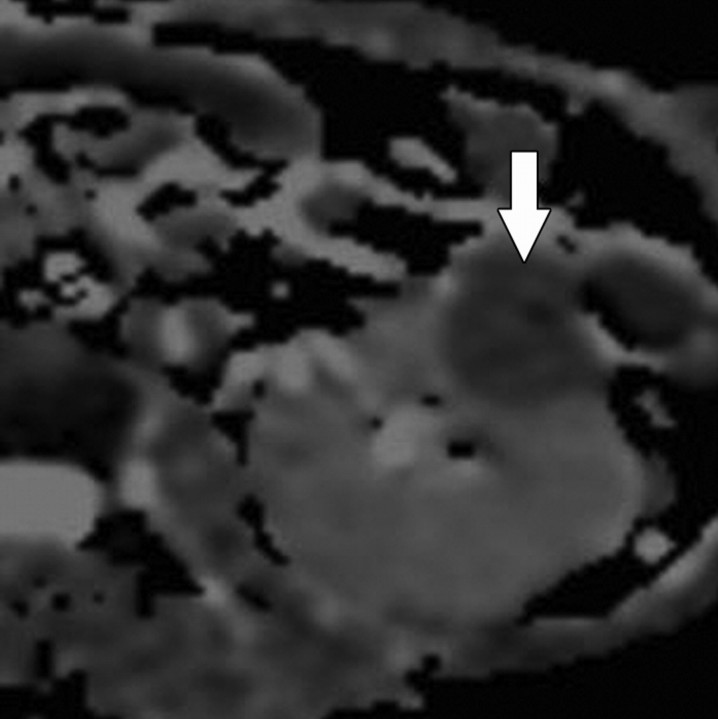
Diffusion-weighted imaging of the kidney requires high b values of at least 1000 sec/mm2. The differentiation of solid from cystic lesions in the kidney (Fig 11) and ADC-based differentiation of benign cysts from nonenhancing necrotic or cystic tumors have been suggested (42). However, the differentiation of solid benign from malignant tumors in the kidney remains a challenge (43).
Figure 11a.
Renal cell carcinoma in a 54-year-old woman. (a) Fast spin-echo T2-weighted MR image shows a mass (arrow) that arises from the left kidney. The mass demonstrates intermediate signal intensity, a finding that is consistent with a solid mass or hemorrhagic cyst. (b) Axial diffusion-weighted image (b = 500 sec/mm2) shows the mass with high signal intensity (arrow). (c) On an axial ADC map, the mass (arrow) demonstrates low signal intensity (restricted diffusion), a finding that is consistent with a solid tumor.
Figure 11b.
Renal cell carcinoma in a 54-year-old woman. (a) Fast spin-echo T2-weighted MR image shows a mass (arrow) that arises from the left kidney. The mass demonstrates intermediate signal intensity, a finding that is consistent with a solid mass or hemorrhagic cyst. (b) Axial diffusion-weighted image (b = 500 sec/mm2) shows the mass with high signal intensity (arrow). (c) On an axial ADC map, the mass (arrow) demonstrates low signal intensity (restricted diffusion), a finding that is consistent with a solid tumor.
Studies have also been performed in a variety of other tumors and organs, including colorectal carcinoma and the pancreas (44,45). Shinya et al (46) compared colonoscopic findings with computed tomographic (CT) and diffusion-weighted imaging findings in 18 patients with colorectal cancer. No significant difference was reported in the ability to detect early-stage cancer with CT versus diffusion-weighted imaging, but the latter modality was reported to be superior in the detection of liver metastases. ADC measurements in patients with colorectal cancer suggest a role for ADC in predicting treatment response (47,48). These studies suggest that tumors with a low baseline ADC are associated with a greater response to chemotherapy. Such an observation may be explained on the basis of a higher ADC for tumors with necrosis, which is predictive of poor chemotherapeutic response (1,48). Fattahi et al (45) reviewed diffusion-weighted images (b = 600 sec/mm2) obtained in 14 patients with mass-forming pancreatitis, 10 patients with adenocarcinoma, and 14 healthy subjects. Compared with focal pancreatitis, pancreatic adenocarcinoma was reported to show a significantly greater difference in signal intensity (greater diffusion impedance) relative to background pancreatic parenchyma on diffusion-weighted images.
In summary, diffusion-weighted imaging has the potential to help detect and characterize focal lesions in the liver and to help detect and stage diffuse liver disease. There has also been a growing interest in the ability to distinguish benign from malignant lesions in other organs in the abdomen and pelvis. The protocol used should be tailored to the organs being imaged, especially with respect to b value selection. Diffusion-weighted techniques involve many difficulties owing to low SNR, are prone to artifact, and continue to evolve. Although diffusion-weighted imaging lends itself well to providing functional and structural information about biologic tissues, it is best used to solve specific problems. To date, studies on diffusion-weighted imaging are small and vary with respect to technical parameters and instrumentation. Improvement in patient outcome with diffusion-weighted imaging has yet to be established. Interpretation of diffusion-weighted images should be performed in the context of other MR imaging morphologic findings and signal intensity characteristics.
Conclusion
Diffusion-weighted MR imaging is an evolving technology with the potential to improve tissue characterization when findings are interpreted in conjunction with findings obtained with other conventional MR imaging sequences.
Footnotes
The author is the spouse of an employee of Koninklijke Philips Electronics.
- ADC
- apparent diffusion coefficient
- RF
- radiofrequency
- SNR
- signal-to-noise ratio
References
- 1.Koh DM, Collins DJ. Diffusion-weighted MRI in the body: applications and challenges in oncology. AJR Am J Roentgenol 2007;188(6):1622–1635. [DOI] [PubMed] [Google Scholar]
- 2.Stejskal EO, Tanner JE. Spin diffusion measurements: spin-echo in the presence of a time dependent field gradient. J Chem Phys 1965;42:288–292. [Google Scholar]
- 3.Patterson DM, Padhani AR, Collins DJ. Technology insight: water diffusion MRI—a potential new biomarker of response to cancer therapy. Nat Clin Pract Oncol 2008;5(4):220–233. [DOI] [PubMed] [Google Scholar]
- 4.Neil JJ. Measurement of water motion (apparent diffusion) in biological systems. Concepts Magn Reson 1997;9:385–401. [Google Scholar]
- 5.Pagani E, Bizzi A, Di Salle F, De Stefano N, Filippi M. Basic concepts of advanced MRI techniques. Neurol Sci 2008;29(suppl 3):290–295. [DOI] [PubMed] [Google Scholar]
- 6.Yoshikawa K, Nakata Y, Yamada K, Nakagawa M. Early pathological changes in the parkinsonian brain demonstrated by diffusion tensor MRI. J Neurol Neurosurg Psychiatry 2004;75(3):481–484. [DOI] [PMC free article] [PubMed] [Google Scholar]
- 7.Eastwood JD, Lev MH, Wintermark M, et al. Correlation of early dynamic CT perfusion imaging with whole-brain MR diffusion and perfusion imaging in acute hemispheric stroke. AJNR Am J Neuroradiol 2003;24(9):1869–1875. [PMC free article] [PubMed] [Google Scholar]
- 8.Thoeny HC, De Keyzer F. Extracranial applications of diffusion-weighted magnetic resonance imaging. Eur Radiol 2007;17(6):1385–1393. [DOI] [PubMed] [Google Scholar]
- 9.Taouli B, Tolia AJ, Losada M, et al. Diffusion-weighted MRI for quantification of liver fibrosis: preliminary experience. AJR Am J Roentgenol 2007; 189(4):799–806. [DOI] [PubMed] [Google Scholar]
- 10.Taouli B, Chouli M, Martin AJ, Qayyum A, Coakley FV, Vilgrain V. Chronic hepatitis: role of diffusion-weighted imaging and diffusion tensor imaging for the diagnosis of liver fibrosis and inflammation. J Magn Reson Imaging 2008;28(1):89–95. [DOI] [PubMed] [Google Scholar]
- 11.Naganawa S, Sato C, Nakamura T, et al. Diffusion-weighted images of the liver: comparison of tumor detection before and after contrast enhancement with superparamagnetic iron oxide. J Magn Reson Imaging 2005;21(6):836–840. [DOI] [PubMed] [Google Scholar]
- 12.Nasu K, Kuroki Y, Nawano S, et al. Hepatic metastases: diffusion-weighted sensitivity-encoding versus SPIO-enhanced MR imaging. Radiology 2006;239 (1):122–130. [DOI] [PubMed] [Google Scholar]
- 13.Bammer R. Basic principles of diffusion-weighted imaging. Eur J Radiol 2003;45(3):169–184. [DOI] [PubMed] [Google Scholar]
- 14.Koh DM, Takahara T, Imai Y, Collins DJ. Practical aspects of assessing tumors using clinical diffusion-weighted imaging in the body. Magn Reson Med Sci 2007;6(4):211–224. [DOI] [PubMed] [Google Scholar]
- 15.Kwee TC, Takahara T, Koh DM, Nievelstein RA, Luijten PR. Comparison and reproducibility of ADC measurements in breathhold, respiratory triggered, and free-breathing diffusion-weighted MR imaging of the liver. J Magn Reson Imaging 2008;28 (5):1141–1148. [DOI] [PubMed] [Google Scholar]
- 16.Parikh T, Drew SJ, Lee VS, et al. Focal liver lesion detection and characterization with diffusion-weighted MR imaging: comparison with standard breath-hold T2-weighted imaging. Radiology 2008; 246(3):812–822. [DOI] [PubMed] [Google Scholar]
- 17.Bruegel M, Gaa J, Waldt S, et al. Diagnosis of hepatic metastasis: comparison of respiration-triggered diffusion-weighted echo-planar MRI and five T2-weighted turbo spin-echo sequences. AJR Am J Roentgenol 2008;191(5):1421–1429. [DOI] [PubMed] [Google Scholar]
- 18.Bruegel M, Holzapfel K, Gaa J, et al. Characterization of focal liver lesions by ADC measurements using a respiratory triggered diffusion-weighted single-shot echo-planar MR imaging technique. Eur Radiol 2008;18(3):477–485. [DOI] [PubMed] [Google Scholar]
- 19.Koh DM, Scurr E, Collins D, et al. Predicting response of colorectal hepatic metastasis: value of pre-treatment apparent diffusion coefficients. AJR Am J Roentgenol 2007;188(4):1001–1008. [DOI] [PubMed] [Google Scholar]
- 20.Hamstra DA, Rehemtulla A, Ross BD. Diffusion magnetic resonance imaging: a biomarker for treatment response in oncology. J Clin Oncol 2007;25 (26):4104–4109. [DOI] [PubMed] [Google Scholar]
- 21.Theilmann RJ, Borders R, Trouard TP, et al. Changes in water mobility measured by diffusion MRI predict response of metastatic breast cancer to chemotherapy. Neoplasia 2004;6(6):831–837. [DOI] [PMC free article] [PubMed] [Google Scholar]
- 22.Kamel IR, Liapi E, Reyes DK, Zahurak M, Bluemke DA, Geschwind JF. Unresectable hepatocellular carcinoma: serial early vascular and cellular changes after transarterial chemoembolization as detected with MR imaging. Radiology 2009;250(2):466–473. [DOI] [PMC free article] [PubMed] [Google Scholar]
- 23.Olshansky SJ, Passaro DJ, Hershow RC, et al. A potential decline in life expectancy in the United States in the 21st century. N Engl J Med 2005;352(11): 1138–1145. [DOI] [PubMed] [Google Scholar]
- 24.Falck-Ytter Y, Younossi ZM, Marchesini G, McCullough AJ. Clinical features and natural history of nonalcoholic steatosis syndromes. Semin Liver Dis 2001;21(1):17–26. [DOI] [PubMed] [Google Scholar]
- 25.Qayyum A, Nystrom M, Noworolski SM, Chu P, Westphalen AC, Vigneron DB. Accuracy of MR biometrics as a tool for predicting liver fibrosis in non-alcoholic fatty liver disease: incremental benefit of steatosis-corrected apparent diffusion coefficient [abstr]. In: Radiological Society of North America Scientific Assembly and Annual Meeting Program. Oak Brook, Ill: Radiological Society of North America, 2008; 617. [Google Scholar]
- 26.Amano Y, Kumazaki T, Ishihara M. Single-shot diffusion-weighted echo-planar imaging of normal and cirrhotic livers using a phased-array multicoil. Acta Radiol 1998;39(4):440–442. [DOI] [PubMed] [Google Scholar]
- 27.Koinuma M, Ohashi I, Hanafusa K, Shibuya H. Apparent diffusion coefficient measurements with diffusion-weighted magnetic resonance imaging for evaluation of hepatic fibrosis. J Magn Reson Imaging 2005;22(1):80–85. [DOI] [PubMed] [Google Scholar]
- 28.Qayyum A, Westphalen A, Noworolski S, et al. Magnetic resonance diffusion and spectroscopy findings in non-alcoholic steatohepatitis (abstr). Gastroenterology 2006;130(4 suppl 2):A824. [Google Scholar]
- 29.Noworolski SM, Vigneron DB, Merriman RB, Qayyum A. MR diffusion and 1H MR spectroscopy in non-alcoholic fatty liver disease [abstr]. In: Proceedings of the Fourteenth Meeting of the International Society for Magnetic Resonance in Medicine Berkeley, Calif: International Society for Magnetic Resonance in Medicine, 2006; 90. [Google Scholar]
- 30.Boulanger Y, Amara M, Lepanto L, et al. Diffusion-weighted MR imaging of the liver of hepatitis C patients. NMR Biomed 2003;16(3):132–136. [DOI] [PubMed] [Google Scholar]
- 31.Goodman ZD. Grading and staging systems for inflammation and fibrosis in chronic liver diseases. J Hepatol 2007;47(4):598–607. [DOI] [PubMed] [Google Scholar]
- 32.Qayyum A, Nystrom M, Noworolski SM, Chu P, Ghotb A, Vigneron DB. Staging liver fibrosis in non-alcoholic fatty liver disease: accuracy of MR biometrics [abstr]. In: Radiological Society of North America Scientific Assembly and Annual Meeting Program. Oak Brook, Ill: Radiological Society of North America, 2008; 572. [Google Scholar]
- 33.Stamey TA, McNeal JE. Adenocarcinoma of the prostate. In: , Walsh PC, Retik AB, Stamey TA, Vaughan ED, eds. Campbell’s urology. 6th ed Vol 2 Philadelphia, Pa: Saunders, 1992; 1159–1221. [Google Scholar]
- 34.Bezzi M, Kressel HY, Allen KS, et al. Prostatic carcinoma: staging with MR imaging at 1.5 T. Radiology 1988;169(2):339–346. [DOI] [PubMed] [Google Scholar]
- 35.Wefer AE, Hricak H, Vigneron DB, et al. Sextant localization of prostate cancer: comparison of sextant biopsy, magnetic resonance imaging and magnetic resonance spectroscopic imaging with step-section histology. J Urol 2000;164(2):400–404. [PubMed] [Google Scholar]
- 36.Issa B. In vivo measurement of the apparent diffusion coefficient in normal and malignant prostatic tissues using echo-planar imaging. J Magn Reson Imaging 2002;16(2):196–200. [DOI] [PubMed] [Google Scholar]
- 37.deSouza NM, Reinsberg SA, Scurr ED, Brewster JM, Payne GS. Magnetic resonance imaging in prostate cancer: the value of apparent diffusion coefficients for identifying malignant nodules. Br J Radiol 2007;80(950):90–95. [DOI] [PubMed] [Google Scholar]
- 38.Haider MA, van der Kwast TH, Tanguay J, et al. Combined T2-weighted and diffusion-weighted MRI for localization of prostate cancer. AJR Am J Roentgenol 2007;189(2):323–328. [DOI] [PubMed] [Google Scholar]
- 39.Naganawa S, Sato C, Kumada H, Ishigaki T, Miura S, Takizawa O. Apparent diffusion coefficient in cervical cancer of the uterus: comparison with the normal uterine cervix. Eur Radiol 2005;15(1):71–78. [DOI] [PubMed] [Google Scholar]
- 40.Sumi M, Van Cauteren M, Nakamura T. MR microimaging of benign and malignant nodes in the neck. AJR Am J Roentgenol 2006;186(3):749–757. [DOI] [PubMed] [Google Scholar]
- 41.Whittaker CS, Coady A, Culver L, Rustin G, Padwick M, Padhani AR. Diffusion-weighted MR imaging of female pelvic tumors: a pictorial review. RadioGraphics 2009;29(3):759–774; discussion 774–778. [DOI] [PubMed] [Google Scholar]
- 42.Zhang J, Tehrani YM, Wang L, Ishill NM, Schwartz LH, Hricak H. Renal masses: characterization with diffusion-weighted MR imaging—a preliminary experience. Radiology 2008;247(2):458–464. [DOI] [PubMed] [Google Scholar]
- 43.Squillaci E, Manenti G, Di Stefano F, Miano R, Strigari L, Simonetti G. Diffusion-weighted MR imaging in the evaluation of renal tumours. J Exp Clin Cancer Res 2004;23(1):39–45. [PubMed] [Google Scholar]
- 44.Rao SX, Zeng MS, Chen CZ, et al. The value of diffusion-weighted imaging in combination with T2-weighted imaging for rectal cancer detection. Eur J Radiol 2008;65(2):299–303. [DOI] [PubMed] [Google Scholar]
- 45.Fattahi R, Balci NC, Perman WH, et al. Pancreatic diffusion-weighted imaging (DWI): comparison between mass-forming focal pancreatitis (FP), pancreatic cancer (PC), and normal pancreas. J Magn Reson Imaging 2009;29(2):350–356. [DOI] [PubMed] [Google Scholar]
- 46.Shinya S, Sasaki T, Nakagawa Y, Guiquing Z, Yamamoto F, Yamashita Y. The efficacy of diffusion-weighted imaging for the detection of colorectal cancer. Hepatogastroenterology 2009;56(89):128–132. [PubMed] [Google Scholar]
- 47.DeVries AF, Kremser C, Hein PA, et al. Tumor microcirculation and diffusion predict therapy outcome for primary rectal carcinoma. Int J Radiat Oncol Biol Phys 2003;56(4):958–965. [DOI] [PubMed] [Google Scholar]
- 48.Dzik-Jurasz A, Domenig C, George M, et al. Diffusion MRI for prediction of response of rectal cancer to chemoradiation. Lancet 2002;360(9329): 307–308. [DOI] [PubMed] [Google Scholar]


