

Abstract
Magnetic resonance (MR) spectroscopy allows the demonstration of relative tissue metabolite concentrations along a two- or three-dimensional spectrum based on the chemical shift phenomenon. An MR spectrum is a plot of the signal intensity and frequency of a chemical or metabolite within a given voxel. At proton MR spectroscopy, the frequency at which a chemical or compound occurs depends on the configuration of the protons within the structure of that chemical. At in vivo proton MR spectroscopy, the frequency location of water is used as the standard of reference to identify a chemical. The frequency shift or location of chemicals relative to that of water allows generation of qualitative and quantitative information about the chemicals that occur within tissues, forming the basis of tissue characterization by MR spectroscopy. MR spectroscopy also may be used to quantify liver fat by measuring lipid peaks and to diagnose malignancy, usually by measuring the choline peak. Interpretation of MR spectroscopic data requires specialized postprocessing software and is subject to technical limitations including low signal-to-noise ratio, masking of metabolite peaks by dominant water and lipid peaks, partial-volume averaging from other tissue within the voxel, and phase and frequency shifts from motion. MR spectroscopy of the liver is an evolving technology with potential for improving the diagnostic accuracy of tissue characterization when spectra are interpreted in conjunction with MR images.
© RSNA, 2009
LEARNING OBJECTIVES
After reading this article and taking the test, the reader will be able to:
-
•.
Summarize the basic principles of MR spectroscopy.
-
•.
Describe the technique and applications of liver MR spectroscopy.
-
•.
Discuss the limitations of abdominal and pelvic MR spectroscopy.
Introduction
Magnetic resonance (MR) spectroscopy originally was established for brain imaging to characterize tumors, strokes, epilepsy, infection, and neurodegenerative disorders. For the past decade, there has been extensive research into improving the technology to develop applications within the abdomen and pelvis and to better understand the utility of MR spectroscopy for tissue characterization and malignancy detection.
In MR spectroscopy, signals from chemicals in tissue or metabolites are recorded. The metabolite peaks are identified primarily by their frequencies (ie, their position in the spectrum) and are expressed as a shift in frequency (in parts per million [ppm]) relative to a standard. The most common nuclei used for in vivo MR spectroscopy are protons (1H), sodium (23Na), and phosphorus (31P). The advantages of 1H spectroscopy are that it is easier to perform, it is more widely available, and it provides a much higher signal-to-noise ratio (SNR) than 23Na and 31P do. In 1H MR spectroscopy, the frequency location of a metabolite or chemical compound depends on the configuration of the protons within the chemical. Water is abundant in tissues, and its frequency location is used as the conventional standard for in vivo 1H MR spectroscopy, meaning that all other chemicals are identified by comparing their frequency location (frequency shift) to that of water. 1H MR spectroscopy typically is included as part of conventional MR imaging protocols to obtain functional information and may be performed in 5–15 minutes (1,2).
The objectives of this article are to describe the basic principles of 1H MR spectroscopy, describe the technique and its applications in the abdomen (with a focus on the liver), and outline common limitations.
Basic Principles of MR Spectroscopy
In conventional MR imaging, protons associated with chemicals such as water, fat, and amino acids produce a combined signal from each pixel that is used to generate the image. The spatial variations of phase and frequency are used to locate and select the pixels that make up the MR image. A consequence of using spatial mapping of metabolite signals to generate images is that valuable information regarding the composition of metabolites and chemicals within the imaged volume is lost.
In MR spectroscopy, as in conventional MR imaging, a radiofrequency pulse is applied, and the signal from the tissue is measured and Fourier transformed. However, whereas frequency variation at MR imaging is used for spatial localization of the signal to a voxel to create a cross-sectional image, at MR spectroscopy the frequency (the position along the x-axis) is used to separate and characterize the actual metabolites or chemicals within the voxel. Additional chemical information about tissue is obtained from the signal intensity (the position along the y-axis) and the line width, which may be used to determine the relative quantity of the chemical. The application of what amounts to a chemical shift phenomenon to generate qualitative and quantitative information about the chemicals that occur on the frequency scale between water and fat is the basis of MR spectroscopy. MR spectroscopy may seem esoteric, but MR imaging with frequency-selective fat suppression essentially uses a form of MR spectroscopy; molecules such as fat and water are separated by their frequency to identify or isolate them (Fig 1).
Figure 1.

Diagram shows metabolite frequency relative to water frequency. The peaks in 1H MR spectra correspond to different metabolites and are identified primarily by their frequencies. Metabolite frequency is expressed as a frequency shift relative to a reference, usually the water frequency, in parts per million. The dominant peaks in liver are those of water and lipids.
The objective of in vivo MR spectroscopy is to identify and quantify important chemicals in various body tissues and thereby characterize normal and diseased tissue types. Isotopes with an odd number of protons or neutrons have a nuclear magnetic moment and resonate when exposed to electromagnetic radiation at their Larmor precession frequency. Different isotopes have different Larmor frequencies, which occur in the radiofrequency range (3). The resonance frequency of protons ranges from approximately 10 MHz at 0.3 T to 300 MHz at 7 T. Increasing the field strength improves SNR and the separation of metabolite peaks. In a proton spectrum at 1.5 T, the metabolites are spread out between 63 and 64 MHz. To allow comparison of spectral measurements at different field strengths and to avoid the use of large, unwieldy numbers, resonance frequencies commonly are expressed as parts per million.
The “ppm scale” describes the resonance of a chemical (its position along the x-axis). Because the configuration of proton and electron interaction within chemical chains determines the resonance of a compound, it is possible to use parts per million to identify chemical components of the compound. The number of parts per million is calculated by dividing the difference in frequency (in hertz) of two peaks (the peak of interest and a reference peak, which is commonly water) by the operating frequency of the MR imaging system (in hertz). This calculation enables comparison of a peak location from a spectrum obtained at 1.5 T with a peak location from a spectrum obtained at a higher field strength (eg, 3 T, 4 T, or 7 T). Water is located at 4.26 ppm, which is commonly used as the reference frequency for in vivo abdominal MR spectroscopy (Fig 2). For empirical reasons, the ppm scale is arranged so that it reads from right to left (1). Examples of metabolites (and their frequencies) that are observable at 1H MR spectroscopy are provided in the Table. The tetra-methylsilane peak, a commonly used standard of reference for ex vivo MR spectroscopy, defines the 0-ppm location.
Figure 2.
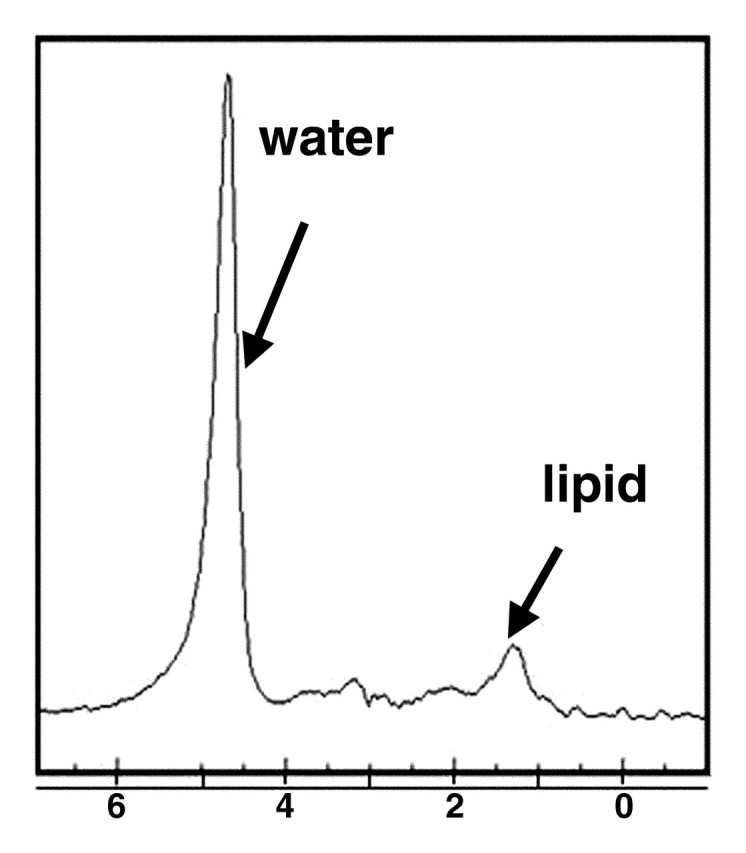
MR spectrum obtained in healthy liver in a 36-year-old woman shows the frequency locations of water and lipid peaks. By convention, the x-axis (frequency scale in parts per million) is plotted as a downward shift relative to water frequency.
Metabolites Detected with Proton MR Spectroscopy

The signal intensity, or height, of the metabolite peak (the amplitude measured along the y-axis) and the line width provide the “area” under a particular metabolite peak, which can be used to quantify the amount of observed chemical within the sampled voxel of tissue (1,2). Because there is no absolute scale for the y-axis, an internal denominator or ratio is necessary for objective quantification of the metabolite concentration; for this reason, there are no absolute units. Although the area under the spectral peak is proportional to the metabolite concentration within a given voxel of tissue, the relationship is not straightforward and depends on multiple instrumental and biophysical parameters, including the pulse sequence used, the metabolite relaxation times, the coupling of the sample to the coil, and J modulation of multiple resonances (2,4).
In Vivo Localization Techniques
MR spectroscopy may be performed by using a single- or multivoxel technique. The single-voxel technique is used to generate a cubic or rectangular volume of sampled tissue. Multivoxel MR spectroscopy allows the acquisition of multiple voxels in a one-, two-, or three-dimensional plane and either a single section or multiple sections. In both the single- and the multivoxel localization techniques, three orthogonal (x-, y-, and z-axis) section-selective gradients are applied to select a voxel for sampling. The advantage of the single-voxel technique is that the sampled volume is larger and therefore associated with a greater SNR. It is generally used for spectral measurements in the liver because the distance between the organ of interest and the surface coil is a limiting factor with use of a multivoxel technique.
There are two techniques that are commonly used for voxel selection: stimulated-echo acquisition mode (STEAM) and point-resolved spectroscopy (PRESS). In STEAM, a cubic or rectangular voxel is generated with three orthogonal section-selective 90° pulses (5). The use of 90° pulses creates a well-defined voxel within the sample and minimizes contamination of the signal from sources outside the region of interest. PRESS also generates a cubic or rectangular voxel with three orthogonal section-selective pulses; however, instead of three 90° pulses, it uses a 90° pulse followed by two 180° pulses (6,7). Although the resultant voxel is not as well defined as that generated with the STEAM technique, with PRESS the SNR is doubled (5).
The requirements for 1H MR spectroscopy include a uniform magnetic field, high SNR, very strong suppression of signal from water, and robust analysis. MR spectroscopy is far more sensitive to field nonuniformity than MR imaging is. The homogeneity of the magnetic field is the primary determinant of metabolite peak sharpness, or line width. The process for optimizing the magnetic field homogeneity over the sampled volume is referred to as “shimming the field.” As shimming lessens generalized and localized field inhomogeneities, line widths become smaller and the resolution of the peaks increases.
The use of automatic prescanning enables clinical MR spectroscopy to be performed in a reasonable amount of time by shimming the field, setting the observed frequency, optimizing the suppression and localization of pulses, setting the transmitter power, and selecting the receiver gain. For MR imaging of the liver, the duration of the automatic prescanning is approximately 15 seconds. Further refinement of field homogeneity may be achieved by manually adjusting the central frequency (manual shimming). The quality of the shim may be used as a measure of image quality (measured as the full width at 50% peak height) (8).
The SNR often is defined as the height of the largest metabolite peak divided by the root-mean-square of the amplitude of the noise in a signal- and artifact-free part of the spectrum. Improved SNR is achieved by making a number of technical adjustments, such as using a larger region of interest (SNR is proportional to the size of the region of interest), increasing the total acquisition time (SNR is proportional to the square root of the number of acquisitions), using a high-field-strength magnet, or using optimized hardware (a local receiving coil and higher field strengths) (9–11). SNR is reported to be higher with a 32- element phased-array receiver coil than with a four- or eight-element surface receiver coil (12).
The concentration of water in human tissues (around 110 mol) is 10,000 to 100,000 times greater than that of most tissue metabolites (around 1–10 mmol); consequently, the signal of water is dominant at 1H MR spectroscopy. This dominant water peak may make visualization of the metabolites of interest difficult because the water peak overlaps with adjacent small peaks and because scaling the signal intensity is difficult. To compensate, the signal from water may be suppressed with both STEAM and PRESS. Chemically selective saturation (CHESS) is a technique commonly used to suppress water and is applied before localization. CHESS involves the application of three frequency-selective pulses along with a dephasing gradient to suppress the water signal. Effective shimming before spectral sampling narrows the water line width so that CHESS can null the signal from water. It is not generally possible to suppress large water resonances that occur because of field inhomogeneities within the region of interest. Lipid peaks also dominate in the liver at 1H MR spectroscopy and may be suppressed by applying the frequency-selective or bandwidth filter described earlier (CHESS). The advantage of water and lipid suppression is that the residual signal from the metabolites with a resonance located between those of water and fat is more readily detected (has an increased line width). A limitation of this technique is that much of the signal from those metabolites is lost.
Robust analysis is essential for accurate interpretation of MR spectra; a number of pitfalls may make interpretation difficult, such as T1 and T2 effects, image resolution, contamination from blood vessels and respiratory motion, and coil sensitivity. Although the peak area measured at 1H MR spectroscopy is proportional to the metabolite concentration, it also is affected by T1 and T2 relaxation times (13). To accurately quantify metabolites, correction for the T1 and T2 relaxation times of the tissue is needed. For the purpose of liver fat estimation, a long repetition time (TR [eg, 4 sec]) may be used, because the relaxation values of fat and water are negligible when the TR is four to five times the T1 relaxation time (Fig 3). T2 correction has been based on hypothetical T2 relaxation times, but this approach may be associated with erroneous results. It has been suggested that calculating the least-squares algorithm from multiple echo times (TEs) is a more accurate method for determining T2 relaxation times (8,14).
Figure 3.

Diagram shows the T1 recovery curves of fat and water. Fat has shorter T1 relaxation time and recovers longitudinal magnetization faster than water. Recovery initially is rapid, then slows toward equilibrium, when protons are aligned along the static magnetic field (M0 ). The effects attributed to T1 properties of tissue components are reduced by using a long TR when the different tissue components, such as fat and water, have reached equilibrium. MZ = longitudinal magnetization.
Spectral resolution is determined by the line width (full width at one-half of the maximum peak height) and must be sufficient to allow differentiation of spectral features. An increased line width (reduced spectral resolution) results in increased overlap between metabolite peaks, with less distinct peak features. A reduced resolution and decreased SNR may lead to systematic over- or underestimation of metabolites regardless of their concentration. Poor resolution may be improved with better shimming, a reduced region of interest (although a size reduction must be balanced against the resultant reduction in SNR), or location of the region of interest away from tissue interfaces (11).
Common Challenges of MR Spectroscopy
A major barrier to intraabdominal MR spectroscopy is motion, which is largely due to respiration, cardiac pulsation, and peristalsis. Repeated small motions such as respiration and cardiac pulsation typically result in increased line widths, overall frequency shifts, reduced peak areas (phase cancellation), and decreased quality of water suppression (15). Respiratory motion and gross movement during liver MR spectroscopy may result in contamination of data by signal from an erroneously localized region of interest within the liver parenchyma, a blood vessel, or extrahepatic tissue.
In the presence of diffuse liver disease, the precise location of the voxel is less critical for data acquisition within the liver. It is more important to avoid including major vessels and the edge of the liver, which could result in contamination of the spectra (16). Liver MR spectroscopy often is performed with free breathing because of the long acquisition time required to improve SNR. However, diaphragmatic movement of 15–20 mm has been documented during free breathing (17). Such motion is of greater concern when performing MR spectroscopy in focal liver lesions than in diffuse liver disease, although in diffuse liver disease respiration still affects the MR spectra, causing phase shifts (Fig 4) (18).
Figure 4a.

Uncorrected MR spectra obtained in liver. (a) Multiple spectra acquired with free-breathing technique in a patient with grade 3 steatosis, without phase and frequency correction. The lipid and water peaks appear below as well as above the x-axis and are shifted toward the left because of respiratory motion. (b) Averaged spectrum obtained from uncorrected spectra in a shows a marked reduction in SNR, mischaracterization of the actual relative peak size, and inaccurate quantification of compounds. The larger peak on the right is lipid, and the water peak is on the left. Both peaks are barely detectable because of respiration-induced phase differences.
Figure 4b.

Uncorrected MR spectra obtained in liver. (a) Multiple spectra acquired with free-breathing technique in a patient with grade 3 steatosis, without phase and frequency correction. The lipid and water peaks appear below as well as above the x-axis and are shifted toward the left because of respiratory motion. (b) Averaged spectrum obtained from uncorrected spectra in a shows a marked reduction in SNR, mischaracterization of the actual relative peak size, and inaccurate quantification of compounds. The larger peak on the right is lipid, and the water peak is on the left. Both peaks are barely detectable because of respiration-induced phase differences.
In liver MR spectroscopy, multiple spectra typically are acquired and subsequently averaged to improve SNR. Respiratory motion–related phase shifts may result in some spectra being out of phase by as much as 180°, with a consequent cancelling effect on the amplitude of the averaged spectral peak. Such phase cancellation results in inaccuracy of the final averaged spectrum and a significantly reduced SNR (Figs 4, 5) (16,19–21). Such effects may be corrected after the spectra are acquired, if all acquisitions are stored separately and if signals are present that allow realignment or individual phasing (Fig 5).
Figure 5a.

Frequency- and phase-corrected MR spectra obtained in liver (same patient as in Fig 4). Averaged spectrum (b) derived from multiple spectral acquisitions corrected for phase and frequency (a) shows improved SNR. The large peak on the right is lipid, and the larger of the small peaks on the left is water.
Figure 5b.

Frequency- and phase-corrected MR spectra obtained in liver (same patient as in Fig 4). Averaged spectrum (b) derived from multiple spectral acquisitions corrected for phase and frequency (a) shows improved SNR. The large peak on the right is lipid, and the larger of the small peaks on the left is water.
Correction of respiration-related artifacts traditionally has been a manual process but is becoming available as part of automated MR spectroscopy postprocessing packages. Correction of phase shifts caused by respiratory motion cannot eliminate artifacts beyond frequency and phase variations such as may result from shifting of the region of interest into a different tissue. Dramatic differences in the metabolite profile may be caused by moving the region of interest out of the targeted tissue; for example, a voxel placed too close to the edge of the liver may move into the subcutaneous tissues or thorax because of gross patient movement; the diaphragm may move 15–20 mm, even during regular respiration (Fig 6). Such erroneous variation could cause liver MR spectroscopy findings to be misinterpreted, particularly if the region of interest is a small focal lesion. Such artifacts must be identified and removed before the spectra are averaged.
Figure 6.

Phase-corrected spectra from a patient with grade 3 steatosis. Even after correction of the 180° phase shifts attributed to respiratory motion, a large fluctuation is seen in the central spectrum, which shows a very different lipid-to-water ratio than the spectra acquired immediately before and after, a find-ing thought to result from displacement of the region of interest into adjacent tissues.
Other potential approaches to dealing with respiratory motion during liver MR spectroscopy include breath holding and respiratory gating. Breath-hold liver MR spectroscopy has been shown to reduce the variability of metabolite measurements, but it cannot provide the higher SNR of longer sequences (18). Respiratory gating, which is often used in MR spectroscopy, might be expected to reduce motion artifacts, particularly when there is minimal motion. However, sampling of different tissues at the same phase of the respiratory cycle may occur if the extent of the patient’s inspiration and expiration varies during imaging. Such large motion artifacts are not corrected with respiratory gating. Furthermore, respiratory gating leads to acquisition of individual scans at differing intervals; consequently, spectral data may be affected by a number of confounding factors, such as tissue relaxation times, acquisition times, and the patient’s breathing patterns (16).
MR Spectroscopy Technique
Patient preparation and contraindications for liver MR spectroscopy are similar to those for abdominal MR imaging. MR spectroscopy should be performed in patients who have fasted, because recent food intake affects portal blood flow and may affect relative liver water in addition to other metabolite concentrations such as lipids and glucose. High field strengths (1.5 T or higher) and a torso phased-array coil for signal reception are desirable for adequate SNR. Single-voxel liver spectroscopy is performed in a 10–20-mm3 voxel placed to avoid large intrahepatic vessels and at least 10 mm from the edge of the liver. Spectra are acquired with the use of CHESS for water suppression and with a PRESS technique (time series of 128 acquisitions at a TR of 2000–3000 msec and TE of 20–30 msec) (16,22). Liver MR spectroscopy often is performed with free breathing to achieve greater SNR. Respiratory variations may be reduced by using a compression belt to provide biofeedback to the patient.
Commercial software with various algorithms is available for postprocessing of MR spectroscopic data. Postprocessing includes motion correction (correction for frequency and phase shifts), automated water suppression, low-frequency filtration of residual water signal, Fourier transform, and Lorentzian-to-Gaussian transformation, and it may be fully or partially automated.
Applications of Liver MR Spectroscopy
Evaluation of Diffuse Liver Disease
Although diffuse liver fat, or steatosis (accumulation of fat within hepatocytes), was previously considered to be a relatively benign and self-limiting entity, it is now recognized as a characteristic feature of nonalcoholic fatty liver disease, which often leads to necroinflammatory changes (known as nonalcoholic steatohepatitis) and even cirrhosis. In the United States, 40 million adults are thought to have nonalcoholic fatty liver disease, which is strongly associated with obesity (23–26). Furthermore, it is thought that progression of steatosis to nonalcoholic steatohepatitis and beyond is the primary cause of cryptogenic cirrhosis, which is the third most common indication for liver transplantation (25). Liver steatosis also is a common feature of other types of diffuse liver disease, such as chronic viral hepatitis, especially that caused by hepatitis C infection; drug hepatotoxic effects (from antiretroviral therapy or chemotherapeutic agents such as tamoxifen and methotrexate); and excessive alcohol consumption (27–31).
In patients with a hepatitis C viral infection, liver steatosis is considered to be both a viral and metabolic consequence of the disease. The coexistence of steatosis and hepatitis C viral infection has several important prognostic implications, including a predisposition to more progressive liver fibrosis, a reduced response rate to antiviral therapy, and possibly an increased risk for hepatocellular carcinoma (24,32). Therefore, the assessment of liver fat in patients with diffuse liver disease may help identify those who are at greater risk for developing more advanced liver disease and those who may not respond well to pharmacologic therapies. Liver steatosis also is an important prognostic indicator when considering liver transplantation. The presence of liver fat affects both donor recovery and recipient graft failure due to ischemia and reperfusion injury. Many transplantation centers require that a living donor liver contain less than 5% steatosis, because the risk for recipient hepatic dysfunction increases with the graft steatosis grade (33–35).
Diagnosis and staging of diffuse liver disease, including nonalcoholic fatty liver disease, requires percutaneous liver biopsy. Steatosis may be microvesicular or macrovesicular, reflecting the presence of either small or large fat-containing vacuoles within hepatocytes. The severity of steatosis is commonly described by using a four-point histopathologic grading system that ranges from 0 to 3, according to the percentage of fat-containing hepatocytes. In grade 0 steatosis, less than 5% of hepatocytes contain fat; in grade 1, 6%–33%; in grade 2, 34%–66%; and in grade 3, more than 66% (35–37). This grading system incorporates the accepted normal amount of liver fat, which is less than 5%. Percutaneous liver biopsy is an invasive procedure with potentially serious complications, including hemorrhage, infection, and bile leak, with a reported mortality of up to 0.3% (38).
In view of the large population affected by liver steatosis, including children, liver biopsy is not an optimal means of detecting and monitoring the condition. Imaging offers a noninvasive approach to liver fat quantification, and, with the exception of MR spectroscopy, it can depict the entire liver. Commonly used alternatives to MR imaging and MR spectroscopy for quantification of liver fat are computed tomography (CT) and ultrasonography (US). At unenhanced CT, quantification of liver fat typically is based on a finding of liver attenuation that is more than 10 HU lower than that of the spleen. The use of contrast material–enhanced CT for this purpose is controversial. US is commonly used for screening and is useful for detecting moderate liver steatosis; however, the qualitative nature of the US grading system lends itself to marked interobserver variation (39).
1H MR spectroscopy has been shown to be effective for quantifying liver fat (Fig 7) (16,40–42). The lipid (triglyceride) spectrum consists of multiple peaks. In the liver, lipid peaks are identified at 0.9, 1.3, 2.0, 2.2, and 5.3 ppm. These peaks represent CH3 (0.9 ppm), (CH2) (1.3 ppm), CH2 (2.0 and 2.2 ppm), and CH (5.3 ppm) lipids. The dominant lipid peaks are caused by the resonance of methyl (-CH3) protons and methylene (-CH2) in the triglyceride molecule, at 0.9–1.1 ppm and 1.3–1.6 ppm, respectively, along the frequency domain (43) (Fig 8).
Figure 7a.

(a) Axial T2-weighted MR image shows the correct placement of the MR spectroscopy voxel (□) at the periphery of the liver, at least 1 cm from the edge, to avoid major vessels. (b) Liver spectrum from a healthy volunteer shows a smaller lipid peak relative to that of water. (c) Liver spectrum from a 25-year-old woman with nonalcoholic fatty liver disease shows a greater lipid peak relative to that of water.
Figure 7b.

(a) Axial T2-weighted MR image shows the correct placement of the MR spectroscopy voxel (□) at the periphery of the liver, at least 1 cm from the edge, to avoid major vessels. (b) Liver spectrum from a healthy volunteer shows a smaller lipid peak relative to that of water. (c) Liver spectrum from a 25-year-old woman with nonalcoholic fatty liver disease shows a greater lipid peak relative to that of water.
Figure 7c.

(a) Axial T2-weighted MR image shows the correct placement of the MR spectroscopy voxel (□) at the periphery of the liver, at least 1 cm from the edge, to avoid major vessels. (b) Liver spectrum from a healthy volunteer shows a smaller lipid peak relative to that of water. (c) Liver spectrum from a 25-year-old woman with nonalcoholic fatty liver disease shows a greater lipid peak relative to that of water.
Figure 8.

Diagram shows the dominant lipid peaks in liver MR spectra, which are produced by -CH3 and -CH2 resonances at 0.9–1.1 ppm and 1.3–1.6 ppm, respectively. Other liver metabolites generally are difficult to identify because of the small size of their peaks relative to those of water and lipids.
The size of the lipid peaks relative to that of the water peak increases with the steatosis grade (Fig 9). Measurement of total hepatic triglycerides involves integrating all five peaks (at 0.9, 1.3, 2.0, 2.2, and 5.3 ppm). Measurement of total lipids commonly includes only the peaks attributed to CH2 and CH3, because the peak attributed to CH (5.3 ppm) overlaps with that of water. The ratio of the total lipid peak area to the water peak area is calculated for each patient by using the total lipids measurement from the suppressed water sequence and the unsuppressed water measurement from the unsuppressed water sequence. The total lipids are calculated as a percentage relative to water by summing the individual resonance peaks to obtain the total hepatic triglyceride peak area, then dividing this value by the sum of the total lipid and water peak areas.
Figure 9a.

MR spectra show increasing size of lipid peaks relative to the water peak with increasing steatosis grade, from grade 0 (a) to grade 3 (d). Cho = choline, PME = phosphomonoesters.
Figure 9b.

MR spectra show increasing size of lipid peaks relative to the water peak with increasing steatosis grade, from grade 0 (a) to grade 3 (d). Cho = choline, PME = phosphomonoesters.
Figure 9c.

MR spectra show increasing size of lipid peaks relative to the water peak with increasing steatosis grade, from grade 0 (a) to grade 3 (d). Cho = choline, PME = phosphomonoesters.
Figure 9d.

MR spectra show increasing size of lipid peaks relative to the water peak with increasing steatosis grade, from grade 0 (a) to grade 3 (d). Cho = choline, PME = phosphomonoesters.
Recent studies have reported that altered liver metabolite profiles may be detected in patients with cirrhosis secondary to chronic liver disease of various causes with MR spectroscopy at a field strength of 1.5 T (44,45). Although quantification of liver fat with 1H MR spectroscopy is becoming increasingly accepted, the metabolite changes indicative of inflammation or fibrosis have not been clearly established. Cho et al (45) reported findings of increased mean ratios of glutamine and glutamate complex to lipids and phosphomonoesters to lipids with 1H MR spectroscopy in patients with hepatitis B or hepatitis C viral infection (n = 75). Lim et al (44,46) reported an increase in the ratio of phosphomonoester to phosphodiester in patients with cirrhosis, in comparison with those with mild hepatitis viral infection (n = 48), at 31P MR spectroscopy. In a separate study (46), they described a decrease in this ratio in patients treated with antiviral therapy for hepatitis C viral infection.
Evaluation of Focal Liver Disease
The use of liver MR spectroscopy for tumor assessment poses a greater challenge, because motion-related artifacts and voxel size have a greater impact when MR spectroscopy is restricted to a small region of interest.
The principal metabolite that has been targeted in focal liver disease is choline. Choline-containing compounds occur at a frequency of 3.2 ppm. In general, choline is elevated in tumors, because choline is a cell membrane component and increased cell turnover is associated with malignancy. 31P MR spectroscopy allows differentiation of the peaks of choline-containing compounds into phosphodiesters, including glycero-3-phosphocholine and glycero-3-phospho-ethanolamine, and phosphomonoesters, including phosphocholine and phosphoethanolamine (47).
Phosphomonoesters are involved in synthesis of phospholipids, an important cell membrane component. Increased levels of phosphomonoester are considered indicative of increased cell turnover, which occurs in tumors. Phosphodiesters are thought to represent a product of phospholipid breakdown and are reported to be an indicator of tumor necrosis (48). In vivo resolution of choline-containing compounds with 1H MR spectroscopy at 1.5–7 T is difficult. The dominant signal of choline-containing compounds at 1H MR spectroscopy is attributed to glycero-3-phosphocholine rather than phosphodiester or phosphomonoester (49). Studies of ex vivo spectral data have reported an increase in choline-containing compounds relative to lipids in hepatocellular carcinoma compared with the amounts found in background cirrhosis (50).
A few studies of in vivo MR spectroscopy reported an increase in choline levels within tumors such as hepatocellular carcinoma and a reduction in the lipid-to-choline ratio after transarterial embolization was performed for hepatocellular carcinoma (51,52). However, the ability to reliably distinguish benign and malignant tumors from normal liver parenchyma has yet to be established (51–53). A major limitation is the observation that relatively large amounts of choline-containing compounds may occur even in normal liver. Dominant spectra of choline-containing compunds also have been collected in colorectal metastases to the liver at 3 T (54). Preliminary ex vivo studies examining bile with both 31P and 1H MR spectroscopy at 11 T suggest that there are differences in the phospholipid content of bile from patients with hepatopancreaticobiliary cancer. Khan et al (55) reported that, with both 1H and 31P MR spectroscopy, the phosphatidylcholine signal (3.2 ppm) is reduced in the majority of cancer patients compared with that in noncancer patients.
New Directions
An important technical innovation that may play an important role in abdominal MR spectroscopy is the development of in vivo hyperpolarized carbon 13 (13C) MR spectroscopy. 13C-labeled substrates that have undergone dynamic nuclear polarization can enhance the 13C MR spectroscopy signal and the subsequent metabolic resonances 10,000–fold. Such labeling of substrates before their intravenous injection into the patient has the potential to allow fluxes in 13C to be monitored through multiple key biochemical pathways such as glycolysis, the citric acid cycle, and fatty acid synthesis.
A major advantage of 13C labeling is the associated large chemical shift range of 13C (250 ppm) in comparison with that of 1H (15 ppm), a characteristic that facilitates the resolution of metabolite peaks at 13C MR spectroscopy. Preliminary studies in rat kidneys and tumors at 1.5 T and 3 T showed the conversion of [1-13C]pyruvate to alanine, lactate, and bicarbonate. In addition, tumors were associated with increased levels of labeled lactate (56,57).
Conclusions
MR spectroscopy has potential tool utility for in vivo assessment of metabolic function, particularly with respect to liver fat quantification. It also may provide useful information about other aspects of diffuse liver disease (eg, inflammation and fibrosis), aid liver tumor detection, and help monitor tumor response to therapy. However, in vivo application of MR spectroscopy in the abdomen and pelvis is limited by spectral resolution, SNR, and motion.
In summary, MR spectroscopy of the liver is a novel evolving technology with the potential to improve tissue characterization when used in conjunction with other conventional MR sequences.
Footnotes
The author’s spouse is an employee of Koninklijke Philips Electronics.
- CHESS
- chemically selective saturation
- PRESS
- point-resolved spectroscopy
- SNR
- signal-to-noise ratio
- STEAM
- stimulated-echo acquisition mode
- TE
- echo time
- TR
- repetition time
References
- 1.Ross BD, Colletti P, Lin A. MR spectroscopy of the brain: neurospectroscopy. In: , Edelman RR, Hesselink JR, Zlatkin MB, Crues JV, eds. Clinical magnetic resonance imaging. 3rd ed Philadelphia, Pa: Saunders-Elsevier, 2006; 1840–1910. [Google Scholar]
- 2.Pagani E, Bizzi A, Di Salle F, De Stefano N, Filippi M. Basic concepts of advanced MRI technique. Neurol Sci 2008;29:290–295. [DOI] [PubMed] [Google Scholar]
- 3.Leach MO. Magnetic resonance spectroscopy (MRS) in the investigation of cancer at The Royal Marsden Hospital and The Institute of Cancer Research. Phys Med Biol 2006;51:R61–R82. [DOI] [PubMed] [Google Scholar]
- 4.Danielsen ER, Ross BD. Magnetic resonance spectroscopy diagnosis of neurological diseases. New York, NY: Marcel Dekker, 1999. [Google Scholar]
- 5.Frahm J, Bruhn H, Gyngell ML. Localized high resolution proton NMR spectroscopy using stimulated echoes: initial applications to human brain in vivo. Magn Reson Med 1989;9:79–93. [DOI] [PubMed] [Google Scholar]
- 6.Mullins PG, Chen H, Xu J, Caprihan A, Gasparovic C. Comparative reliability of proton spectroscopy techniques designed to improve detection of J-coupled metabolites. Magn Reson Med 2008;60: 964–969. [DOI] [PubMed] [Google Scholar]
- 7.Mueller-Lisse UG, Scherr MK. Proton MR spectroscopy of the prostate. Eur J Radiol 2007;63:351–360. [DOI] [PubMed] [Google Scholar]
- 8.Guiu B, Petit JM, Loffroy R, et al. Quantification of liver fat content: comparison of triple echo-echo chemical shift gradient-echo imaging and in vivo proton MR spectroscopy. Radiology 2009;250:95–102. [DOI] [PubMed] [Google Scholar]
- 9.Michaelis T, Merboldt KD, Bruhn H, Hänicke W, Frahm J. Absolute concentrations of metabolites in the adult human brain in vivo: quantification of localized proton MR spectra. Radiology 1993;187: 219–227. [DOI] [PubMed] [Google Scholar]
- 10.Fischbach F, Bruhn H. Assessment of in vivo 1H magnetic resonance spectroscopy in the liver: a review. Liver Int 2008;28:297–307. [DOI] [PubMed] [Google Scholar]
- 11.Kreis R. Issues of spectral quality in clinical 1H-magnetic resonance spectroscopy and a gallery of artifacts. NMR Biomed 2004;17:361–381. [DOI] [PubMed] [Google Scholar]
- 12.Schirmer T, Sodickson DK, Rofsky NM, et al. 1H liver spectroscopy with 32-element coil arrays [abstr]. In: Proceedings of the 13th Meeting of the International Society for Magnetic Resonance in Medicine Berkeley, Calif: International Society for Magnetic Resonance in Medicine, 2005; 1929. [Google Scholar]
- 13.Jansen JF, Backes WH, Nicolay K, Kooi ME. 1H MR spectroscopy of the brain: absolute quantification of metabolites. Radiology 2006;240:318–332. [DOI] [PubMed] [Google Scholar]
- 14.Thomsen C, Becker U, Winkler K, Christoffersen P, Jensen M, Henriksen O. Quantification of liver fat using magnetic resonance spectroscopy. Magn Reson Imaging 1994;12:487–495. [DOI] [PubMed] [Google Scholar]
- 15.Felblinger J, Kreis R, Boesch C. Effects of physiologic motion of the brain upon quantitative 1H-MRS: analysis and correction by retrogating. NMR Biomed 1998;11:107–114. [DOI] [PubMed] [Google Scholar]
- 16.Noworolski SM, Tien PC, Merriman R, Vigneron DB, Qayyum A. Respiratory motion-corrected proton magnetic resonance spectroscopy of the liver. Magn Reson Imaging 2009;27:570–576. [DOI] [PMC free article] [PubMed] [Google Scholar]
- 17.Schwarz AJ, Leach MO. Implications of respiratory motion for the quantification of 2D MR spectroscopic imaging data in the abdomen. Phys Med Biol 2000;45:2105–2116. [DOI] [PubMed] [Google Scholar]
- 18.Katz-Brull R, Rofsky NM, Lenkinski RE. Breath-hold abdominal and thoracic proton MR spectroscopy at 3T. Magn Reson Med 2003;50:461–467. [DOI] [PubMed] [Google Scholar]
- 19.Zhu G, Gheorghiu D, Allen PS. Motional degradation of metabolite signal strengths when using STEAM: a correction method. NMR Biomed 1992; 5:209–211. [DOI] [PubMed] [Google Scholar]
- 20.Star-Lack JM, Adalsteinsson E, Gold GE, Ikeda DM, Spielman DM. Motion correction and lipid suppression for 1H magnetic resonance spectroscopy. Magn Reson Med 2000;43:325–330. [DOI] [PubMed] [Google Scholar]
- 21.Gabr RE, Sathyanarayana S, Schar M, Weiss RG, Bottomley PA. On restoring motion-induced signal loss in single-voxel magnetic resonance spectra. Magn Reson Med 2006;56:754–760. [DOI] [PMC free article] [PubMed] [Google Scholar]
- 22.Cowin GJ, Jonsson JR, Bauer JD, et al. Magnetic resonance imaging and spectroscopy for monitoring liver steatosis. J Magn Reson Imaging 2008;28: 937–945. [DOI] [PubMed] [Google Scholar]
- 23.Ludwig J, Viggiano TR, McGill DB, Oh BJ. Non-alcoholic steatohepatitis: Mayo Clinic experiences with a hitherto unnamed disease. Mayo Clin Proc 1980;55:434–438. [PubMed] [Google Scholar]
- 24.Festi D, Colecchia A, Sacco T, Bondi M, Roda E, Marchesini G. Hepatic steatosis in obese patients: clinical aspects and prognostic significance. Obes Rev 2004;5:27–42. [DOI] [PubMed] [Google Scholar]
- 25.Angulo P. Nonalcoholic fatty liver disease. N Engl J Med 2002;346:1221–1231. [DOI] [PubMed] [Google Scholar]
- 26.Adams LA, Lymp JF, St Sauver J, et al. The natural history of nonalcoholic fatty liver disease: a population based cohort study. Gastroenterology 2005;129:113–121. [DOI] [PubMed] [Google Scholar]
- 27.Neuschwander-Tetri BA, Caldwell SH. Nonalcoholic steatohepatitis: summary of an AASLD Single Topic Conference. Hepatology 2003;37:1202–1219. [DOI] [PubMed] [Google Scholar]
- 28.Miller CM, Gondolesi GE, Florman S, et al. One hundred nine living donor transplants in adults and children: a single-center experience. Ann Surg 2001;234:301–311. [DOI] [PMC free article] [PubMed] [Google Scholar]
- 29.Ristig M, Drechsler H, Powderly WG. Hepatic steatosis and HIV infection. AIDS Patient Care STDs 2005;19:356–365. [DOI] [PubMed] [Google Scholar]
- 30.Burke A, Lucey MR. Non-alcoholic fatty liver disease, non-alcoholic steatohepatitis and orthotopic liver transplantation. Am J Transplant 2004;4: 686–693. [DOI] [PubMed] [Google Scholar]
- 31.Limanond P, Raman SS, Lassman C, et al. Macrovesicular hepatic steatosis in living related liver donors: correlation between CT and histologic findings. Radiology 2004;230:276–280. [DOI] [PubMed] [Google Scholar]
- 32.Negro F. Mechanisms and significance of liver steatosis in hepatitis C virus infection. World J Gastroenterol 2006;12:6756–6765. [DOI] [PMC free article] [PubMed] [Google Scholar]
- 33.Cho JY, Suh KS, Kwon CH, Yi NJ, Lee KU. Mild hepatic steatosis is not a major risk factor for hepatectomy and regenerative power is not impaired. Surgery 2006;139:508–515. [DOI] [PubMed] [Google Scholar]
- 34.Nikeghbalian S, Nejatollahi SM, Salahi H, et al. Does donor’s fatty liver change impact on early mortality and outcome of liver transplantation? Transplant Proc 2007;39:1181–1183. [DOI] [PubMed] [Google Scholar]
- 35.Brunt EM. Nonalcoholic steatohepatitis: definition and pathology. Semin Liver Dis 2001;21:3–16. [DOI] [PubMed] [Google Scholar]
- 36.Crowley H, Lewis WD, Gordon F, Jenkins R, Khettry U. Steatosis in donor and transplant liver biopsies. Hum Pathol 2000;31:1209–1213. [DOI] [PubMed] [Google Scholar]
- 37.Perez-Daga JA, Santoyo J, Suarez MA, et al. Influence of degree of hepatic steatosis on graft function and postoperative complications of liver transplantation. Transplant Proc 2006;38:2468–2470. [DOI] [PubMed] [Google Scholar]
- 38.Bravo AA, Sheth SG, Chopra S. Liver biopsy. N Engl J Med 2001;344:495–500. [DOI] [PubMed] [Google Scholar]
- 39.Qayyum A, Chen DM, Breiman RS, et al. Evaluation of diffuse liver steatosis by ultrasound, CT, and MR imaging: which modality is best? Clin Imaging 2009;33:110–115. [DOI] [PMC free article] [PubMed] [Google Scholar]
- 40.Thomas EL, Hamilton G, Patel N, et al. Hepatic triglyceride content and its relation to body adiposity: a magnetic resonance imaging and proton magnetic resonance spectroscopy study. Gut 2005;54: 122–127. [DOI] [PMC free article] [PubMed] [Google Scholar]
- 41.Longo R, Pollesello P, Ricci C, et al. Proton MR spectroscopy in quantitative in vivo determination of fat content in human liver steatosis. J Magn Reson Imaging 1995;5:281–285. [DOI] [PubMed] [Google Scholar]
- 42.Anderwald C, Bernroider E, Krssak M, et al. Effects of insulin treatment in type 2 diabetic patients on intracellular lipid content in liver and skeletal muscle. Diabetes 2002;51:3025–3032. [DOI] [PubMed] [Google Scholar]
- 43.Torriani M, Thomas BJ, Halpern EF, Jensen ME, Rosenthal DI, Palmer WE. Intramyocellular lipid quantification: repeatability with 1H MR spectroscopy. Radiology 2005;236:609–614. [DOI] [PubMed] [Google Scholar]
- 44.Lim AK, Patel N, Hamilton G, Hajnal JV, Goldin RD, Taylor-Robinson SD. The relationship of in vivo 31P MR spectroscopy to histology in chronic hepatitis C. Hepatology 2003;37:788–794. [DOI] [PubMed] [Google Scholar]
- 45.Cho SG, Kim MY, Kim HJ, et al. Chronic hepatitis: in vivo proton MR spectroscopic evaluation of the liver and correlation with histopathologic findings. Radiology 2001;221:740–746. [DOI] [PubMed] [Google Scholar]
- 46.Lim AK, Patel N, Hamilton G, et al. 31P MR spectroscopy in assessment of response to antiviral therapy for hepatitis C virus-related liver disease. AJR Am J Roentgenol 2007;189:819–823. [DOI] [PubMed] [Google Scholar]
- 47.Bates TE, Williams SR, Gadian DG. Phosphodiesters in the liver: the effect of field strength on the 31 P signal. Magn Reson Med 1989;12:145–150. [DOI] [PubMed] [Google Scholar]
- 48.Maris JM, Evans AE, McLaughlin AC, et al. 31P nuclear magnetic resonance spectroscopic investigation of human neuroblastoma in situ. N Engl J Med 1985;312:1500–1505. [DOI] [PubMed] [Google Scholar]
- 49.Podo F. Tumour phospholipid metabolism. NMR Biomed 1999;12:413–439. [DOI] [PubMed] [Google Scholar]
- 50.Soper R, Himmelreich U, Painter D, et al. Pathology of hepatocellular carcinoma and its precursors using proton magnetic resonance spectroscopy and a statistical classification strategy. Pathology 2002;34: 417–422. [DOI] [PubMed] [Google Scholar]
- 51.Li CW, Kuo YC, Chen CY, et al. Quantification of choline compounds in human hepatic tumors by proton MR spectroscopy at 3 T. Magn Reson Med 2005;53:770–776. [DOI] [PubMed] [Google Scholar]
- 52.Wu B, Peng WJ, Wang PJ, et al. In vivo 1H magnetic resonance spectroscopy in evaluation of hepatocellular carcinoma and its early response to transcatheter arterial chemoembolization. Chin Med Sci J 2006;21:258–264. [PubMed] [Google Scholar]
- 53.Kuo YT, Li CW, Chen CY, Jao J, Wu D, Liu GC. In vivo proton magnetic resonance spectroscopy of large focal hepatic lesions and metabolite change of hepatocellular carcinoma before and after transcatheter arterial chemoembolization using a 3.0 T MR scanner. J Magn Reson Imaging 2004;19:598–604. [DOI] [PubMed] [Google Scholar]
- 54.Dzik-Jurasz AS, Murphy PS, George M, et al. Human rectal adenocarcinoma: demonstration of 1H-MR spectra in vivo at 1.5 T. Magn Reson Med 2002;47:809–811. [DOI] [PubMed] [Google Scholar]
- 55.Khan SA, Cox IJ, Thillainayagam AV, Bansi DS, Thomas HC, Taylor-Robinson SD. Proton and phosphorus-31 nuclear magnetic resonance spectroscopy of human bile in hepatopancreaticobiliary cancer. Eur J Gastroenterol Hepatol 2005;17:733–738. [DOI] [PubMed] [Google Scholar]
- 56.Kurhanewicz J, Bok R, Nelson SJ, Vigneron DB. Current and potential applications of clinical 13C MR spectroscopy. J Nucl Med 2008;49:341–344. [DOI] [PMC free article] [PubMed] [Google Scholar]
- 57.Costello LC, Franklin RB. ‘Why do tumour cells glycolyse?’: from glycolysis through citrate to lipogenesis. Mol Cell Biochem 2005;280:1–8. [DOI] [PMC free article] [PubMed] [Google Scholar]