

Abstract
Chronic liver disease is a major public health problem worldwide. Liver fibrosis, a common feature of almost all causes of chronic liver disease, involves the accumulation of collagen, proteoglycans, and other macromolecules within the extracellular matrix. Fibrosis tends to progress, leading to hepatic dysfunction, portal hypertension, and ultimately cirrhosis. Liver biopsy, the standard of reference for diagnosing liver fibrosis, is invasive, costly, and subject to complications and sampling variability. These limitations make it unsuitable for diagnosis and longitudinal monitoring in the general population. Thus, development of a noninvasive, accurate, and reproducible test for diagnosis and monitoring of liver fibrosis would be of great value. Conventional cross-sectional imaging techniques have limited capability to demonstrate liver fibrosis. In clinical practice, imaging studies are usually reserved for evaluation of the presence of portal hypertension or hepatocellular carcinoma in cases that have progressed to cirrhosis. In response to the rising prevalence of chronic liver diseases in Western nations, a number of imaging-based methods including ultrasonography-based transient elastography, computed tomography–based texture analysis, and diverse magnetic resonance (MR) imaging–based techniques have been proposed for noninvasive diagnosis and grading of hepatic fibrosis across its entire spectrum of severity. State-of-the-art MR imaging–based techniques in current practice and in development for noninvasive assessment of liver fibrosis include conventional contrast material–enhanced MR imaging, double contrast-enhanced MR imaging, MR elastography, diffusion-weighted imaging, and MR perfusion imaging.
© RSNA, 2009
LEARNING OBJECTIVES FOR TEST 3
After reading this article and taking the test, the reader will be able to:
-
•.
Discuss the clinical relevance of detection and characterization of liver fibrosis.
-
•.
Describe use of liver biopsy in diagnosis and staging of liver fibrosis, including the limitations of this technique.
-
•.
List the MR imaging techniques that have an emerging role in noninvasive assessment of liver fibrosis.
Introduction
The term liver fibrosis refers to the excess deposition of collagen, proteoglycans, and other macromolecules in the extracellular matrix in response to repetitive liver injury from various causes (1). Activation of hepatic stellate cells, the main collagen-producing cells, by fibrogenic cytokines is a central event in fibrosis. Other cells such as portal fibroblasts and bone marrow–derived cells may also be involved in the fibrogenic process (1).
Originally considered to be irreversible, a marker of injury, and a component of the wound-healing mechanism, hepatic fibrosis is now regarded as a dynamic process with potential for regression (2). The accumulation of proteins in the extracellular matrix promotes the formation of scars that bridge together adjacent portal triads and central veins. Ultimately, progressive hepatic fibrosis leads to cirrhosis, in which fibrous bands carve the liver parenchyma into nodules of regenerating hepatocytes, a characteristic feature of almost all end-stage liver disease (2).
The current clinical standard of reference for assessing liver fibrosis is liver biopsy. However, owing to its invasiveness, costs, possible complications, and sampling variability, biopsy is not an ideal tool for screening, longitudinal monitoring, and assessing therapeutic response, nor is it appropriate for epidemiologic research (3). Conventional cross-sectional imaging techniques have limited capability for detection of liver fibrosis. In recent years, a number of imaging-based methods for noninvasively assessing liver fibrosis have emerged, including ultrasonography (US)–based transient elastography, computed tomography (CT)–based texture analysis, and new magnetic resonance (MR) imaging–based techniques. Although promising, these new MR imaging techniques have yet to be validated in large clinical trials, and most of them should be considered experimental.
In this article, we provide an overview of the state-of-the-art MR imaging–based techniques being used in the evaluation of liver fibrosis. In addition, we review basic concepts, explain the pathophysiologic basis for MR imaging features of advanced liver fibrosis, and present key teaching points with histologic, clinical, and ex vivo illustrations. We also discuss differential diagnosis and imaging pitfalls.
Epidemiology
Chronic liver disease is a major public health problem worldwide. In the United States, the prevalence of chronic liver disease and cirrhosis has risen due to two main factors. First, there was a silent epidemic of hepatitis C virus (HCV) infection in the 1960s to 1980s, before the development of serum tests for the virus. During that period, about 4 million Americans became chronically infected with HCV. It is known that chronic infection with HCV progresses to cirrhosis in about 20% of affected patients over 20–40 years. Hence, although the prevalence of new HCV infection is decreasing owing to preventive measures, the prevalence of advanced fibrosis and cirrhosis related to infections acquired decades ago continues to rise and is expected to peak in the mid-2010s (4).
Second, owing to the epidemic of overweight and obesity in the U.S. population, the number of Americans with nonalcoholic fatty liver disease is rising at an alarming rate. It is estimated that there are over 40 million adults and 6 million children with this condition in the United States. About 10%–20% of these individuals are expected to develop liver fibrosis in their lifetimes, and some of these cases will progress to cirrhosis (5).
Additional causes of chronic liver disease in the United States include excessive alcohol consumption, hepatitis B virus infection, autoimmune hepatitis, primary biliary cirrhosis, primary sclerosing cholangitis, hereditary hemochromatosis, Wilson disease, congenital hepatic fibrosis, α1-antitrypsin deficiency, and cystic fibrosis (6).
Clinical Manifestations
Liver fibrosis usually has an insidious onset and progresses slowly over decades. Clinically, patients remain asymptomatic or have only mild, nonspecific symptoms until the development of cirrhosis (3). Cirrhotic patients may present with various sequelae of hepatic decompensation, including variceal hemorrhage, ascites, hepatic encephalopathy, and hepatic and renal failure (6). Cirrhosis is also a risk factor for the development of hepatocellular carcinoma (HCC), one of the main causes for liver transplantation in the United States (6). In rare cases, rapidly progressive fibrosis may be observed in patients with HCV infection after liver transplantation or in patients with human immunodeficiency virus–HCV coinfection (3).
Diagnosis and Staging of Liver Fibrosis
Diagnosis and staging of hepatic fibrosis are currently performed with histologic examination of tissue obtained by means of liver biopsy. Fibrosis due to chronic viral hepatitis and fibrosis due to fatty liver disease evolve in a progressive and stereotypical fashion, but the pattern of fibrosis differs in the two conditions.
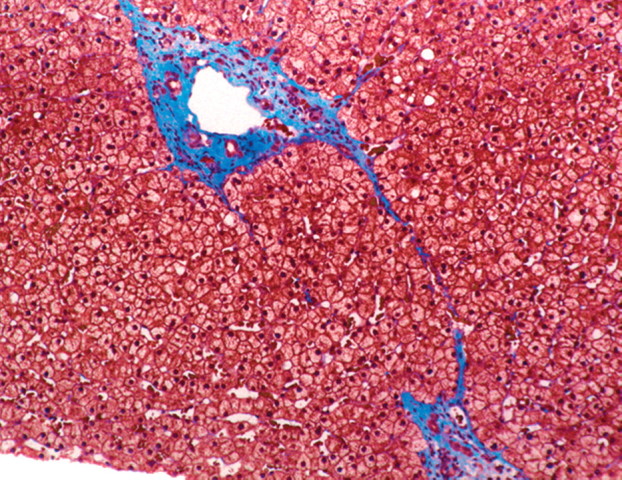
In viral hepatitis, fibrosis begins in the portal triads and initially manifests histologically as fibrous expansion of the portal triads (Fig 1). Next, fibrous septa grow from the expanded portal triad into the surrounding hepatic parenchyma. These septa lengthen, thicken, and eventually form fibrous bridges that link adjacent portal triads and central veins. As the liver injury continues, the bridges continue to enlarge and coalesce and eventually divide the liver into rounded islands of hepatic parenchyma (regenerative nodules) surrounded by fibrous tissue (Fig 1).
Figure 1a.
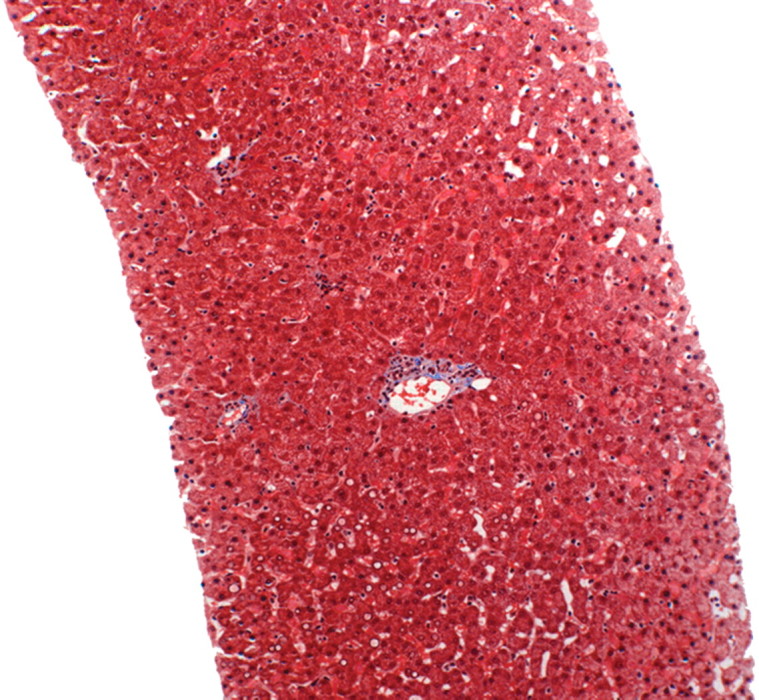
Progression of fibrosis in viral hepatitis. Photomicrographs (original magnification, ×40; trichrome stains) of histologic sections from liver biopsy specimens show the progression of fibrosis in viral hepatitis: normal portal triads with no signs of fibrosis (stage F0) (a), portal fibrous expansion (stage F1) (b), thin fibrous septa emanating from portal triads (stage F2) (c), fibrous septa bridging portal triads and central veins (stage F3) (d), and cirrhosis (stage F4) (e), which appears as nodules of liver parenchyma separated by thick fibrous bands.
Figure 1b.

Progression of fibrosis in viral hepatitis. Photomicrographs (original magnification, ×40; trichrome stains) of histologic sections from liver biopsy specimens show the progression of fibrosis in viral hepatitis: normal portal triads with no signs of fibrosis (stage F0) (a), portal fibrous expansion (stage F1) (b), thin fibrous septa emanating from portal triads (stage F2) (c), fibrous septa bridging portal triads and central veins (stage F3) (d), and cirrhosis (stage F4) (e), which appears as nodules of liver parenchyma separated by thick fibrous bands.
Figure 1c.
Progression of fibrosis in viral hepatitis. Photomicrographs (original magnification, ×40; trichrome stains) of histologic sections from liver biopsy specimens show the progression of fibrosis in viral hepatitis: normal portal triads with no signs of fibrosis (stage F0) (a), portal fibrous expansion (stage F1) (b), thin fibrous septa emanating from portal triads (stage F2) (c), fibrous septa bridging portal triads and central veins (stage F3) (d), and cirrhosis (stage F4) (e), which appears as nodules of liver parenchyma separated by thick fibrous bands.
Figure 1d.
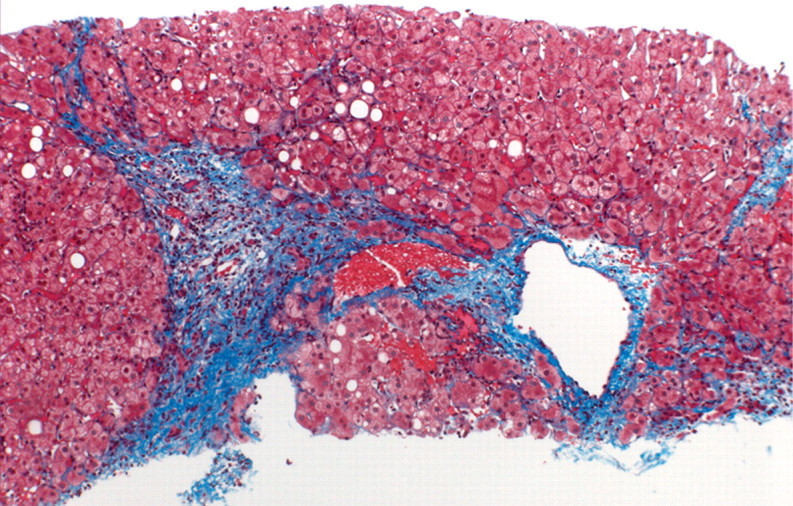
Progression of fibrosis in viral hepatitis. Photomicrographs (original magnification, ×40; trichrome stains) of histologic sections from liver biopsy specimens show the progression of fibrosis in viral hepatitis: normal portal triads with no signs of fibrosis (stage F0) (a), portal fibrous expansion (stage F1) (b), thin fibrous septa emanating from portal triads (stage F2) (c), fibrous septa bridging portal triads and central veins (stage F3) (d), and cirrhosis (stage F4) (e), which appears as nodules of liver parenchyma separated by thick fibrous bands.
Figure 1e.
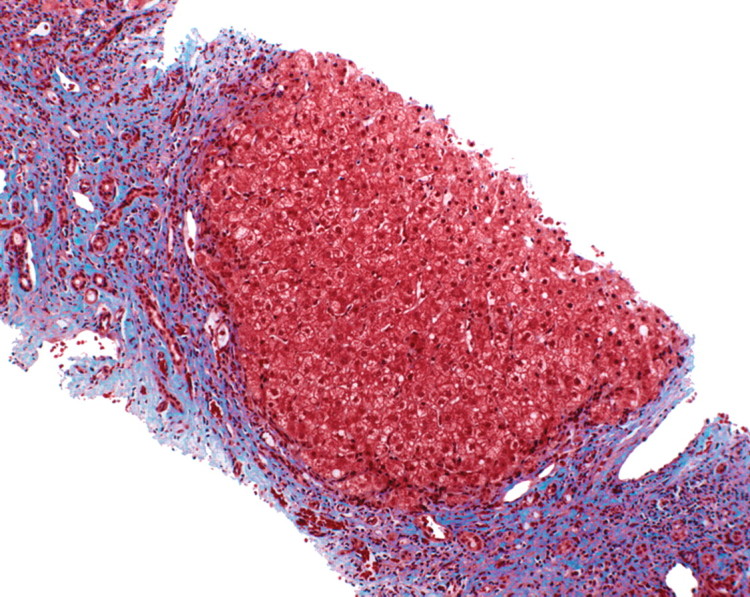
Progression of fibrosis in viral hepatitis. Photomicrographs (original magnification, ×40; trichrome stains) of histologic sections from liver biopsy specimens show the progression of fibrosis in viral hepatitis: normal portal triads with no signs of fibrosis (stage F0) (a), portal fibrous expansion (stage F1) (b), thin fibrous septa emanating from portal triads (stage F2) (c), fibrous septa bridging portal triads and central veins (stage F3) (d), and cirrhosis (stage F4) (e), which appears as nodules of liver parenchyma separated by thick fibrous bands.
In contrast to fibrosis in chronic viral hepatitis, fibrosis in alcoholic hepatitis and in the adult form of nonalcoholic fatty liver disease begins adjacent to the central veins. The fibrosis is laid down in a perisinusoidal manner, resulting in so-called chicken-wire fibrosis, in which the scar tissue surrounds and envelops individual hepatocytes. As the disease advances, perisinusoidal fibrosis accumulates adjacent to portal tracts, and the fibrotic tissue eventually coalesces into fibrous bridges connecting portal triads and central veins, ultimately culminating in cirrhosis (7). As cirrhosis develops, the characteristic histologic features of fatty liver disease may be lost. The perisinusoidal or chicken-wire fibrosis may no longer be apparent, and other features (eg, inflammatory cells, ballooned hepatocytes, and steatosis) may subside. Thus, cirrhosis due to fatty liver disease may be indistinguishable from cirrhosis due to viral hepatitis or other causes.
The presence of fibrotic bridges carving the liver into regenerative nodules is the histologic hallmark of cirrhosis. Regenerative nodules may rarely occur in the absence of significant fibrosis, such as in nodular regenerative hyperplasia, portal vein absence and thrombosis, and regeneration after massive hepatic necrosis. Conversely, there are a few known but rare conditions where extensive fibrosis may be seen in the absence of regenerative nodules. Examples of such conditions are congenital hepatic fibrosis and hepatoportal sclerosis (8).
At histologic analysis, advanced fibrosis contains many vessels and bile ductules; the fibrotic tissue also becomes disorganized and loosely arranged, and its extracellular volume (interstitial and vascular) increases (8). At the same time, Kupffer cell density within the fibrotic tissue diminishes. By comparison, regenerative nodules are highly cellular structures characterized by a relatively small extracellular volume and high Kupffer cell density (8).
Although the progression of fibrosis to cirrhosis is a continuous process, a variety of semiquantitative histopathologic scoring systems have been published that attempt to classify the progression of fibrosis to cirrhosis into discrete stages. The most widely used systems for classifying fibrosis due to viral and autoimmune hepatitis are the METAVIR (9), the Ishak modified Knodell (10), and the Batts and Ludwig (11) systems. Although there are subtle differences between these systems, they share common features and in general divide the spectrum of liver fibrosis due to chronic hepatitis into five stages (Fig 1): no fibrosis (F0), portal fibrous expansion (F1), thin fibrous septa emanating from portal triads (F2), fibrous septa bridging portal triads and central veins (F3), and cirrhosis (F4). Clinically significant fibrosis is generally defined as a stage of F2 or greater.
A staging system for evaluating fibrosis in non-alcoholic fatty liver disease was put forth in 1999 by Brunt and colleagues (12). This system was modified in 2005 by the Nonalcoholic Steatohepatitis Clinical Research Network (13). In this system, fibrosis is categorized into five stages: no fibrosis (F0), zone 3 perisinusoidal fibrosis (F1), zone 3 perisinusoidal fibrosis plus zone 1 periportal fibrosis (F2), bridging fibrosis (F3), and cirrhosis (F4). Investigators subsequently discovered that there are differences in the patterns of fibrosis due to nonalcoholic fatty liver disease in adult and pediatric populations. They found that most cases of pediatric nonalcoholic fatty liver disease show predominantly periportal fibrosis, rather than zone 3 perisinusoidal fibrosis, at disease onset (14).
Cases of cirrhosis may be classified into micronodular, macronodular, and mixed types according to the average size of the parenchymal nodules (Fig 2). Micronodular cirrhosis is arbitrarily defined as nodules less than 0.3 cm in diameter, whereas macronodular cirrhosis is defined as nodules larger than 0.3 cm. In general, causes of uniform and diffuse liver injury, such as alcohol, other hepatotoxic agents, and metabolic disorders such as nonalcoholic steatohepatitis, are associated with micronodular cirrhosis. Macronodular cirrhosis is more often seen in disease processes where hepatocellular regeneration plays a significant role, such as chronic hepatitis (particularly hepatitis B) and autoimmune hepatitis (15). However, in actual practice, this distinction lacks specificity for determining the cause of the cirrhosis and in general is not clinically useful.
Figure 2a.

Mixed micro- and macronodular cirrhosis in an explanted cirrhotic liver from a patient with end-stage primary biliary cirrhosis who underwent liver transplantation for hepatic decompensation. Oblique axial T1-weighted three-dimensional (3D) gradient-echo (a) and T2-weighted two-dimensional (2D) spin-echo (b) ex vivo MR images obtained at 3 T show innumerable regenerative nodules throughout the liver. The nodules are hyperintense on the T1- weighted image and hypointense on the T2-weighted image and range in size from less than 0.3 mm to 2.5 cm (arrow). Histologic analysis of the largest nodules demonstrated that they were benign regenerative nodules.
Figure 2b.

Mixed micro- and macronodular cirrhosis in an explanted cirrhotic liver from a patient with end-stage primary biliary cirrhosis who underwent liver transplantation for hepatic decompensation. Oblique axial T1-weighted three-dimensional (3D) gradient-echo (a) and T2-weighted two-dimensional (2D) spin-echo (b) ex vivo MR images obtained at 3 T show innumerable regenerative nodules throughout the liver. The nodules are hyperintense on the T1- weighted image and hypointense on the T2-weighted image and range in size from less than 0.3 mm to 2.5 cm (arrow). Histologic analysis of the largest nodules demonstrated that they were benign regenerative nodules.
Although liver biopsy is the standard of reference for diagnosis and staging of liver fibrosis, it is an invasive procedure with possible complications such as hemorrhage, hospitalization in 3% of cases, and a fatality rate of 0.03% (16). Furthermore, liver biopsy captures only a tiny fraction of the liver (roughly 1/50,000th), leading to sampling variability (17). In a study that examined paired liver biopsy specimens from the right and left lobes in cases of chronic hepatitis C, a difference of at least one stage was found in 33% of cases (17). Similarly, a study that compared laparoscopic versus histologic diagnosis of cirrhosis found that 32% of cases were underdiagnosed with histologic examination of a single liver biopsy specimen (18).
To attempt to reduce sampling variability, it is recommended that liver biopsy specimens be at least 2.0 cm long and contain at least 11 portal triads. Biopsy specimens that do not meet these criteria are associated with a high risk of under-staging (19). Finally, histologic assessment of fibrosis is an inherently subjective process.
In summary, although liver biopsy is considered the standard of reference, it has limitations—including invasiveness, complications, sampling variability, and subjectivity—that restrict its role as a method for screening and longitudinal assessment of liver fibrosis in the general population. A reproducible and reliable noninvasive method is needed to evaluate disease progression in patients with chronic liver disease, to monitor treatment with conventional drugs and new drugs under development, and for epidemiologic research.
MR Imaging–based Techniques for Noninvasive Assessment of Liver Fibrosis
Recently, diverse MR imaging–based techniques have been used in assessment of liver fibrosis, including conventional contrast material–enhanced MR imaging, double contrast-enhanced MR imaging, MR elastography, diffusion-weighted imaging, MR perfusion imaging, and MR spectroscopy.
Conventional MR Imaging
The cirrhotic liver develops characteristic morphologic alterations such as surface nodularity, widening of fissures, expansion of the gallbladder fossa, notching of the right lobe, atrophy of the right lobe, and relative enlargement of the lateral segments of the left lobe and caudate lobe (20,21). Well visualized with conventional MR imaging as well as US and CT, these morphologic alterations are signs of advanced disease. They have high specificity for cirrhosis but low sensitivity for earlier stages of disease and are not suitable for staging liver fibrosis over its entire spectrum. Extrahepatic findings such as splenomegaly, portosystemic varices, ascites, and bowel wall thickening may be present but are not specific for cirrhosis and may also occur in other conditions (22).
As opposed to the morphologic alterations associated with cirrhosis, fibrosis itself is not well visualized with US, CT, or conventional MR imaging, although it may be visible with advanced MR imaging techniques. In patients with precirrhotic stages of liver fibrosis as well as patients with early cirrhosis, the liver parenchyma usually has a normal MR imaging appearance or may exhibit only subtle, nonspecific heterogeneity (23).
However, in patients with advanced cirrhosis, unenhanced MR imaging may depict fibrotic septa and bridges as low-signal-intensity reticulations on T1-weighted images and high-signal-intensity reticulations on T2-weighted images (Fig 3) (24). These signal intensity characteristics can be explained in part by the large water content of advanced fibrosis, which gives it prolonged T1 and T2 relaxation times (25). The reticulations surround regenerative nodules; these nodules typically have intermediate to high signal intensity on unenhanced T1-weighted images and intermediate to low signal intensity on unenhanced T2-weighted images (Figs 2, 3). Some of these nodules may have high iron content (siderotic nodules) and appear markedly hypointense on T2- or T2*-weighted images. Other nodules may be steatotic (steatotic nodules) and display signal loss on out-of-phase compared with in-phase images (25).
Figure 3a.

Hepatic parenchymal alterations at unenhanced MR imaging in a man with HCV-related cirrhosis. Unenhanced T1-weighted 2D gradient-echo image (repetition time msec/echo time msec = 180/2.3, flip angle = 70°) (a) and T2-weighted respiratory triggered fat-saturated fast spin-echo image (5000/80) (b), obtained at 3 T, show fibrotic septa and bridges as reticulations throughout the liver parenchyma. The reticulations (arrows) are hypointense on the T1-weighted image and hyperintense on the T2-weighted image. Note the innumerable regenerative nodules (arrowheads), which are iso- to hyperintense on the T1-weighted image and iso- to hypointense on the T2-weighted image.
Figure 3b.

Hepatic parenchymal alterations at unenhanced MR imaging in a man with HCV-related cirrhosis. Unenhanced T1-weighted 2D gradient-echo image (repetition time msec/echo time msec = 180/2.3, flip angle = 70°) (a) and T2-weighted respiratory triggered fat-saturated fast spin-echo image (5000/80) (b), obtained at 3 T, show fibrotic septa and bridges as reticulations throughout the liver parenchyma. The reticulations (arrows) are hypointense on the T1-weighted image and hyperintense on the T2-weighted image. Note the innumerable regenerative nodules (arrowheads), which are iso- to hyperintense on the T1-weighted image and iso- to hypointense on the T2-weighted image.
Fibrotic bridges are devoid of iron and fat (Fig 4), even in patients with hepatic iron overload or fat deposition. Therefore, as opposed to regenerative nodules, fibrotic bridges do not appear hypointense to the liver on T2- and T2*-weighted images or show signal loss on out-of-phase compared with in-phase images (25).
Figure 4a.

Fibrotic scars devoid of fat in a patient with end-stage liver disease due to cystic fibrosis. The patient underwent liver transplantation for hepatic decompensation; ex vivo MR imaging of the explanted cirrhotic liver was performed. (a) Fat fraction map shows the percentage of fat according to proton density in each voxel of the image. The map was obtained by generating multiple gradient echoes at serial out-of-phase and in-phase echo times. As described by Bydder et al (26) and Yokoo et al (27), the signal intensity is modeled as a function of echo time. The modeling takes into account the interference effects between water and fat and also between the various fat moieties while correcting for exponential T2* decay. Most of the liver parenchyma has intermediate signal intensity, with pixel values ranging from 5% to 10% fat content. Several fibrotic scars course through the parenchyma and carve the liver into 1–1.5-cm regenerative nodules. The fibrotic scars have low signal intensity (arrows), which indicates that they are devoid of fat. The gallbladder fossa (gbf) and falciform ligament (FL) contain adipose tissue with very high fractional fat content and therefore appear markedly hyperintense. (b) T2 map shows that the fibrotic scars (arrows) have prolonged T2 relaxation. FL = falciform ligament, gbf = gallbladder fossa.
Figure 4b.

Fibrotic scars devoid of fat in a patient with end-stage liver disease due to cystic fibrosis. The patient underwent liver transplantation for hepatic decompensation; ex vivo MR imaging of the explanted cirrhotic liver was performed. (a) Fat fraction map shows the percentage of fat according to proton density in each voxel of the image. The map was obtained by generating multiple gradient echoes at serial out-of-phase and in-phase echo times. As described by Bydder et al (26) and Yokoo et al (27), the signal intensity is modeled as a function of echo time. The modeling takes into account the interference effects between water and fat and also between the various fat moieties while correcting for exponential T2* decay. Most of the liver parenchyma has intermediate signal intensity, with pixel values ranging from 5% to 10% fat content. Several fibrotic scars course through the parenchyma and carve the liver into 1–1.5-cm regenerative nodules. The fibrotic scars have low signal intensity (arrows), which indicates that they are devoid of fat. The gallbladder fossa (gbf) and falciform ligament (FL) contain adipose tissue with very high fractional fat content and therefore appear markedly hyperintense. (b) T2 map shows that the fibrotic scars (arrows) have prolonged T2 relaxation. FL = falciform ligament, gbf = gallbladder fossa.
Administration of contrast agents improves the visibility of fibrosis at MR imaging. Gadolinium-based contrast agents cause T1 shortening and signal enhancement on T1-weighted images. Most gadolinium-based contrast agent formulations freely equilibrate with the extracellular compartment and accumulate in tissues with large extracellular volumes such as liver fibrosis (the main exception is gadoxetate, as discussed later) (28). Thus, most gadolinium-based contrast agents preferentially enhance the signal of liver fibrosis on T1-weighted images. The enhancement is progressive and peaks during the late venous and equilibrium phases at dynamic imaging after intravenous contrast material injection (Fig 5).
Figure 5a.

Dynamic enhancement patterns in fibrous versus neoplastic tissue after administration of a gadolinium-based contrast agent. Axial 3D T1-weighted spoiled gradient-echo images (~4/1.5, flip angle = 15°) of the cirrhotic liver, obtained at 3 T before (a) and 20 seconds (b), 80 seconds (c), and 5 minutes (d) after intravenous injection of a gadolinium-based contrast agent, show fibrotic reticulations in the liver parenchyma. The reticulations enhance progressively after contrast agent administration. Although some of the reticulations are enhanced at the arterial phase, most are not enhanced until the more delayed images (black arrows in c and d). A 2.0 × 1.8-cm exophytic HCC (*) arises from segment 6. A fibrous capsule (white arrow in c and d) surrounds the tumor. The fibrous capsule enhances progressively, with a temporal pattern similar to that of the parenchymal fibrotic reticulations. By comparison, the HCC enhances vividly on the arterial phase image, then washes out to hypointensity relative to the fibrotic reticulations on the venous phase images.
Figure 5b.

Dynamic enhancement patterns in fibrous versus neoplastic tissue after administration of a gadolinium-based contrast agent. Axial 3D T1-weighted spoiled gradient-echo images (~4/1.5, flip angle = 15°) of the cirrhotic liver, obtained at 3 T before (a) and 20 seconds (b), 80 seconds (c), and 5 minutes (d) after intravenous injection of a gadolinium-based contrast agent, show fibrotic reticulations in the liver parenchyma. The reticulations enhance progressively after contrast agent administration. Although some of the reticulations are enhanced at the arterial phase, most are not enhanced until the more delayed images (black arrows in c and d). A 2.0 × 1.8-cm exophytic HCC (*) arises from segment 6. A fibrous capsule (white arrow in c and d) surrounds the tumor. The fibrous capsule enhances progressively, with a temporal pattern similar to that of the parenchymal fibrotic reticulations. By comparison, the HCC enhances vividly on the arterial phase image, then washes out to hypointensity relative to the fibrotic reticulations on the venous phase images.
Figure 5c.

Dynamic enhancement patterns in fibrous versus neoplastic tissue after administration of a gadolinium-based contrast agent. Axial 3D T1-weighted spoiled gradient-echo images (~4/1.5, flip angle = 15°) of the cirrhotic liver, obtained at 3 T before (a) and 20 seconds (b), 80 seconds (c), and 5 minutes (d) after intravenous injection of a gadolinium-based contrast agent, show fibrotic reticulations in the liver parenchyma. The reticulations enhance progressively after contrast agent administration. Although some of the reticulations are enhanced at the arterial phase, most are not enhanced until the more delayed images (black arrows in c and d). A 2.0 × 1.8-cm exophytic HCC (*) arises from segment 6. A fibrous capsule (white arrow in c and d) surrounds the tumor. The fibrous capsule enhances progressively, with a temporal pattern similar to that of the parenchymal fibrotic reticulations. By comparison, the HCC enhances vividly on the arterial phase image, then washes out to hypointensity relative to the fibrotic reticulations on the venous phase images.
Figure 5d.

Dynamic enhancement patterns in fibrous versus neoplastic tissue after administration of a gadolinium-based contrast agent. Axial 3D T1-weighted spoiled gradient-echo images (~4/1.5, flip angle = 15°) of the cirrhotic liver, obtained at 3 T before (a) and 20 seconds (b), 80 seconds (c), and 5 minutes (d) after intravenous injection of a gadolinium-based contrast agent, show fibrotic reticulations in the liver parenchyma. The reticulations enhance progressively after contrast agent administration. Although some of the reticulations are enhanced at the arterial phase, most are not enhanced until the more delayed images (black arrows in c and d). A 2.0 × 1.8-cm exophytic HCC (*) arises from segment 6. A fibrous capsule (white arrow in c and d) surrounds the tumor. The fibrous capsule enhances progressively, with a temporal pattern similar to that of the parenchymal fibrotic reticulations. By comparison, the HCC enhances vividly on the arterial phase image, then washes out to hypointensity relative to the fibrotic reticulations on the venous phase images.
The fibrosis is usually not well visualized during the arterial and early venous phases, although occasionally there may be arterial hypervascularity within a focal area of fibrosis. Such areas of arterial hypervascularity may mimic an HCC or other neoplastic nodule and cause diagnostic confusion. Findings that favor focal fibrosis over a nodule include wedge-shaped configuration and persistence of enhancement into the late venous phases (25).
In addition to fibrosis, gadolinium-based contrast agents may enhance other nonneoplastic lesions associated with chronic liver disease, including arterioportal shunts. These shunts may have a vaguely nodular configuration; however, unlike true nodules, they are usually ill-defined, surround rather than displace vessels, are visible only during the arterial phase, and fade to isointensity in the late venous phases. Occasionally, gadolinium-based contrast agent administration may highlight areas of active inflammation as patchy hyperenhancement at arterial phase imaging, but patchy arterial enhancement is not a sensitive or reliable marker of inflammation and can be observed in patients without liver disease (25).
Superparamagnetic iron oxide (SPIO) is a reticuloendothelial system–specific contrast agent. After intravenous infusion, iron oxide particles are cleared from the blood through phagocytosis and accumulate in the cells of the reticuloendothelial system of the liver, spleen, and bone marrow, with approximately 80% taken up by the liver (29). The superparamagnetic properties of the iron core cause local magnetic field inhomogeneities around the particles, resulting in pronounced T2* shortening and signal loss on MR images. Signal loss is greatest with gradient-recalled echoes because these are highly sensitive to T2*-shortening effects, although signal loss can also be observed on T2-weighted spin-echo images. Consequently, on SPIO-enhanced MR images, the liver parenchyma has low signal intensity. Conversely, the areas of fibrosis within the liver, which have reduced Kupffer cell density, accumulate less iron oxide and appear as high-signal-intensity reticulations (30) (Fig 6).
Figure 6a.

Increased conspicuity of liver fibrosis after SPIO administration in a patient with liver cirrhosis and HCC (same patient as in Fig 5). Axial 2D T2*-weighted gradient-echo images (200/8, flip angle = 35°) of the cirrhotic liver, obtained at 3 T before (a) and after (b) a 30-minute infusion of SPIO, show that fibrotic reticulations are not well demonstrated on the unenhanced image. After injection, SPIO particles accumulate in the liver owing to uptake by Kupffer cells and cause the liver to darken. Fibrotic reticulations have diminished Kupffer cell density, do not accumulate iron oxides, and hence appear relatively hyperintense (arrows in b). Note the 2.0 × 1.8-cm exophytic HCC (*) arising from segment 6. Similarly to the fibrotic reticulations, the carcinoma has low Kupffer cell density and appears relatively hyperintense on the SPIO-enhanced image.
Figure 6b.

Increased conspicuity of liver fibrosis after SPIO administration in a patient with liver cirrhosis and HCC (same patient as in Fig 5). Axial 2D T2*-weighted gradient-echo images (200/8, flip angle = 35°) of the cirrhotic liver, obtained at 3 T before (a) and after (b) a 30-minute infusion of SPIO, show that fibrotic reticulations are not well demonstrated on the unenhanced image. After injection, SPIO particles accumulate in the liver owing to uptake by Kupffer cells and cause the liver to darken. Fibrotic reticulations have diminished Kupffer cell density, do not accumulate iron oxides, and hence appear relatively hyperintense (arrows in b). Note the 2.0 × 1.8-cm exophytic HCC (*) arising from segment 6. Similarly to the fibrotic reticulations, the carcinoma has low Kupffer cell density and appears relatively hyperintense on the SPIO-enhanced image.
The term confluent fibrosis refers to broad fibrotic scars up to several centimeters thick with a masslike appearance at radiology. Confluent fibrosis has similar signal intensity and enhancement features as fibrotic septa and bridges but is easier to visualize because of its size. For unclear reasons, confluent fibrosis is more common in patients with alcohol-related cirrhosis than in those with viral liver disease. Although the fibrosis may resemble a neoplasm, its characteristic morphology permits the correct diagnosis. Unlike neoplasms, confluent fibrosis typically has a wedgelike or geographic shape with straight or concave borders, radiates from the portal hilum to contact the liver surface, retracts the overlying hepatic capsule (Fig 7), and is associated with progressive volume loss if follow-up studies are performed (30).
Figure 7a.

Dynamic enhancement patterns of confluent fibrosis versus active inflammation after administration of a gadolinium-based contrast agent in a woman with biliary cirrhosis complicated by acute cholangitis. The biliary cirrhosis was due to a long-standing benign stricture of the common bile duct. Axial 3D T1-weighted gradient-echo images (~4/1.5, flip angle = 15°), obtained at 3 T before (a) and 20 seconds (b), 80 seconds (c), and 5 minutes (d) after intravenous injection of a gadolinium-based contrast agent, show a liver with lobulated contours. The right lobe is atrophic, and the left lobe is large. At the junction of the left and right lobes, a wedge-shaped area of confluent fibrosis (black arrows) radiates from the portal hilum, contacts and retracts the liver capsule (white arrow), and causes focal volume loss. The confluent fibrosis is hypointense on the unenhanced image and enhances progressively after contrast agent administration. Similarly, thickened fibrotic walls of intrahepatic biliary radicles enhance progressively (arrowheads in c and d). By comparison, patchy areas of liver parenchyma are hyperenhanced on the arterial phase image, then fade to isointensity relative to background liver tissue. These patchy areas of arterial hypervascularity probably reflect hyperemia due to active inflammation and, in the setting of chronic biliary obstruction, suggest acute cholangitis.
Figure 7b.

Dynamic enhancement patterns of confluent fibrosis versus active inflammation after administration of a gadolinium-based contrast agent in a woman with biliary cirrhosis complicated by acute cholangitis. The biliary cirrhosis was due to a long-standing benign stricture of the common bile duct. Axial 3D T1-weighted gradient-echo images (~4/1.5, flip angle = 15°), obtained at 3 T before (a) and 20 seconds (b), 80 seconds (c), and 5 minutes (d) after intravenous injection of a gadolinium-based contrast agent, show a liver with lobulated contours. The right lobe is atrophic, and the left lobe is large. At the junction of the left and right lobes, a wedge-shaped area of confluent fibrosis (black arrows) radiates from the portal hilum, contacts and retracts the liver capsule (white arrow), and causes focal volume loss. The confluent fibrosis is hypointense on the unenhanced image and enhances progressively after contrast agent administration. Similarly, thickened fibrotic walls of intrahepatic biliary radicles enhance progressively (arrowheads in c and d). By comparison, patchy areas of liver parenchyma are hyperenhanced on the arterial phase image, then fade to isointensity relative to background liver tissue. These patchy areas of arterial hypervascularity probably reflect hyperemia due to active inflammation and, in the setting of chronic biliary obstruction, suggest acute cholangitis.
Figure 7c.

Dynamic enhancement patterns of confluent fibrosis versus active inflammation after administration of a gadolinium-based contrast agent in a woman with biliary cirrhosis complicated by acute cholangitis. The biliary cirrhosis was due to a long-standing benign stricture of the common bile duct. Axial 3D T1-weighted gradient-echo images (~4/1.5, flip angle = 15°), obtained at 3 T before (a) and 20 seconds (b), 80 seconds (c), and 5 minutes (d) after intravenous injection of a gadolinium-based contrast agent, show a liver with lobulated contours. The right lobe is atrophic, and the left lobe is large. At the junction of the left and right lobes, a wedge-shaped area of confluent fibrosis (black arrows) radiates from the portal hilum, contacts and retracts the liver capsule (white arrow), and causes focal volume loss. The confluent fibrosis is hypointense on the unenhanced image and enhances progressively after contrast agent administration. Similarly, thickened fibrotic walls of intrahepatic biliary radicles enhance progressively (arrowheads in c and d). By comparison, patchy areas of liver parenchyma are hyperenhanced on the arterial phase image, then fade to isointensity relative to background liver tissue. These patchy areas of arterial hypervascularity probably reflect hyperemia due to active inflammation and, in the setting of chronic biliary obstruction, suggest acute cholangitis.
Figure 7d.

Dynamic enhancement patterns of confluent fibrosis versus active inflammation after administration of a gadolinium-based contrast agent in a woman with biliary cirrhosis complicated by acute cholangitis. The biliary cirrhosis was due to a long-standing benign stricture of the common bile duct. Axial 3D T1-weighted gradient-echo images (~4/1.5, flip angle = 15°), obtained at 3 T before (a) and 20 seconds (b), 80 seconds (c), and 5 minutes (d) after intravenous injection of a gadolinium-based contrast agent, show a liver with lobulated contours. The right lobe is atrophic, and the left lobe is large. At the junction of the left and right lobes, a wedge-shaped area of confluent fibrosis (black arrows) radiates from the portal hilum, contacts and retracts the liver capsule (white arrow), and causes focal volume loss. The confluent fibrosis is hypointense on the unenhanced image and enhances progressively after contrast agent administration. Similarly, thickened fibrotic walls of intrahepatic biliary radicles enhance progressively (arrowheads in c and d). By comparison, patchy areas of liver parenchyma are hyperenhanced on the arterial phase image, then fade to isointensity relative to background liver tissue. These patchy areas of arterial hypervascularity probably reflect hyperemia due to active inflammation and, in the setting of chronic biliary obstruction, suggest acute cholangitis.
Arterial phase hyperenhancement after intravenous administration of extracellular contrast agents is uncommon but may occur. In such cases, the characteristic morphology of the confluent fibrosis as well as the persistence of enhancement into the late phases permit differentiation from HCC (Figs 8, 9); in difficult cases, short-term follow-up imaging may be helpful. As opposed to the persistent enhancement pattern with extracellular gadolinium-based contrast agents, confluent fibrosis seems to wash out with gadoxetate and appears as an area of low signal intensity on delayed images (Fig 10). In patients with confluent fibrosis and fatty liver, the confluent fibrosis is devoid of fat.
Figure 8a.

Atypical enhancement pattern of confluent fibrosis after administration of a gadolinium-based contrast agent in a man with HCV- and alcohol-related cirrhosis. Axial 3D T1-weighted gradient-echo images (~4/1.5, flip angle = 15°) (a–c) and 2D T1- and T2*-weighted gradient-echo image (180/6, flip angle = 70°) (d), obtained at 3 T after intravenous infusion of SPIO and before (a) and 20 seconds (b), 80 seconds (c), and 4 minutes (d) after intravenous injection of a gadolinium-based contrast agent, show a wedge-shaped area of confluent fibrosis (straight arrows) in segment 5 of the liver. The confluent fibrosis radiates from the portal hilum, contacts and retracts the liver capsule, and causes focal volume loss. The fibrosis is hypointense before contrast agent administration but hyperenhances heterogeneously in the arterial phase. The enhancement persists and becomes more homogeneous in the venous phases. Arterial hyperenhancement is atypical of confluent fibrosis, and the differential diagnosis includes HCC. However, the persistent enhancement, homogeneity in the late venous phase, and characteristic morphologic features favor the diagnosis of confluent fibrosis. Note the fine fibrotic reticulations surrounding hypointense regenerative nodules on the late venous phase image. The reticulations are most pronounced in the atrophic right and left lobes, with relative sparing in the hypertrophic caudate lobe (C in c and d). Also note the subcapsular fibrosis (arrowhead in d) and the long fibrous scar at the caudate lobe–segment 6 junction (curved arrow in d).
Figure 8b.

Atypical enhancement pattern of confluent fibrosis after administration of a gadolinium-based contrast agent in a man with HCV- and alcohol-related cirrhosis. Axial 3D T1-weighted gradient-echo images (~4/1.5, flip angle = 15°) (a–c) and 2D T1- and T2*-weighted gradient-echo image (180/6, flip angle = 70°) (d), obtained at 3 T after intravenous infusion of SPIO and before (a) and 20 seconds (b), 80 seconds (c), and 4 minutes (d) after intravenous injection of a gadolinium-based contrast agent, show a wedge-shaped area of confluent fibrosis (straight arrows) in segment 5 of the liver. The confluent fibrosis radiates from the portal hilum, contacts and retracts the liver capsule, and causes focal volume loss. The fibrosis is hypointense before contrast agent administration but hyperenhances heterogeneously in the arterial phase. The enhancement persists and becomes more homogeneous in the venous phases. Arterial hyperenhancement is atypical of confluent fibrosis, and the differential diagnosis includes HCC. However, the persistent enhancement, homogeneity in the late venous phase, and characteristic morphologic features favor the diagnosis of confluent fibrosis. Note the fine fibrotic reticulations surrounding hypointense regenerative nodules on the late venous phase image. The reticulations are most pronounced in the atrophic right and left lobes, with relative sparing in the hypertrophic caudate lobe (C in c and d). Also note the subcapsular fibrosis (arrowhead in d) and the long fibrous scar at the caudate lobe–segment 6 junction (curved arrow in d).
Figure 8c.

Atypical enhancement pattern of confluent fibrosis after administration of a gadolinium-based contrast agent in a man with HCV- and alcohol-related cirrhosis. Axial 3D T1-weighted gradient-echo images (~4/1.5, flip angle = 15°) (a–c) and 2D T1- and T2*-weighted gradient-echo image (180/6, flip angle = 70°) (d), obtained at 3 T after intravenous infusion of SPIO and before (a) and 20 seconds (b), 80 seconds (c), and 4 minutes (d) after intravenous injection of a gadolinium-based contrast agent, show a wedge-shaped area of confluent fibrosis (straight arrows) in segment 5 of the liver. The confluent fibrosis radiates from the portal hilum, contacts and retracts the liver capsule, and causes focal volume loss. The fibrosis is hypointense before contrast agent administration but hyperenhances heterogeneously in the arterial phase. The enhancement persists and becomes more homogeneous in the venous phases. Arterial hyperenhancement is atypical of confluent fibrosis, and the differential diagnosis includes HCC. However, the persistent enhancement, homogeneity in the late venous phase, and characteristic morphologic features favor the diagnosis of confluent fibrosis. Note the fine fibrotic reticulations surrounding hypointense regenerative nodules on the late venous phase image. The reticulations are most pronounced in the atrophic right and left lobes, with relative sparing in the hypertrophic caudate lobe (C in c and d). Also note the subcapsular fibrosis (arrowhead in d) and the long fibrous scar at the caudate lobe–segment 6 junction (curved arrow in d).
Figure 8d.

Atypical enhancement pattern of confluent fibrosis after administration of a gadolinium-based contrast agent in a man with HCV- and alcohol-related cirrhosis. Axial 3D T1-weighted gradient-echo images (~4/1.5, flip angle = 15°) (a–c) and 2D T1- and T2*-weighted gradient-echo image (180/6, flip angle = 70°) (d), obtained at 3 T after intravenous infusion of SPIO and before (a) and 20 seconds (b), 80 seconds (c), and 4 minutes (d) after intravenous injection of a gadolinium-based contrast agent, show a wedge-shaped area of confluent fibrosis (straight arrows) in segment 5 of the liver. The confluent fibrosis radiates from the portal hilum, contacts and retracts the liver capsule, and causes focal volume loss. The fibrosis is hypointense before contrast agent administration but hyperenhances heterogeneously in the arterial phase. The enhancement persists and becomes more homogeneous in the venous phases. Arterial hyperenhancement is atypical of confluent fibrosis, and the differential diagnosis includes HCC. However, the persistent enhancement, homogeneity in the late venous phase, and characteristic morphologic features favor the diagnosis of confluent fibrosis. Note the fine fibrotic reticulations surrounding hypointense regenerative nodules on the late venous phase image. The reticulations are most pronounced in the atrophic right and left lobes, with relative sparing in the hypertrophic caudate lobe (C in c and d). Also note the subcapsular fibrosis (arrowhead in d) and the long fibrous scar at the caudate lobe–segment 6 junction (curved arrow in d).
Figure 9a.

Infiltrative HCC as a differential diagnosis for confluent fibrosis in a man with HCV-related cirrhosis. Axial 3D T1-weighted gradient-echo images (~4/1.5, flip angle = 15°) (a–c) and 2D T1- and T2*-weighted gradient-echo image (180/6, flip angle = 70°) (d), obtained at 3 T after intravenous infusion of SPIO and before (a) and 20 seconds (b), 80 seconds (c), and 4 minutes (d) after intravenous injection of a gadolinium-based contrast agent, show a wedge-shaped conglomerate mass in the liver. The mass involves the entire right lobe, bulges the capsule, and expands the liver volume; it enhances heterogeneously on the arterial phase image (arrowheads in b). The dissipation of the contrast agent is nonuniform, causing the mass to have heterogeneous signal intensity in the late venous phase. The mass invades the right hepatic vein (white arrow in c) and a portal vein branch (black arrow in c). Although the wedge shape of the mass suggests a benign process, the volume expansion, nonuniform dissipation of contrast material, and delayed phase heterogeneity favor the diagnosis of carcinoma. Vascular invasion by the tumor, which was an HCC, clinches the diagnosis of malignancy.
Figure 9b.

Infiltrative HCC as a differential diagnosis for confluent fibrosis in a man with HCV-related cirrhosis. Axial 3D T1-weighted gradient-echo images (~4/1.5, flip angle = 15°) (a–c) and 2D T1- and T2*-weighted gradient-echo image (180/6, flip angle = 70°) (d), obtained at 3 T after intravenous infusion of SPIO and before (a) and 20 seconds (b), 80 seconds (c), and 4 minutes (d) after intravenous injection of a gadolinium-based contrast agent, show a wedge-shaped conglomerate mass in the liver. The mass involves the entire right lobe, bulges the capsule, and expands the liver volume; it enhances heterogeneously on the arterial phase image (arrowheads in b). The dissipation of the contrast agent is nonuniform, causing the mass to have heterogeneous signal intensity in the late venous phase. The mass invades the right hepatic vein (white arrow in c) and a portal vein branch (black arrow in c). Although the wedge shape of the mass suggests a benign process, the volume expansion, nonuniform dissipation of contrast material, and delayed phase heterogeneity favor the diagnosis of carcinoma. Vascular invasion by the tumor, which was an HCC, clinches the diagnosis of malignancy.
Figure 9c.

Infiltrative HCC as a differential diagnosis for confluent fibrosis in a man with HCV-related cirrhosis. Axial 3D T1-weighted gradient-echo images (~4/1.5, flip angle = 15°) (a–c) and 2D T1- and T2*-weighted gradient-echo image (180/6, flip angle = 70°) (d), obtained at 3 T after intravenous infusion of SPIO and before (a) and 20 seconds (b), 80 seconds (c), and 4 minutes (d) after intravenous injection of a gadolinium-based contrast agent, show a wedge-shaped conglomerate mass in the liver. The mass involves the entire right lobe, bulges the capsule, and expands the liver volume; it enhances heterogeneously on the arterial phase image (arrowheads in b). The dissipation of the contrast agent is nonuniform, causing the mass to have heterogeneous signal intensity in the late venous phase. The mass invades the right hepatic vein (white arrow in c) and a portal vein branch (black arrow in c). Although the wedge shape of the mass suggests a benign process, the volume expansion, nonuniform dissipation of contrast material, and delayed phase heterogeneity favor the diagnosis of carcinoma. Vascular invasion by the tumor, which was an HCC, clinches the diagnosis of malignancy.
Figure 9d.

Infiltrative HCC as a differential diagnosis for confluent fibrosis in a man with HCV-related cirrhosis. Axial 3D T1-weighted gradient-echo images (~4/1.5, flip angle = 15°) (a–c) and 2D T1- and T2*-weighted gradient-echo image (180/6, flip angle = 70°) (d), obtained at 3 T after intravenous infusion of SPIO and before (a) and 20 seconds (b), 80 seconds (c), and 4 minutes (d) after intravenous injection of a gadolinium-based contrast agent, show a wedge-shaped conglomerate mass in the liver. The mass involves the entire right lobe, bulges the capsule, and expands the liver volume; it enhances heterogeneously on the arterial phase image (arrowheads in b). The dissipation of the contrast agent is nonuniform, causing the mass to have heterogeneous signal intensity in the late venous phase. The mass invades the right hepatic vein (white arrow in c) and a portal vein branch (black arrow in c). Although the wedge shape of the mass suggests a benign process, the volume expansion, nonuniform dissipation of contrast material, and delayed phase heterogeneity favor the diagnosis of carcinoma. Vascular invasion by the tumor, which was an HCC, clinches the diagnosis of malignancy.
Figure 10a.

Dynamic enhancement patterns of fibrous versus neoplastic tissue after administration of a hepatobiliary gadolinium-based contrast agent. Axial 3D T1-weighted gradient-echo images (~4/1.5, flip angle = 15°), obtained at 3 T 20 seconds (a), 5 minutes (b), and 30 minutes (c) after intravenous injection of the hepatobiliary gadolinium-based contrast agent gadoxetate disodium, show a cirrhotic liver. Fibrotic scars are not well demonstrated in the arterial or late venous phase but are clearly visible as a meshwork of hypointense reticulations on the hepatocellular phase image (arrows in c). By comparison, a 4.2 × 4.1-cm HCC (*) in segment 6 enhances vividly in the arterial phase, washes out to hypointensity relative to the liver in the late venous phase, and remains hypointense to the liver in the hepatocellular phase. The tumor is surrounded by a fibrous capsule (arrow in a and b) and contains internal septa. Note the biliary excretion of contrast material on the 30-minute image.
Figure 10b.

Dynamic enhancement patterns of fibrous versus neoplastic tissue after administration of a hepatobiliary gadolinium-based contrast agent. Axial 3D T1-weighted gradient-echo images (~4/1.5, flip angle = 15°), obtained at 3 T 20 seconds (a), 5 minutes (b), and 30 minutes (c) after intravenous injection of the hepatobiliary gadolinium-based contrast agent gadoxetate disodium, show a cirrhotic liver. Fibrotic scars are not well demonstrated in the arterial or late venous phase but are clearly visible as a meshwork of hypointense reticulations on the hepatocellular phase image (arrows in c). By comparison, a 4.2 × 4.1-cm HCC (*) in segment 6 enhances vividly in the arterial phase, washes out to hypointensity relative to the liver in the late venous phase, and remains hypointense to the liver in the hepatocellular phase. The tumor is surrounded by a fibrous capsule (arrow in a and b) and contains internal septa. Note the biliary excretion of contrast material on the 30-minute image.
Figure 10c.

Dynamic enhancement patterns of fibrous versus neoplastic tissue after administration of a hepatobiliary gadolinium-based contrast agent. Axial 3D T1-weighted gradient-echo images (~4/1.5, flip angle = 15°), obtained at 3 T 20 seconds (a), 5 minutes (b), and 30 minutes (c) after intravenous injection of the hepatobiliary gadolinium-based contrast agent gadoxetate disodium, show a cirrhotic liver. Fibrotic scars are not well demonstrated in the arterial or late venous phase but are clearly visible as a meshwork of hypointense reticulations on the hepatocellular phase image (arrows in c). By comparison, a 4.2 × 4.1-cm HCC (*) in segment 6 enhances vividly in the arterial phase, washes out to hypointensity relative to the liver in the late venous phase, and remains hypointense to the liver in the hepatocellular phase. The tumor is surrounded by a fibrous capsule (arrow in a and b) and contains internal septa. Note the biliary excretion of contrast material on the 30-minute image.
Double Contrast-enhanced MR Imaging
Double contrast-enhanced MR imaging is an investigational technique that involves MR imaging after sequential intravenous administration of SPIO and a gadolinium-based contrast agent (31). As described earlier, SPIO and extracellular gadolinium-based contrast agents enhance the visibility of advanced fibrosis with different mechanisms: SPIO reduces the signal of the background liver tissue, whereas gadolinium-based contrast agents directly enhance the signal of the water component within fibrotic tissue. Individually, the two agents are of limited efficacy. In combination, they are synergistic and demonstrate advanced fibrosis with higher clarity than can be achieved with either agent alone (Fig 11).
Figure 11a.

Synergy of SPIO and a gadolinium-based contrast agent for direct visualization of advanced fibrosis in a man with HCV-related cirrhosis. Axial unenhanced (a), gadolinium-enhanced (b), SPIO-enhanced (c), and double contrast-enhanced (SPIO plus gadolinium) (d) 2D T1-weighted (repetition time = 150 msec, flip angle = 70°) and T2*-weighted (echo time = 6 msec) gradient-echo images, obtained at 3 T within a 1-week period, show a cirrhotic liver with innumerable hyperintense reticulations surrounding hypointense regenerative nodules. Parenchymal alterations are poorly demonstrated on the unenhanced image. Gadolinium-based contrast agent accumulates in extracellular spaces within fibrotic tissue and enhances the signal of fibrotic reticulations. Iron oxides selectively accumulate within Kupffer cells and darken the background parenchyma. In combination, SPIO and a gadolinium-based contrast agent are synergistic and depict fibrotic reticulations (arrows in d) and regenerative nodules (arrowheads in d) with high clarity on the double contrast-enhanced image.
Figure 11b.

Synergy of SPIO and a gadolinium-based contrast agent for direct visualization of advanced fibrosis in a man with HCV-related cirrhosis. Axial unenhanced (a), gadolinium-enhanced (b), SPIO-enhanced (c), and double contrast-enhanced (SPIO plus gadolinium) (d) 2D T1-weighted (repetition time = 150 msec, flip angle = 70°) and T2*-weighted (echo time = 6 msec) gradient-echo images, obtained at 3 T within a 1-week period, show a cirrhotic liver with innumerable hyperintense reticulations surrounding hypointense regenerative nodules. Parenchymal alterations are poorly demonstrated on the unenhanced image. Gadolinium-based contrast agent accumulates in extracellular spaces within fibrotic tissue and enhances the signal of fibrotic reticulations. Iron oxides selectively accumulate within Kupffer cells and darken the background parenchyma. In combination, SPIO and a gadolinium-based contrast agent are synergistic and depict fibrotic reticulations (arrows in d) and regenerative nodules (arrowheads in d) with high clarity on the double contrast-enhanced image.
Figure 11c.

Synergy of SPIO and a gadolinium-based contrast agent for direct visualization of advanced fibrosis in a man with HCV-related cirrhosis. Axial unenhanced (a), gadolinium-enhanced (b), SPIO-enhanced (c), and double contrast-enhanced (SPIO plus gadolinium) (d) 2D T1-weighted (repetition time = 150 msec, flip angle = 70°) and T2*-weighted (echo time = 6 msec) gradient-echo images, obtained at 3 T within a 1-week period, show a cirrhotic liver with innumerable hyperintense reticulations surrounding hypointense regenerative nodules. Parenchymal alterations are poorly demonstrated on the unenhanced image. Gadolinium-based contrast agent accumulates in extracellular spaces within fibrotic tissue and enhances the signal of fibrotic reticulations. Iron oxides selectively accumulate within Kupffer cells and darken the background parenchyma. In combination, SPIO and a gadolinium-based contrast agent are synergistic and depict fibrotic reticulations (arrows in d) and regenerative nodules (arrowheads in d) with high clarity on the double contrast-enhanced image.
Figure 11d.

Synergy of SPIO and a gadolinium-based contrast agent for direct visualization of advanced fibrosis in a man with HCV-related cirrhosis. Axial unenhanced (a), gadolinium-enhanced (b), SPIO-enhanced (c), and double contrast-enhanced (SPIO plus gadolinium) (d) 2D T1-weighted (repetition time = 150 msec, flip angle = 70°) and T2*-weighted (echo time = 6 msec) gradient-echo images, obtained at 3 T within a 1-week period, show a cirrhotic liver with innumerable hyperintense reticulations surrounding hypointense regenerative nodules. Parenchymal alterations are poorly demonstrated on the unenhanced image. Gadolinium-based contrast agent accumulates in extracellular spaces within fibrotic tissue and enhances the signal of fibrotic reticulations. Iron oxides selectively accumulate within Kupffer cells and darken the background parenchyma. In combination, SPIO and a gadolinium-based contrast agent are synergistic and depict fibrotic reticulations (arrows in d) and regenerative nodules (arrowheads in d) with high clarity on the double contrast-enhanced image.
Originally intended for HCC imaging, the double contrast-enhanced technique can be exploited for fibrosis visualization (Fig 11). The technique involves infusion of SPIO particles over about 30 minutes, followed by bolus intravenous injection of a gadolinium-based contrast agent. The SPIO particles accumulate in hepatic Kupffer cells, causing signal loss in liver parenchyma on T2*-weighted images. The subsequent intravenous injection of a gadolinium-based contrast agent causes delayed enhancement of hepatic septal and bridging fibrosis; the result is high image contrast between the low-signal-intensity liver parenchyma and high-signal-intensity fibrotic reticulations (32).
To maximize the visibility of liver fibrosis, high-resolution 2D gradient-echo images should be obtained about 3–10 minutes after administration of a gadolinium-based contrast agent. Imaging parameters should be chosen to achieve both T1 weighting (to increase sensitivity to the signal augmentation mediated by gadolinium-based contrast agent within fibrotic tissue) and T2* weighting (to increase sensitivity to the signal loss mediated by SPIO within background liver). Chemical fat saturation should be applied to suppress signals from adipose tissue outside the liver and improve the dynamic range of the image (33).
Aguirre et al (34) demonstrated that advanced hepatic fibrosis can be detected and differentiated from absent or mild fibrosis with an accuracy of 93% by using double contrast-enhanced MR imaging. The authors observed abnormal hepatic texture characterized by the presence of reticulations and nodularity in the cirrhotic liver and postulated that hepatic fibrosis may be staged on the basis of the severity of the texture abnormalities (Fig 12). Clinical trials are currently under way to prospectively assess fibrosis staging with this technique.
Figure 12a.

Double contrast-enhanced MR imaging appearance of different stages of HCV-related liver fibrosis. Axial double contrast-enhanced (SPIO plus gadolinium) gradient-echo images (180/6, flip angle = 70°), obtained at 3 T in four HCV-infected patients with histologically confirmed stage F1 (a), F2 (b), F3 (c), and F4 (d) liver fibro-sis, show hyperintense reticulations in the liver. With increasing stage of fibrosis, there is a corresponding increase in the density and thickness of the reticulations and their signal intensity relative to that of the liver.
Figure 12b.

Double contrast-enhanced MR imaging appearance of different stages of HCV-related liver fibrosis. Axial double contrast-enhanced (SPIO plus gadolinium) gradient-echo images (180/6, flip angle = 70°), obtained at 3 T in four HCV-infected patients with histologically confirmed stage F1 (a), F2 (b), F3 (c), and F4 (d) liver fibro-sis, show hyperintense reticulations in the liver. With increasing stage of fibrosis, there is a corresponding increase in the density and thickness of the reticulations and their signal intensity relative to that of the liver.
Figure 12c.

Double contrast-enhanced MR imaging appearance of different stages of HCV-related liver fibrosis. Axial double contrast-enhanced (SPIO plus gadolinium) gradient-echo images (180/6, flip angle = 70°), obtained at 3 T in four HCV-infected patients with histologically confirmed stage F1 (a), F2 (b), F3 (c), and F4 (d) liver fibro-sis, show hyperintense reticulations in the liver. With increasing stage of fibrosis, there is a corresponding increase in the density and thickness of the reticulations and their signal intensity relative to that of the liver.
Figure 12d.

Double contrast-enhanced MR imaging appearance of different stages of HCV-related liver fibrosis. Axial double contrast-enhanced (SPIO plus gadolinium) gradient-echo images (180/6, flip angle = 70°), obtained at 3 T in four HCV-infected patients with histologically confirmed stage F1 (a), F2 (b), F3 (c), and F4 (d) liver fibro-sis, show hyperintense reticulations in the liver. With increasing stage of fibrosis, there is a corresponding increase in the density and thickness of the reticulations and their signal intensity relative to that of the liver.
An advantage of double contrast-enhanced MR imaging is that it works on routine imaging units and does not require specialized equipment. Texture abnormalities may be assessed qualitatively or else quantitatively by using computer-based texture analysis techniques. In addition, double contrast-enhanced MR imaging permits visualization of parenchymal features of cirrhosis that are not visible with other techniques (Figs 13, 14) and is useful for longitudinal monitoring of patients.
Figure 13a.

Double contrast-enhanced MR imaging appearance of cirrhosis due to chronic HCV infection. Axial double contrast-enhanced (SPIO plus gadolinium) 2D gradient-echo images of the liver, obtained at 1.5 T (100/6, flip angle = 70°) (a) and 3 T (150/6, flip angle = 70°) (b) in two patients with HCV-related cirrhosis, show a diffuse meshwork of hyperintense fibrotic reticulations surrounding variable-sized, predominantly hypointense regenerative nodules (arrowheads). There is no normal parenchyma. Note the small, mildly hyperintense HCCs in each patient (arrows).
Figure 13b.

Double contrast-enhanced MR imaging appearance of cirrhosis due to chronic HCV infection. Axial double contrast-enhanced (SPIO plus gadolinium) 2D gradient-echo images of the liver, obtained at 1.5 T (100/6, flip angle = 70°) (a) and 3 T (150/6, flip angle = 70°) (b) in two patients with HCV-related cirrhosis, show a diffuse meshwork of hyperintense fibrotic reticulations surrounding variable-sized, predominantly hypointense regenerative nodules (arrowheads). There is no normal parenchyma. Note the small, mildly hyperintense HCCs in each patient (arrows).
Figure 14a.

Double contrast-enhanced MR imaging appearance of confluent fibrosis with perivascular sparing in a man with alcohol-induced cirrhosis. Axial double contrast-enhanced (SPIO plus gadolinium) 2D gradient-echo images (140/6, flip angle = 70°), obtained at 1.5 T and displayed from superior (a) to inferior (d), show several areas of hyperintense confluent fibrosis (black arrows) in the liver. There are halos of low signal intensity surrounding many vessels (straight white arrow in a–c), a finding suggestive of perivascular sparing. Note the pseudotumoral hypertrophy of portions of the right and left lobes (curved arrows in c and d).
Figure 14b.

Double contrast-enhanced MR imaging appearance of confluent fibrosis with perivascular sparing in a man with alcohol-induced cirrhosis. Axial double contrast-enhanced (SPIO plus gadolinium) 2D gradient-echo images (140/6, flip angle = 70°), obtained at 1.5 T and displayed from superior (a) to inferior (d), show several areas of hyperintense confluent fibrosis (black arrows) in the liver. There are halos of low signal intensity surrounding many vessels (straight white arrow in a–c), a finding suggestive of perivascular sparing. Note the pseudotumoral hypertrophy of portions of the right and left lobes (curved arrows in c and d).
Figure 14c.

Double contrast-enhanced MR imaging appearance of confluent fibrosis with perivascular sparing in a man with alcohol-induced cirrhosis. Axial double contrast-enhanced (SPIO plus gadolinium) 2D gradient-echo images (140/6, flip angle = 70°), obtained at 1.5 T and displayed from superior (a) to inferior (d), show several areas of hyperintense confluent fibrosis (black arrows) in the liver. There are halos of low signal intensity surrounding many vessels (straight white arrow in a–c), a finding suggestive of perivascular sparing. Note the pseudotumoral hypertrophy of portions of the right and left lobes (curved arrows in c and d).
Figure 14d.

Double contrast-enhanced MR imaging appearance of confluent fibrosis with perivascular sparing in a man with alcohol-induced cirrhosis. Axial double contrast-enhanced (SPIO plus gadolinium) 2D gradient-echo images (140/6, flip angle = 70°), obtained at 1.5 T and displayed from superior (a) to inferior (d), show several areas of hyperintense confluent fibrosis (black arrows) in the liver. There are halos of low signal intensity surrounding many vessels (straight white arrow in a–c), a finding suggestive of perivascular sparing. Note the pseudotumoral hypertrophy of portions of the right and left lobes (curved arrows in c and d).
The main limitations of double contrast-enhanced MR imaging are the high cost and inconvenience associated with use of two contrast agents. Another potential limitation is that accurate assessment of liver texture for purposes of staging fibrosis requires acquisition of high-quality images free of breathing and other motion artifacts, which are difficult to obtain in some patients. Development of robust motion correction techniques for abdominal imaging may help overcome this limitation.
Furthermore, minor adverse events have been associated with use of SPIO. The most common adverse event is back pain, which has been reported in about 10% of cirrhotic patients during infusion of the particles; it is rare in noncirrhotic patients. It is usually related to rapid injection of SPIO and resolves after the injection is paused. Other possible side effects include lower extremity pain and rare allergic reactions (32).
MR Elastography
MR elastography is a promising new MR imaging technique that noninvasively quantifies the stiffness of the liver as well as other organs by analyzing the propagation of mechanical waves through tissue (35). The application of this technique for assessing liver fibrosis is based on the biologic concept that stiffness of hepatic parenchyma increases as fibrosis advances. In chronic liver disease, progressive deposition of interconnecting collagen fibers throughout the liver produces a lattice-like framework that increases parenchymal rigidity. Because liver stiffness cannot be reliably assessed with external physical palpation, an imaging approach is required. There are two main imaging methods for measuring hepatic stiffness. One is US-based transient elastography; the other is MR elastography.
In an MR elastography examination, a mechanical driver device is placed in contact with the patient’s body wall adjacent to the liver to generate shear waves within the abdomen at a predetermined frequency (typically between 40 and 120 Hz). MR images are acquired with a gradient-echo sequence as the waves propagate through the liver. The velocity and wavelength of the waves propagating in the abdomen depend on the stiffness of the tissue (velocity and wavelength increase with greater tissue stiffness) (36). Thus, images of the propagating waves can be used to estimate the stiffness.
Motion-sensitizing gradients are applied during the image acquisition. The gradients are similar to those applied in phase-contrast MR angiography and diffusion-weighted imaging, but in MR elastography the gradients are cycled synchronously with the mechanical waves. Phase shifts in the MR signal accumulate at tissue locations where gradient cycling is exactly in phase with the mechanical wave. These phase shifts provide extraordinary sensitivity to tiny physical displacements caused by the mechanical wave.
The resulting phase-contrast images, which depict propagating mechanical waves, are processed with a special algorithm to generate quantitative stiffness maps, also known as elastograms. These maps depict tissue stiffness as the elastic shear modulus on a per-pixel basis (in units of kilopascals) and are often displayed with a color scale. Liver stiffness is typically assessed by placing regions of interest in appropriate locations on the elastograms (35,36) (Fig 15).
Figure 15a.

MR elastography of HCV-related fibrosis. MR elastographic wave images (left) and color-coded elastograms (right), obtained at 3 T in three patients with chronic HCV infection, show biopsy-proved stage F0 (a), F2 (b), and F4 (c) fibrosis. Propagation of shear waves through the liver is adequate in all three patients. The elastograms show progressively greater liver stiffness in the three patients, a finding that corresponds to increases in histologic fibrosis stage.
Figure 15b.

MR elastography of HCV-related fibrosis. MR elastographic wave images (left) and color-coded elastograms (right), obtained at 3 T in three patients with chronic HCV infection, show biopsy-proved stage F0 (a), F2 (b), and F4 (c) fibrosis. Propagation of shear waves through the liver is adequate in all three patients. The elastograms show progressively greater liver stiffness in the three patients, a finding that corresponds to increases in histologic fibrosis stage.
Figure 15c.

MR elastography of HCV-related fibrosis. MR elastographic wave images (left) and color-coded elastograms (right), obtained at 3 T in three patients with chronic HCV infection, show biopsy-proved stage F0 (a), F2 (b), and F4 (c) fibrosis. Propagation of shear waves through the liver is adequate in all three patients. The elastograms show progressively greater liver stiffness in the three patients, a finding that corresponds to increases in histologic fibrosis stage.
Recent studies in patients with a spectrum of liver disease types have shown that liver stiffness as measured with MR elastography increases as the stage of fibrosis advances. The differences in stiffness between patients with early stages of fibrosis (F0 vs F1 vs F2) are small and there is overlap between groups, but the differences between groups with higher stages (F2 vs F3 vs F4) are large, with little overlap between groups (37,38). Thus, MR elastography shows promise, particularly in patients with advanced fibrosis, for noninvasive staging of liver fibrosis. In addition, liver stiffness in normal control subjects is lower than that in patients with chronic inflammatory liver disease. This observation suggests that MR elastography may play a future role in selecting patients who may benefit from liver biopsy. Stiffness measurements are highly repeatable; thus, MR elastography also shows promise for longitudinal monitoring of patients.
An alternate modality for assessing liver stiffness is US-based transient elastography, a technology that involves acquisition of pulse-echo US signals. The probe transmits a vibration of mild amplitude and low frequency toward the liver; that vibration in turn induces a mechanical wave that propagates through the liver. Pulse-echo US acquisitions are performed to follow the propagation of the wave and measure its velocity, which is directly related to Young’s elastic modulus. The harder the tissue, the faster the shear wave propagates. As with MR elastography, results are expressed in units of kilopascals. However, US-based transient elastography measures stiffness as Young’s elastic modulus, whereas MR elastography measures stiffness as the shear modulus, so the measurements are not directly interchangeable.
MR elastography offers some advantages over US-based transient elastography. MR elastography does not require an acoustic window and is suitable for evaluation of obese patients. Data acquisition in MR elastography is operator independent. The whole liver is visualized and, in principle, the stiffness of the entire liver can be evaluated. By comparison, US-based transient elastography requires an acoustic window, results are affected by body habitus, and examinations frequently fail in obese patients and those with ascites. In addition, US-based transient elastography is operator dependent and assesses only a small volume of the liver near the surface, potentially introducing sampling variability (39).
Although promising, MR elastography has some limitations. The most important one is that MR elastography measures a surrogate of liver fibrosis (tissue stiffness) rather than fibrosis itself. The relationship between fibrosis and stiffness is nonlinear, and predicting the histologic fibrosis stage from the stiffness value may be challenging, particularly in patients with early stages of fibrosis. Moreover, MR elastographic assessment of liver fibrosis conceivably may be confounded by a variety of factors expected to alter liver stiffness, including hepatic inflammation, steatosis, hepatic vascular congestion, cholestasis, and portal hypertension (35–38). Further study will be needed to determine the extent to which these factors affect the accuracy of MR elastography for fibrosis staging.
Other limitations of MR elastography are technical. The delivery of shear waves into the abdomen may be imperfect, depending on the state of driver technology. Wave interference and attenuation may not allow calculation of valid stiffness values in some parts of the liver (40). Thus, the analyst must interpret elastograms with care and record stiffness measurements only from regions of hepatic parenchyma with reliable wave propagation data; stiffness values in other areas may be misleading. The selection of meaningful regions of interest is subjective and requires judgment and experience. To overcome this problem, objective methods of defining regions of adequate wave propagation are under development. Also, improved mechanical drivers are being designed to deliver waves more effectively and uniformly (41).
Another technical limitation that has been encountered is that in patients with moderate to severe hepatic iron overload, the signal intensity of the liver may be so low that the shear waves cannot be visualized on the phase-contrast gradient-echo images. This limitation is likely to be overcome in the future by implementing alternative pulse sequences with shorter echo times. With conventional gradient-echo sequences, acquisition of MR elastographic data may require two to four breath holds per section assessed. With the use of parallel imaging, it is now possible to acquire MR elastographic data with a single 15–20-second breath hold per section.
In summary, although MR elastography has been advocated by some investigators as an accurate noninvasive method for assessment of liver fibrosis, further studies are required to assess reproducibility and standardization of equipment and techniques.
Diffusion-weighted MR Imaging
Diffusion-weighted imaging assesses the diffusion of protons within tissue by applying motion-sensitizing gradients that cause diffusing protons to lose signal. The amount of signal loss is influenced by the strength of the diffusion weighting (the diffusion sensitivity parameter or b value of the sequence) and the ability of protons to diffuse through tissue (the apparent diffusion coefficient [ADC]) (42). Until recently, high-quality liver diffusion-weighted imaging was not achievable because of the relatively short T2 of the liver, unavoidable physiologic motion in the abdomen, susceptibility effects, and other factors. However, the recent implementation of high-performance gradients and parallel imaging has improved the quality of diffusion-weighted imaging of the liver (43). With these advances, diffusion-weighted imaging has emerged as a powerful tool to detect focal lesions and is routinely implemented in clinical practice at some centers for oncologic imaging.
An experimental application of diffusion-weighted imaging is the assessment of liver fibrosis. A central hypothesis behind use of diffusion-weighted imaging for this purpose is that fibrosis restricts water diffusion. To date, liver diffusion-weighted imaging has not achieved sufficient image quality to permit direct visualization of fibrosis, and interpretation relies on estimation of the ADC. The ADC is estimated by measuring the signal loss between images obtained with different b values. A minimum of two b values is required, but some research centers use three or more b values (Fig 16). Monoexponential decay is usually assumed in the estimation. The direction in which motion-sensitizing gradients are applied has no effect on images, and anisotropy has not been observed (42).
Figure 16a.

Diffusion-weighted imaging and ADC values in a patient with alcohol- and HCV-related cirrhosis (stage F4). (a–f) Diffusion-weighted MR images with b values of 0 (a), 100 (b), 250 (c), 500 (d), 750 (e), and 1000 (f) sec/mm2, obtained in a single breath hold at 3 T, show a progressive reduction in signal intensity of the cirrhotic liver with increasing b values; however, the reduction is less pronounced than in noncirrhotic patients. At a b value of 1000 sec/mm2, the liver silhouette remains visible. (g) Corresponding ADC map of the abdomen, generated under the assumption of monoexponential decay, shows that the liver has a mean ADC of ~0.9 × 10⁻³ mm2/sec.
Figure 16b.

Diffusion-weighted imaging and ADC values in a patient with alcohol- and HCV-related cirrhosis (stage F4). (a–f) Diffusion-weighted MR images with b values of 0 (a), 100 (b), 250 (c), 500 (d), 750 (e), and 1000 (f) sec/mm2, obtained in a single breath hold at 3 T, show a progressive reduction in signal intensity of the cirrhotic liver with increasing b values; however, the reduction is less pronounced than in noncirrhotic patients. At a b value of 1000 sec/mm2, the liver silhouette remains visible. (g) Corresponding ADC map of the abdomen, generated under the assumption of monoexponential decay, shows that the liver has a mean ADC of ~0.9 × 10⁻³ mm2/sec.
Figure 16c.

Diffusion-weighted imaging and ADC values in a patient with alcohol- and HCV-related cirrhosis (stage F4). (a–f) Diffusion-weighted MR images with b values of 0 (a), 100 (b), 250 (c), 500 (d), 750 (e), and 1000 (f) sec/mm2, obtained in a single breath hold at 3 T, show a progressive reduction in signal intensity of the cirrhotic liver with increasing b values; however, the reduction is less pronounced than in noncirrhotic patients. At a b value of 1000 sec/mm2, the liver silhouette remains visible. (g) Corresponding ADC map of the abdomen, generated under the assumption of monoexponential decay, shows that the liver has a mean ADC of ~0.9 × 10⁻³ mm2/sec.
Figure 16d.

Diffusion-weighted imaging and ADC values in a patient with alcohol- and HCV-related cirrhosis (stage F4). (a–f) Diffusion-weighted MR images with b values of 0 (a), 100 (b), 250 (c), 500 (d), 750 (e), and 1000 (f) sec/mm2, obtained in a single breath hold at 3 T, show a progressive reduction in signal intensity of the cirrhotic liver with increasing b values; however, the reduction is less pronounced than in noncirrhotic patients. At a b value of 1000 sec/mm2, the liver silhouette remains visible. (g) Corresponding ADC map of the abdomen, generated under the assumption of monoexponential decay, shows that the liver has a mean ADC of ~0.9 × 10⁻³ mm2/sec.
Figure 16e.

Diffusion-weighted imaging and ADC values in a patient with alcohol- and HCV-related cirrhosis (stage F4). (a–f) Diffusion-weighted MR images with b values of 0 (a), 100 (b), 250 (c), 500 (d), 750 (e), and 1000 (f) sec/mm2, obtained in a single breath hold at 3 T, show a progressive reduction in signal intensity of the cirrhotic liver with increasing b values; however, the reduction is less pronounced than in noncirrhotic patients. At a b value of 1000 sec/mm2, the liver silhouette remains visible. (g) Corresponding ADC map of the abdomen, generated under the assumption of monoexponential decay, shows that the liver has a mean ADC of ~0.9 × 10⁻³ mm2/sec.
Figure 16f.

Diffusion-weighted imaging and ADC values in a patient with alcohol- and HCV-related cirrhosis (stage F4). (a–f) Diffusion-weighted MR images with b values of 0 (a), 100 (b), 250 (c), 500 (d), 750 (e), and 1000 (f) sec/mm2, obtained in a single breath hold at 3 T, show a progressive reduction in signal intensity of the cirrhotic liver with increasing b values; however, the reduction is less pronounced than in noncirrhotic patients. At a b value of 1000 sec/mm2, the liver silhouette remains visible. (g) Corresponding ADC map of the abdomen, generated under the assumption of monoexponential decay, shows that the liver has a mean ADC of ~0.9 × 10⁻³ mm2/sec.
Figure 16g.

Diffusion-weighted imaging and ADC values in a patient with alcohol- and HCV-related cirrhosis (stage F4). (a–f) Diffusion-weighted MR images with b values of 0 (a), 100 (b), 250 (c), 500 (d), 750 (e), and 1000 (f) sec/mm2, obtained in a single breath hold at 3 T, show a progressive reduction in signal intensity of the cirrhotic liver with increasing b values; however, the reduction is less pronounced than in noncirrhotic patients. At a b value of 1000 sec/mm2, the liver silhouette remains visible. (g) Corresponding ADC map of the abdomen, generated under the assumption of monoexponential decay, shows that the liver has a mean ADC of ~0.9 × 10⁻³ mm2/sec.
Studies of fat-suppressed (or water-excited) diffusion-weighted echo-planar imaging have shown reduced ADC in cases of cirrhosis with various causes (42,44). This finding has led investigators to study whether diffusion-weighted imaging can be used to stage liver fibrosis. However, preliminary studies on small numbers of patients in which various hardware and sequencing profiles were used have reported inconsistent results for staging liver fibrosis with diffusion-weighted imaging (42,44,45).
There are several challenges in use of diffusion as a surrogate marker for fibrosis. Interpretation of the ADC is complex because there are several potential confounding factors, including perfusion effects, hepatic steatosis, hepatic iron, and liver inflammation. In addition, despite technical improvements in diffusion-weighted imaging, the method remains sensitive to susceptibility and motion-related artifacts, and it is difficult to obtain images with sufficient quality for reliable quantitative analysis on a consistent basis.
More important, the ADC depends on imaging parameters. Field strength, repetition time, echo time, and b values all affect the ADC. The manner in which a particular b value is achieved is also relevant. The b value is determined by the gradient strength, gradient duration, and gradient separation. Different combinations of gradient strength, gradient duration, and gradient separation may achieve the same b value but yield dissimilar ADC measurements: in general, for a fixed b value, increasing the gradient separation reduces the ADC. Because technical factors lead to differences in estimated ADC, reported ADCs are variable, with considerable overlap between normal and abnormal ranges (45). Thus, there is a need to develop site- and technique-specific normal ranges and to standardize methods across imaging centers.
MR Perfusion Imaging
Another promising MR imaging method is MR perfusion imaging. Progressive liver fibrosis gradually obliterates normal intrahepatic vessels and sinusoids and slows passage of blood through the parenchyma. In addition, as portal hypertension develops, portal venous flow to the liver decreases, hepatic arterial flow increases, and intrahepatic shunts form. These physiologic alterations can be detected with kinetic models of dynamic image data sets acquired rapidly after bolus intravenous injection of paramagnetic extracellular contrast agents. Several perfusion parameters can be estimated, including absolute portal venous blood flow, absolute arterial blood flow, absolute total liver blood flow, portal venous fraction, arterial fraction, distribution volume, and mean transit time (46).
A recent study applied a dual-input kinetic model for the noninvasive assessment of liver fibrosis (47). The dual-input approach models two sources of blood flow into the liver, via the hepatic artery and portal vein, and assumes a single tissue compartment. Significant differences were found in several perfusion parameters between patients with and without advanced fibrosis: those with advanced fibrosis had increased absolute arterial blood flow, arterial fraction, distribution volume, and mean transit time. In addition, the distribution volume parameter demonstrated a sensitivity of 77% and specificity of 79% for the diagnosis of advanced fibrosis (47).
Similarly to diffusion-weighted imaging and MR elastography, MR perfusion imaging is limited because it measures surrogate markers of liver fibrosis rather than fibrosis itself. Several factors may affect the correlation between perfusion parameters and fibrosis, including cardiac status, fasting state, hepatic congestion, hepatic inflammation, hepatic lesions, and portal venous flow. Other limitations include the need for modeling assumptions, which may be only partially correct, and the requirement of very rapid imaging, which leads to compromises in image quality or coverage.
In general, images acquired for perfusion analysis are not suitable for assessment of structural abnormalities such as small nodules, and a second contrast material injection may be necessary. In addition, the image analysis is laborious and requires placement of co-localized regions of interest on the input vessels (aorta and portal vein) and tissue of interest (liver) in a large number of different acquisitions. Sophisticated and automatic methods of misregistration correction software will be required before this technique is widely implemented.
Future Directions
A great challenge in the noninvasive assessment of liver fibrosis is use of an imaging parameter as a biomarker for fibrosis in chronic liver disease. The imaging parameters discussed in this review (parenchymal texture alterations assessed with double contrast-enhanced MR imaging, tissue stiffness estimated with MR elastography, ADC estimated with diffusion-weighted imaging, perfusion parameters estimated with MR perfusion imaging) may be influenced by several factors, including hepatic necroinflammatory activity, steatosis, hepatic perfusion alterations, edema, and iron overload. The influences of these factors on imaging biomarkers of fibrosis should be further investigated in experimental studies and larger prospective clinical trials.
In the future, new MR imaging contrast agents that specifically target collagen or other extracellular matrix macromolecules may be developed. A collagen-specific MR imaging contrast agent could act as a fibrosis-imaging agent, and these agents may have higher efficacy for fibrosis assessment than the current state-of-the-art methods described herein (48,49). In addition, MR imaging contrast agents that selectively target hepatic stellate cells and other cells involved in the pathogenesis of liver fibrosis may permit imaging of fibrogenesis or fibrolysis, thereby allowing assessment of the rate at which fibrous tissue is being deposited or being removed (50). All such data may provide valuable information for guiding antifibrotic therapy development and monitoring patients in clinical trials.
Summary
Hepatic fibrosis and cirrhosis represent a major public health problem worldwide, with an alarmingly rapidly increasing prevalence in the United State. Liver biopsy is necessary for diagnosis and staging of liver fibrosis. However, it is an invasive method, with inherent risks that include sampling error, serious complications, and even death. Currently, there is an urgent need for a noninvasive method for assessment of liver fibrosis. US- and CT-based modalities can demonstrate the morphologic alterations of cirrhosis, but they are limited in evaluating patients with earlier stages of liver disease.
Advances in MR imaging, with its unique and intrinsic imaging capabilities, have provided the opportunity to revolutionize how we image and evaluate patients with liver fibrosis. In addition, with the development of new antifibrotic therapeutic agents, MR imaging–based techniques may play a central role in monitoring treatment response and in clinical management of patients with chronic liver disease. However, although the preliminary results are promising, further prospective studies are required to validate these emerging noninvasive MR imaging–based techniques and determine how they may be translated into clinical practice for the assessment of hepatic fibrosis.
Footnotes
Double contrast-enhanced MR imaging is off-label use. M.P. is a stockholder in Hologic and QIAGEN; C.S. receives research support from General Electric; C.B.S. receives research support from Bayer, General Electric, and Bracco and has contracts with Isis Pharmaceuticals and Wyeth; all other authors have no financial relationships to disclose.
- ADC
- apparent diffusion coefficient
- HCC
- hepatocellular carcinoma
- HCV
- hepatitis C virus
- SPIO
- superparamagnetic iron oxide
- 3D
- three-dimensional
- 2D
- two-dimensional
References
- 1.Friedman SL. Hepatic fibrosis: overview. Toxicology 2008;254(3):120–129. [DOI] [PubMed] [Google Scholar]
- 2.Wallace K, Burt AD, Wright MC. Liver fibrosis. Biochem Genet 2008;411(1):1–18. [DOI] [PubMed] [Google Scholar]
- 3.Afdhal NH, Nunes D. Evaluation of liver fibrosis: a concise review. Am J Gastroenterol 2004;99(6): 1160–1174. [DOI] [PubMed] [Google Scholar]
- 4.Jou JH, Muir AJ. In the clinic: hepatitis C. Ann Intern Med 2008;148(11):ITC6-1–ITC6-16. [DOI] [PMC free article] [PubMed] [Google Scholar]
- 5.Vuppalanchi R, Chalasani N. Nonalcoholic fatty liver disease and nonalcoholic steatohepatitis: selected practical issues in their evaluation and management. Hepatology 2009;49(1):306–317. [DOI] [PMC free article] [PubMed] [Google Scholar]
- 6.Schuppan D, Afdhal NH. Liver cirrhosis. Lancet 2008;371(9615):838–851. [DOI] [PMC free article] [PubMed] [Google Scholar]
- 7.Yeh MM, Brunt EM. Pathology of nonalcoholic fatty liver disease. Am J Clin Pathol 2007;128(5): 837–847. [DOI] [PubMed] [Google Scholar]
- 8.Wanless IR, Crawford JM. Cirrhosis. In: , Odze RD, Goldblum JR, Crawford JM, eds. Surgical pathology of the GI tract, liver, biliary tract, and pancreas. Philadelphia, Pa: Elsevier, 2004; chap 37. [Google Scholar]
- 9.Intraobserver and interobserver variations in liver biopsy interpretation in patients with chronic hepatitis C. The French METAVIR Cooperative Study Group. Hepatology 1994;20(1 pt 1):15–20. [PubMed] [Google Scholar]
- 10.Ishak K, Baptista A, Bianchi L, et al. Histological grading and staging of chronic hepatitis. J Hepatol 1995;22(6):696–699. [DOI] [PubMed] [Google Scholar]
- 11.Batts KP, Ludwig J. Chronic hepatitis: an update on terminology and reporting. Am J Surg Pathol 1995;19(12):1409–1417. [DOI] [PubMed] [Google Scholar]
- 12.Brunt EM, Janney CG, Di Bisceglie AM, Neuschwander-Tetri BA, Bacon BR. Nonalcoholic steatohepatitis: a proposal for grading and staging the histological lesions. Am J Gastroenterol 1999;94 (9):2467–2474. [DOI] [PubMed] [Google Scholar]
- 13.Kleiner DE, Brunt EM, Van Natta M, et al. Design and validation of a histological scoring system for nonalcoholic fatty liver disease. Nonalcoholic Steatohepatitis Clinical Research Network. Hepatology 2005;41(6):1313–1321. [DOI] [PubMed] [Google Scholar]
- 14.Schwimmer JB, Behling C, Newbury R, et al. Histopathology of pediatric nonalcoholic fatty liver disease. Hepatology 2005;42(3):641–649. [DOI] [PubMed] [Google Scholar]
- 15.Thiese ND, Bodenheimer HC, Ferrell LD. Acute and chronic viral hepatitis. In: , Burt AD, Portmann BC, Ferrell LD, eds. MacSween’s pathology of the liver. 5th ed Edinburgh, Scotland: Churchill Livingstone, 2006; chap 8. [Google Scholar]
- 16.Janes CH, Lindor KD. Outcome of patients hospitalized for complications after outpatient liver biopsy. Ann Intern Med 1993;118(2):96–98. [DOI] [PubMed] [Google Scholar]
- 17.Regev A, Berho M, Jeffers LJ, et al. Sampling error and intraobserver variation in liver biopsy in patients with chronic HCV infection. Am J Gastroenterol 2002;97(10):2614–2618. [DOI] [PubMed] [Google Scholar]
- 18.Poniachik J, Bernstein DE, Reddy KR, et al. The role of laparoscopy in the diagnosis of cirrhosis. Gastrointest Endosc 1996;43(6):568–571. [DOI] [PubMed] [Google Scholar]
- 19.Colloredo G, Guido M, Sonzogni A, Leandro G. Impact of liver biopsy size on histological evaluation of chronic viral hepatitis: the smaller the sample, the milder the disease. J Hepatol 2003;39(2): 239–244. [DOI] [PubMed] [Google Scholar]
- 20.Dodd GD, Baron RL, Oliver JH, Federle MP. Spectrum of imaging findings of the liver in end-stage cirrhosis. I. Gross morphology and diffuse abnormalities. AJR Am J Roentgenol 1999;173 (4):1031–1036. [DOI] [PubMed] [Google Scholar]
- 21.Dodd GD, Baron RL, Oliver JH, Federle MP. Spectrum of imaging findings of the liver in end-stage cirrhosis. II. Focal abnormalities. AJR Am J Roentgenol 1999;173(5):1185–1192. [DOI] [PubMed] [Google Scholar]
- 22.Ito K, Mitchell DG. Imaging diagnosis of cirrhosis and chronic hepatitis. Intervirology 2004;47(3–5): 134–143. [DOI] [PubMed] [Google Scholar]
- 23.Martin DR. Magnetic resonance imaging of diffuse liver diseases. Top Magn Reson Imaging 2002;13 (3):151–163. [DOI] [PubMed] [Google Scholar]
- 24.Ito K, Mitchell DG, Siegelman ES. Cirrhosis: MR imaging features. Magn Reson Imaging Clin N Am 2002;10(1):75–92. [DOI] [PubMed] [Google Scholar]
- 25.Brancatelli G, Federle MP, Ambrosini R, et al. Cirrhosis: CT and MR imaging evaluation. Eur J Radiol 2007;61(1):57–69. [DOI] [PubMed] [Google Scholar]
- 26.Bydder M, Yokoo T, Hamilton G, et al. Relaxation effects in the quantification of fat using gradient echo imaging. Magn Reson Imaging 2008;26(3): 347–359. [DOI] [PMC free article] [PubMed] [Google Scholar]
- 27.Yokoo T, Bydder M, Hamilton G, et al. Nonalcoholic fatty liver disease: diagnostic and fat-grading accuracy of low-flip-angle multiecho gradient-recalled-echo MR imaging at 1.5 T. Radiology 2009; 251(1):67–76. [DOI] [PMC free article] [PubMed] [Google Scholar]
- 28.Balci NC, Semelka RC. Contrast agents for MR imaging of the liver. Radiol Clin North Am 2005; 43(5):887–898. [DOI] [PubMed] [Google Scholar]
- 29.Ferrucci JT, Stark DD. Iron oxide-enhanced MR imaging of the liver and spleen: review of the first 5 years. AJR Am J Roentgenol 1990;155(5):943–950. [DOI] [PubMed] [Google Scholar]
- 30.Lucidarme O, Baleston F, Cadi M, et al. Non-invasive detection of liver fibrosis: is superparamagnetic iron oxide particle-enhanced MR imaging a contributive technique? Eur Radiol 2003;13(3): 467–474. [DOI] [PubMed] [Google Scholar]
- 31.Ward J, Robinson PJ. Combined use of MR contrast agents for evaluating liver disease. Magn Reson Imaging Clin N Am 2001;9(4):767–802. [PubMed] [Google Scholar]
- 32.Helmberger T, Semelka RC. New contrast agents for imaging the liver. Magn Reson Imaging Clin N Am 2001;9(4):745–766. [PubMed] [Google Scholar]
- 33.Hughes-Cassidy F, Chavez AD, Schlang A, et al. Superparamagnetic iron oxides and low molecular weight gadolinium chelates are synergistic for direct visualization of advanced liver fibrosis. J Magn Reson Imaging 2007;26(3):728–737. [DOI] [PubMed] [Google Scholar]
- 34.Aguirre DA, Behling CA, Alpert E, Hassanein TI, Sirlin CB. Liver fibrosis: noninvasive diagnosis with double contrast material-enhanced MR imaging. Radiology 2006;239(2):425–437. [DOI] [PubMed] [Google Scholar]
- 35.Manduca A, Oliphant TE, Dresner MA, et al. Magnetic resonance elastography: non-invasive mapping of tissue elasticity. Med Image Anal 2001; 5(4):237–254. [DOI] [PubMed] [Google Scholar]
- 36.Talwalkar JA, Yin M, Fidler JL, Sanderson SO, Kamath PS, Ehman RL. Magnetic resonance imaging of hepatic fibrosis: emerging clinical applications. Hepatology 2008;47(1):332–342. [DOI] [PubMed] [Google Scholar]
- 37.Rouvière O, Yin M, Dresner MA, et al. MR elastography of the liver: preliminary results. Radiology 2006;240(2):440–448. [DOI] [PubMed] [Google Scholar]
- 38.Yin M, Talwalkar JA, Glaser KJ, et al. A preliminary assessment of hepatic fibrosis with magnetic resonance elastography. Clin Gastroenterol Hepatol 2007;5(10):1207–1213. [DOI] [PMC free article] [PubMed] [Google Scholar]
- 39.Bensamoun SF, Wang L, Robert L, Charleux F, Latrive JP, Ho Ba Tho MC. Measurement of liver stiffness with two imaging techniques: magnetic resonance elastography and ultrasound elastometry. J Magn Reson Imaging 2008;28(5):1287–1292. [DOI] [PubMed] [Google Scholar]
- 40.Souchon R, Salomir R, Beuf O, et al. Transient MR elastography (t-MRE) using ultrasound radiation force: theory, safety, and initial experiments in vitro. Magn Reson Med 2008;60(4):871–881. [DOI] [PubMed] [Google Scholar]
- 41.Mariappan YK, Rossman PJ, Glaser KJ, Manduca A, Ehman RL. Magnetic resonance elastography with a phased-array acoustic driver system. Magn Reson Med 2009;61(3):678–685. [DOI] [PMC free article] [PubMed] [Google Scholar]
- 42.Lewin M, Poujol-Robert A, Boëlle PY, et al. Diffusion-weighted magnetic resonance imaging for the assessment of fibrosis in chronic hepatitis C. Hepatology 2007;46(3):658–665. [DOI] [PubMed] [Google Scholar]
- 43.Taouli B, Martin AJ, Qayyum A, et al. Parallel imaging and diffusion tensor imaging for diffusion-weighted MRI of the liver: preliminary experience in healthy volunteers. AJR Am J Roentgenol 2004; 183(3):677–680. [DOI] [PubMed] [Google Scholar]
- 44.Taouli B, Tolia AJ, Losada M, et al. Diffusion-weighted MRI for quantification of liver fibrosis: preliminary experience. AJR Am J Roentgenol 2007; 189(4):799–806. [DOI] [PubMed] [Google Scholar]
- 45.Boulanger Y, Amara M, Lepanto L, et al. Diffusion-weighted MR imaging of the liver of hepatitis C patients. NMR Biomed 2003;16(3):132–136. [DOI] [PubMed] [Google Scholar]
- 46.Hagiwara M, Rusinek H, Lee VS, et al. Advanced liver fibrosis: diagnosis with 3D whole-liver perfusion MR imaging—initial experience. Radiology 2008;246(3):926–934. [DOI] [PubMed] [Google Scholar]
- 47.Miyazaki S, Yamazaki Y, Murase K. Error analysis of the quantification of hepatic perfusion using a dual-input single-compartment model. Phys Med Biol 2008;53(21):5927–5946. [DOI] [PubMed] [Google Scholar]
- 48.Caravan P, Das B, Dumas S, et al. Collagen-targeted MRI contrast agent for molecular imaging of fibrosis. Angew Chem Int Ed Engl 2007;46(43): 8171–8173. [DOI] [PubMed] [Google Scholar]
- 49.Caravan P. Protein-targeted gadolinium-based magnetic resonance imaging (MRI) contrast agents: design and mechanism of action. Acc Chem Res 2009. February 17 [Epub ahead of print] [DOI] [PubMed] [Google Scholar]
- 50.Beljaars L, Meijer DK, Poelstra K. Targeting hepatic stellate cells for cell-specific treatment of liver fibrosis. Front Biosci 2002;7:e214–e222. [DOI] [PubMed] [Google Scholar]