

Abstract
Magnetic resonance (MR) imaging is the most important imaging modality for the evaluation of traumatic or degenerative cartilaginous lesions in the knee. It is a powerful noninvasive tool for detecting such lesions and monitoring the effects of pharmacologic and surgical therapy. The specific MR imaging techniques used for these purposes can be divided into two broad categories according to their usefulness for morphologic or compositional evaluation. To assess the structure of knee cartilage, standard spin-echo (SE) and gradient-recalled echo (GRE) sequences, fast SE sequences, and three-dimensional SE and GRE sequences are available. These techniques allow the detection of morphologic defects in the articular cartilage of the knee and are commonly used in research for semiquantitative and quantitative assessments of cartilage. To evaluate the collagen network and proteoglycan content in the knee cartilage matrix, compositional assessment techniques such as T2 mapping, delayed gadolinium-enhanced MR imaging of cartilage (or dGEMRIC), T1ρ imaging, sodium imaging, and diffusion-weighted imaging are available. These techniques may be used in various combinations and at various magnetic field strengths in clinical and research settings to improve the characterization of changes in cartilage.
©RSNA, 2011
Invited Commentary—
See discussion on this article by Disler (pp 61–62).
Introduction
Hyaline cartilage is an important intraarticular tissue that may be involved in traumatic injury to and degenerative change in the knee joint. Damaged cartilage rarely heals spontaneously, and its subsequent degeneration in association with degeneration of other articular tissues may lead to knee osteoarthritis, which is both a cartilaginous and a whole-organ disease (1). In recent decades, magnetic resonance (MR) imaging has become the most important modality for assessment of pathologic changes in knee cartilage, in both clinical and research environments. One of the major advantages of MR imaging is that it allows the manipulation of contrast to highlight different tissue types. The new surgical and pharmacologic options available to treat damaged cartilage, and the need to monitor the effects of treatment, have led to development of various MR imaging techniques that allow morphologic assessment of cartilage, quantification of its volume, and evaluation of its biochemical composition (2–7).
Pharmacologic agents proposed to preserve hyaline cartilage or to treat damage to the cartilage include dietary supplements such as chondroitin and glucosamine sulfates. Their effectiveness for slowing or halting progression of cartilaginous degeneration, decreasing knee pain, and improving joint function is debated, although there is some evidence for the clinical effectiveness of glucosamine sulfate (8). The mechanism of activity of these agents remains obscure, but continuing research into these and other potentially chondroprotective agents will require techniques to monitor both the morphologic status and the composition of hyaline cartilage.
Various reparative and reconstructive surgical techniques are available to treat traumatic and degenerative cartilaginous damage. Reparative techniques, such as microfracturing and drilling, stimulate the local formation of fibrocartilage by bringing in new cells capable of chondrogenesis and facilitating access to the vascular system. Reconstructive techniques, such as autologous chondrocyte implantation and osteochondral autologous transplantation (mosaicplasty), involve filling of the defect with autologous or homologous tissue or synthetic material. There is evidence that medium-to-large osteochondral lesions should be repaired with techniques such as autologous chondrocyte implantation and osteochondral autologous transplantation and that smaller lesions (<1 cm2) are better repaired with a single-plug osteochondral autologous transplant than with microfracturing (9,10). Microfracturing is preferable for small chondral lesions. However, to our knowledge, no long-term observational study of the joint-protective effect of focal cartilage repair with any of these techniques has yet been performed.
Even though clinical outcome of clinical and surgical treatments is the most important outcome parameter in trials, the morphologic and compositional quality of cartilage can provide valuable information about progression of degeneration or durability of repair tissue. MR imaging, the imaging method of choice for detecting morphologic and compositional alterations in knee cartilage, is therefore useful for monitoring the effects of therapies for osteoarthritis and cartilage injury. Current MR imaging techniques to assess morphologic status of cartilage include conventional spin-echo (SE) and gradient-recalled echo (GRE) sequences, fast SE sequences, and more advanced isotropic three-dimensional (3D) SE and GRE sequences. Compositional assessment techniques include T2 mapping, delayed gadolinium-enhanced MR imaging of cartilage (dGEMRIC), T1ρ imaging, sodium imaging, and diffusion-weighted imaging.
The article reviews currently available MR imaging techniques for evaluating the morphologic and compositional characteristics of articular cartilage in the knee in clinical and research settings. Specific applications of each technique for detecting and assessing cartilage injury or disease (eg, osteoarthritis) and monitoring the effects of therapy are discussed in detail.
Morphologic Assessment
MR imaging techniques for morphologic assessment of cartilage in the knee provide accurate information about processes such as fissuring and focal or diffuse partial- or full-thickness cartilage loss. In clinical practice, cartilage lesions in the knee are commonly graded with a modified Noyes or Outerbridge scale (11,12). Morphologic MR imaging assessment of cartilage repair provides accurate postoperative information about specific parameters that are selected according to the surgical technique used (5,6). In clinical research, especially in knee osteoarthritis trials, morphologic evaluation of cartilage with MR imaging has been performed by using semiquantitative scoring methods such as those known by the acronyms WORMS (whole-organ MR imaging Score) (13), BLOKS (Boston-Leeds osteoarthritis knee score) (14), and KOSS (knee osteoarthritis scoring system) (15). In such scoring systems, morphologic characteristics of joint cartilage are assessed in conjunction with those of other structures around the knee (eg, menisci, subchondral bone, osteophytes, and synovium) to establish morphologic risk factors for pain and progression of disease in patients with knee osteoarthritis. Each technique has its strengths and weaknesses for various clinical applications (Table 1), and the physician or researcher must consider these carefully. Some of the techniques that are described here are vendor specific and may not be available on all MR imaging systems.
Table 1.
Characteristics, Strengths, and Drawbacks of MR Imaging Techniques for Morphologic Assessment of Knee Cartilage
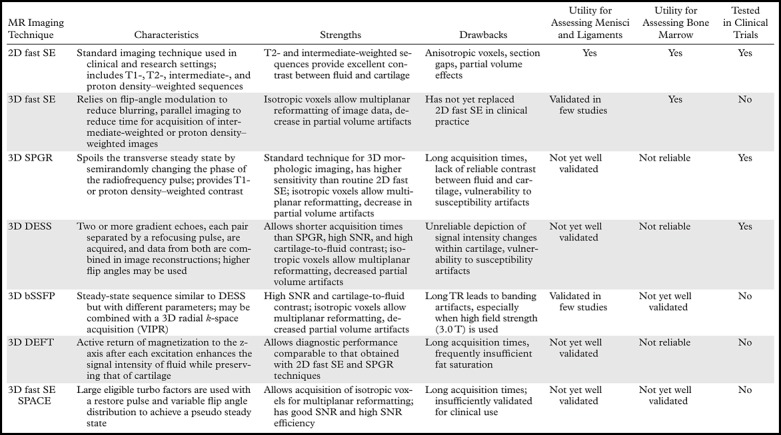
Note.—bSSFP = balanced steady state free precession, DEFT = driven equilibrium Fourier transform, DESS = dual-echo steady state, SNR = signal-to-noise ratio, SPACE = sampling perfection with application-optimized contrast using different flip-angle evolutions, SPGR = spoiled gradient-recalled echo, TR = repetition time, 2D = two-dimensional, VIPR = vastly undersampled isotropic projection reconstruction.
Fat Suppression Techniques
Various MR imaging parameters, including tissue relaxation times, affect the contrast between fluid and cartilage. A fat suppression technique may be used to increase the contrast between lipid surfaces and nonlipid surfaces, add dynamic range, and reduce chemical shift artifacts. In cartilage imaging, fat suppression techniques provide increased contrast at the subchondral bone–cartilage interface. The most commonly used technique is fat saturation, which involves the excitation and dephasing of the spinning protons in fat by a lipid-specific radiofrequency pulse applied before each repetition of a 2D or 3D SE or GRE imaging sequence. One disadvantage of using this fat saturation technique in combination with the 3D GRE sequences that are commonly used for morphologic assessment of cartilage in the knee is that it lengthens the acquisition time (16). Furthermore, this chemically selective fat saturation technique is vulnerable to magnetic field inhomogeneities produced by magnetic susceptibility differences due to local factors (eg, the presence of metallic hardware), a common problem during MR imaging of the knee.
Iterative decomposition of water and fat with echo asymmetry and least-squares estimation (IDEAL) can provide uniform fat suppression in the challenging magnetic field environments of knee imaging while maintaining a high SNR (Fig 1). This three-point water-fat separation technique relies on the use of asymmetric echoes and least-squares fitting to maximize SNR performance (17), and it can be used in conjunction with either an SE or a GRE technique. Another alternative option is a spectral excitation technique in which only water spins in a surface are excited (18).
(a) Sagittal intermediate-weighted fat-saturated fast SE image (TR msec/echo time [TE] msec = 4000/35) shows regions of high signal intensity due to poor fat saturation (arrowheads) adjacent to a tibial interference screw (arrow). (b) Sagittal intermediate-weighted IDEAL fast SE water image (TR/TE = 4000/35) depicts a cyst adjacent to the interference screw (arrow). The signals from fat and water are better differentiated with this technique.
Figure 1a.

Figure 1b.

Short inversion time inversion recovery (or STIR) imaging is another option for assessing areas that may be affected by magnetic field inhomogeneity. This technique provides fat suppression (albeit at the expense of the SNR and contrast-to-noise ratio [CNR]), allowing accurate depiction of cartilaginous defects in the knee joint (11) (Fig 2). It is commonly used for that purpose, even in large knee osteoarthritis trials (19).
Figure 2.

Axial short inversion time inversion recovery image obtained in the knee accurately depicts a focal full-thickness chondral defect (arrows) at the trochlear groove.
Water excitation imaging is based on the selective excitation of non–fat-bound protons. A short TR of approximately 18 msec and a small flip angle (15°–40°) are usually used to depict cartilage with high signal intensity and high contrast to surrounding tissue. The use of water excitation provides the major advantages of reducing acquisition time (by obviating the time-consuming implementation of spectral fat saturation to eliminate the lipid signal) and ameliorating chemical shift artifacts (20). Water excitation also may be applied for quantitative assessments of cartilage thickness and volume (21). The use of water excitation for measuring cartilage volume and thickness in conjunction with commonly used GRE MR imaging techniques has been demonstrated (20,22).
Two-dimensional SE and Fast SE Imaging
The MR imaging sequences most commonly used in the assessment of joint cartilage are 2D or multisection T1-weighted, proton density–weighted, and T2-weighted imaging sequences with or without fat suppression. T1-weighted images show intrasubstance anatomic detail of hyaline cartilage (23) but do not provide good contrast between joint effusion and the cartilage surface, a shortcoming that limits their usefulness in the assessment of focal cartilaginous defects (Fig 3). Furthermore, T1 weighting has poor capability for depicting other internal structures in the knee, such as ligaments, and may lead to overestimation of meniscal abnormalities. T2-weighted imaging provides good contrast between the cartilage surface and joint effusion, which is useful for detecting focal areas of delamination or other defects (Fig 4). However, it does so at the expense of the internal cartilage signal, which is weakened because some components of cartilage have short T2 (24). Although proton density–weighted imaging is capable of depicting surface cartilaginous defects as well as abnormalities of internal cartilage composition, several institutions prefer to use intermediate-weighted sequences that combine the contrast advantage of proton density weighting with that of T2 weighting by using a TE of 33–60 msec. These sequences provide higher overall signal intensity in cartilage than standard T2-weighted sequences do (Fig 5), allowing better differentiation between cartilage and subchondral bone. In addition, they are less susceptible to the magic angle effects seen in proton density–weighted imaging with a shorter TE (7).
Sagittal 2D fast SE images obtained with various techniques in the same knee as in Figure 2. (a) T1-weighted image shows poor contrast between the cartilage surface and synovial fluid, a disadvantage that prevents accurate assessment of a focal cartilaginous defect (arrowheads). (b, c) T2-weighted (b) and proton density–weighted (c) images provide better contrast between the cartilage surface and synovial fluid, allowing identification of a full-thickness cartilaginous defect (arrowheads) in the medial femoral condyle. A tear of the posterior horn of the medial meniscus also is visible in a–c.
Figure 3a.

Figure 3b.

Figure 3c.

(a) Axial 2D T2-weighted non–fat-suppressed fast SE image provides excellent contrast between cartilage surfaces and synovial fluid, but the cartilage is poorly depicted with diffuse low signal intensity, and there is no contrast between cartilage and cortical bone. (b) Axial 2D intermediate-weighted fat-suppressed fast SE image shows excellent contrast among cartilage surfaces, synovial fluid, and subchondral bone, as well as variation of signal intensity within the cartilage.
Figure 5a.

Figure 5b.

Figure 4.

Axial 2D T2-weighted fast SE image provides excellent depiction of a focal region of deep cartilaginous delamination (arrows), with high contrast between the cartilage surfaces and synovial fluid.
Two-dimensional fast or turbo SE imaging sequences provide excellent SNR and contrast between tissues and clear delineation of lesions in knee cartilage (12). Because multiple echoes are acquired with each sequence repetition, acquisition time is shorter than that with standard SE sequences. Two-dimensional fast SE imaging is the technique most often used in clinical practice for the assessment of knee joint abnormalities, including cartilaginous lesions.
Proton density–weighted and T2-weighted fast SE imaging techniques are well suited for morphologic assessments of articular cartilage as well as menisci and ligamentous structures, providing information of a quality comparable to that obtained in surgery (25). In knee osteoarthritis trials, fast SE techniques applied for the morphologic assessment of cartilage and other structures within the knee have allowed the identification of potential risk factors for the progression of disease over time (26). Fast SE imaging is part of the protocol recommended by the International Cartilage Repair Society for the evaluation of cartilage repair (27).
Although fast SE sequences provide excellent SNR and contrast between tissues of interest, 2D fast SE imaging may suffer from anisotropic voxels, section gaps, and partial volume effects. Furthermore, this technique requires the acquisition of image data in multiple planes.
Three-dimensional Fast SE Imaging
Three-dimensional GRE sequences, which provide high-spatial-resolution image datasets consisting of isotropic voxels, have been applied to increase the accuracy of MR imaging of articular cartilage in the knee but are not ideal for assessing the adjacent subchondral bone (28,29). The evaluation of adjacent bone is crucial for determining the extent of traumatic and degenerative cartilaginous lesions. Recently, 3D intermediate-weighted fast SE sequences have been applied to obtain images of the knee joint with high contrast resolution and isotropic spatial resolution. This technique, which relies on flip angle modulation to reduce blurring and parallel imaging to reduce acquisition time, has made high-contrast isotropic imaging possible in the clinical setting. Fast SE pulse sequences and other MR imaging techniques that provide isotropic spatial resolution allow high-quality multiplanar reformatting of image data for 3D evaluation of the anatomy (Fig 6). Recent studies showed that the use of 3D fast SE sequences resulted in a diagnostic performance commensurate with that achieved with standard multiplanar 2D fast SE techniques in the morphologic evaluation of cartilage and other internal structures of the knee, such as the menisci and cruciate ligaments (25,30). Furthermore, unlike 3D GRE sequences, 3D fast SE sequences provide good depiction of subchondral bone marrow abnormalities. To date, 3D fast SE imaging has not replaced routine 2D fast SE imaging in clinical practice. However, we believe that with further optimization, a single-acquisition 3D fast SE technique with multiplanar reformatting could replace standard 2D fast SE techniques, helping substantially reduce the examination time.
(a) Coronal 3D intermediate-weighted fast SE source image (TR/TE = 3000/35) obtained with isotropic spatial resolution (acquired section thickness of 0.6 mm, averaged to 2.4 mm; acquisition time, 5 min) shows no cartilage abnormalities. (b, c) Axial (b) and sagittal (c) images obtained with reformatting of the coronal source image dataset show a focal chondral defect (arrow) at the trochlear groove.
Figure 6a.

Figure 6b.

Figure 6c.

SPGR Imaging
Three-dimensional SPGR imaging is considered the standard technique for morphologic evaluations of knee cartilage because it offers higher sensitivity than 2D techniques and provides excellent depiction of cartilaginous defects, comparable to that achieved with arthroscopy (16,31). In 3D SPGR imaging, the transverse steady state is spoiled by semirandom alterations in the phase of the radiofrequency pulse to obtain contrast similar to that of T1-weighted or proton density–weighted imaging. An SPGR sequence is available on most MR imaging systems and is useful whenever the evaluation of cartilage is required. SPGR imaging increases the signal intensity of cartilage in relation to that of adjacent tissues and joint contents such as fluid (Fig 7). Furthermore, this technique allows the acquisition of nearly isotropic voxels, providing high-resolution 3D image data that are ideal for avoiding partial volume artifacts and achieving accurate quantitative assessment of cartilage thickness and volume. Lipid suppression is often achieved by using fat saturation, but it may also be obtained with water excitation. SPGR imaging has been used in knee osteoarthritis trials for the quantitative assessment of cartilage by using a segmentation method (32) and has proved useful in the detection of risk factors for progression of cartilage loss (33).
Figure 7.

Coronal 3D SPGR image shows intact high-signal-intensity cartilaginous surfaces in the medial and lateral tibiofemoral compartments. Lipid suppression provides excellent contrast between cartilage and subchondral bone.
This technique has some disadvantages. First, small focal lesions may be obscured because of the lack of reliable contrast between cartilage and fluid that outlines surface defects. Second, the technique is unreliable for assessing knee structures other than articular cartilage: Magic angle effects may lead to false-positive findings in ligaments and menisci, and magnetic susceptibility effects may obscure bone marrow abnormalities. Third, long acquisition times may lead to motion artifacts and less accurate measurements, although these problems may be less severe with current MR imaging systems. Fourth, the technique is highly vulnerable to susceptibility artifacts. Furthermore, the gradient and radiofrequency spoiler pulse applied at the end of each sequence repetition to decrease artifacts and obtain near–T1-weighted cartilage-to-fluid contrast also results in lower overall signal intensity, compared with that obtained with steady-state imaging techniques. In a recent study, high-resolution images of knee joint cartilage were obtained with an increased SNR, better cartilage-to-fluid contrast, and shorter acquisition time with combined IDEAL and SPGR sequences than with a standard fat-saturated SPGR sequence alone (34).
Fast low-angle shot (FLASH) imaging is an SPGR-type technique in which a random gradient pulse is used to produce a phase shift and spoil the steady state, with the same goal of achieving proton density–weighted or T1-weighted contrast resolution. With a demonstrated diagnostic performance commensurate with that at 2D SE and 3D GRE imaging in the detection of cartilage defects, FLASH imaging is an accepted technique for morphologic assessments of articular cartilage in the knee (22). Furthermore, the usefulness of this technique for assessing change in cartilage thickness and volume over time has been proven in knee osteoarthritis trials (35). Lipid suppression is usually achieved with an additional fat saturation or water excitation pulse. Normal cartilage has high signal intensity on FLASH images, a characteristic that makes surface lesions more visible but may impede the detection of internal cartilage defects such as fissures. The FLASH technique allows the acquisition of high-spatial-resolution images, but the long acquisition time may lead to motion artifacts. Furthermore, the technique is vulnerable to susceptibility artifacts, which may lead to underestimation of the extent of associated bone marrow changes—a potential disadvantage when evaluating the effectiveness of cartilage repair procedures (Fig 8). Nevertheless, FLASH imaging is useful for the volumetric assessment of knee cartilage after repair with techniques such as autologous chondrocyte implantation (36).
(a) Coronal T2-weighted fat-suppressed image shows large areas of complete loss of cartilage in the medial tibiofemoral compartment with associated edematous degenerative lesions in subchondral bone marrow (arrowheads). Large osteophytes and medial meniscal extrusion also are seen. (b) Coronal 3D FLASH image accurately depicts the areas of complete loss of cartilage in the medial compartment as seen in a, but the associated bone marrow lesions are barely visible.
Figure 8a.

Figure 8b.

DEFT Imaging
DEFT imaging, which is based on the active return of magnetization to the z-axis after each excitation, increases contrast between fluid and cartilage by enhancing the synovial fluid signal while preserving the signal from cartilage. Because of the short TE in DEFT imaging, the fluid signal intensity is higher than that in SPGR imaging and the cartilage signal intensity is higher than that in T2-weighted fast SE imaging (37). Contrast between tissues is dependent on the ratio of T1 to T2 in each tissue, and cartilage-to-fluid contrast is higher with a short TR at DEFT imaging than at imaging with proton density–weighted fast SE, T2-weighted fast SE, or SPGR techniques (37) (Fig 9). Lipid suppression is often achieved with a fat saturation pulse. Diagnostic performance with DEFT imaging for the detection of cartilaginous lesions in the knee is comparable to that with standard 2D techniques and SPGR sequences (38). The use of a similar technique dubbed DRIVE, in which a 2D multisection fast SE sequence is combined with a driven equilibrium Fourier transform, was recently described (39). This technique provides native arthrographic contrast by increasing the signal intensity of synovial fluid while allowing the signal intensities of soft tissues and bone to remain unchanged from those at standard T1-weighted fast SE imaging.
Figure 9.

Sagittal 3D DEFT image demonstrates a cartilage fissure (arrow) at the medial tibial plateau. The defect is outlined by the high signal intensity of synovial fluid, an appearance that derives from the driven equilibrium acquisition technique.
The disadvantages of DEFT imaging are its (a) vulnerability to motion artifacts due to long acquisition times; (b) often inadequate fat saturation; and (c) insensitivity to bone marrow changes such as edema, which can lead to underestimation of the extent of bone marrow lesions. To our knowledge, no large clinical studies involving 3D DEFT imaging in patients with knee osteoarthritis or knee cartilage repair have yet been performed.
DESS Imaging
In 3D dual-echo steady-state (DESS) imaging, two or more gradient echoes are acquired, with each group of two echoes separated by a refocusing pulse and with the data from both echoes combined to obtain higher T2* weighting for high signal intensity in cartilage and synovial fluid. Depending on the parameters used to acquire 3D DESS images, contrast between the cartilage surface and synovial fluid may be too slight to clearly delineate small cartilaginous defects. However, an increase in the flip angle results in substantially increased contrast between cartilage and synovial fluid and better depiction of subtle cartilaginous lesions (40) (Figs 10, 11). Lipid suppression may be achieved with a fat saturation or water excitation technique.
(a) Sagittal T2-weighted fat-suppressed fast SE image shows a full-thickness cartilaginous defect (arrow) at the patella. (b) Sagittal water excitation DESS image obtained with a flip angle of 20° (same patient as a) does not clearly depict the defect (arrow).
Figure 10a.

Figure 10b.

Sagittal T2-weighted fat-suppressed fast SE image (a) and water excitation DESS image obtained with a flip angle of 90° (b) both accurately depict a full-thickness cartilaginous defect (arrowheads) at the patella in another patient.
Figure 11a.

Figure 11b.

Studies have demonstrated the usefulness of 3D DESS imaging for the morphologic assessment of knee cartilage (41). When surgical findings were used as the reference standard, this technique allowed diagnostic accuracy comparable to that of standard 2D and 3D GRE sequences used for the detection of cartilaginous lesions in the knee (22). Thus, 3D DESS may be implemented for this purpose in clinical practice. Because acquisition time for DESS imaging is shorter than that for 3D SPGR imaging, it is less vulnerable to image artifacts from patient motion and more likely to allow accurate assessments. Other advantages of the technique include potentially higher SNR; higher cartilage-to-fluid contrast; and thinner sections with near-isotropic resolution, helping reduce partial volume effects. Because cartilage demonstrates high signal intensity, internal changes in cartilaginous signal intensity may be difficult to detect with this technique. In knee osteoarthritis trials, 3D DESS imaging allowed quantitative assessment of cartilage thickness and volume, with good accuracy and precision (41) (Fig 12). In comparison with other 3D GRE techniques tested in a longitudinal knee osteoarthritis trial, DESS imaging exhibited similar sensitivity to change in knee cartilage thickness over time (35). However, the capability of this technique for assessing adjacent structures such as menisci and ligaments has not been well validated.
Segmentation of 3D DESS image data obtained in the knee (a and b in different planes) allows quantitation of cartilage in weight-bearing regions of the femoral condyles (red and yellow), tibial plateaus (dark blue and green), trochlea (light blue), and patella (pink). (Courtesy of Osteoarthritis Initiative [OAI], a public-private partnership funded by the National Institutes of Health and conducted by the OAI Study Investigators, San Francisco, Calif.)
Figure 12a.

Figure 12b.

bSSFP Imaging
In 3D bSSFP imaging, as in 3D DESS imaging, cartilage displays high signal intensity, but the parameters vary somewhat from those in DESS imaging. Other names for 3D bSSFP imaging are true FISP (true fast imaging with steady-state precession), FIESTA (fast imaging employing steady-state acquisition), and balanced FFE (fast field echo) imaging.
Three-dimensional bSSFP imaging depicts fluid with increased signal intensity while preserving the signal intensity of cartilage, providing excellent synovial fluid–cartilage contrast. With recent advances in gradient coils, shorter TEs have become possible, helping eliminate off-resonance artifacts due to field inhomogeneity, such as banding artifacts. However, these previously common artifacts are still a problem with the use of high field strength (3 T) or a long TR. Because a short TR does not allow sufficient resolution for cartilage imaging, multiple acquisitions may be needed to achieve higher resolution.
Diagnostic performance with 3D bSSFP imaging is similar to that with standard 2D sequences and commonly used 3D GRE sequences for the morphologic assessment of knee cartilage (22,42) (Fig 13). The technique also is useful for imaging other internal structures of the knee, such as ligaments and menisci (43), a capability that makes it an attractive option for clinical practice.
(a) Sagittal 3D water excitation bSSFP source image shows a focal partial-thickness cartilaginous defect (arrow) at the medial femoral condyle. (b) Coronal reformatted image shows the extent of the defect (arrows). A medial femoral osteophyte and medial meniscal extrusion also are depicted.
Figure 13a.

Figure 13b.

A variant of bSSFP imaging called fluctuating equilibrium MR (or FEMR) imaging is useful for the morphologic assessment of knee cartilage (44), producing 3D images within a short acquisition time (45). This technique also provides excellent cartilage-to-fluid contrast, depending on the ratio of T1 to T2 in these tissues, producing a bright fluid signal while maintaining high signal intensity of cartilage (Fig 14). Fluctuating equilibrium MR imaging provides greater SNR efficiency in cartilage than standard techniques such as proton density–weighted fast SE, T2-weighted fast SE, and 3D SPGR imaging (44). However, like bSSFP imaging, fluctuating equilibrium MR imaging is vulnerable to off-resonance artifacts. Furthermore, its use in the assessment of other internal structures in the knee has not yet been validated.
Figure 14.

Sagittal 3D bSSFP water image obtained with a fluctuating equilibrium technique at 1.5 T (TR/TE = 6.6/1.8, in-plane resolution = 0.3 × 0.6 mm, section thickness = 2 mm, acquisition time = 2 min 43 sec) provides excellent contrast between cartilage and fluid despite areas of imperfect fat-water separation (arrowheads) resulting from field inhomogeneity.
Lipid suppression in bSSFP imaging can be achieved with several methods. When the TR is short and the magnetic field is homogeneous, a conventional fat saturation or water excitation pulse may be used. Other methods for achieving lipid suppression or fat-water separation with bSSFP imaging include Dixon imaging, which allows excellent differentiation of fat from water; linear combinations of bSSFP; and intermittent fat suppression, in which transient fat saturation pulses are applied to suppress the lipid signal. IDEAL imaging may be applied in conjunction with bSSFP imaging with multiple acquisitions to separate fat and water, with higher SNR efficiency in fluid and higher fluid-cartilage CNR efficiency than are achievable with fat-saturated bSSFP imaging (46) (Fig 15).
Figure 15.

Sagittal IDEAL-bSSFP water image shows excellent contrast between cartilage and synovial fluid (arrows) and between cartilage and other surrounding tissues.
Advanced bSSFP sequences applied in combination with advanced fat-water separation techniques at high-field-strength MR imaging show promise for reducing acquisition times in the morphologic assessment of knee cartilage, an advantage for clinical practice. However, to our knowledge, no large clinical studies of knee osteoarthritis or knee cartilage repair have been performed by using 3D bSSFP techniques.
VIPR Imaging
VIPR-SSFP, a recently developed technique based on the combination of bSSFP imaging with 3D radial k-space acquisition, allows the acquisition of images with isotropic spatial resolution and T2/T1-weighted contrast (29). The radial acquisition technique provides more efficient filling of k-space by collecting two radial lines per TR and omitting frequency dephasing and rephasing gradient pulses. Linear combinations of bSSFP are used to separate the fat signal from the water signal. VIPR imaging provides isotropic 0.5- to 0.7-mm-thick 3D image sections, allowing reformatting in arbitrarily selected planes. Short TRs are used for linear combination fat-water separation, helping to reduce banding artifacts in areas of magnetic susceptibility. This technique results in a high SNR in cartilage and high contrast between cartilage and adjacent joint structures (Fig 16), allowing an excellent diagnostic performance in the detection of cartilaginous, meniscal, and ligamentous lesions in the knee, as well as associated bone marrow changes (29). Short acquisition times facilitate the implementation of this technique in clinical practice and clinical research.
Sagittal source (a) and coronal reformatted (b) 3D VIPR-SSFP images exhibit a high cartilage SNR and high contrast among cartilage, synovial fluid, and other joint structures.
Figure 16a.

Figure 16b.

SPACE Imaging
SPACE imaging is a 3D fast SE technique in which large eligible turbo factors generated by a restore pulse and variable flip angle distribution are used to produce a pseudo steady state. The refocusing pulse train in SPACE consists of variable-flip-angle (<180°)radiofrequency pulses applied along the echo train. This technique may provide high, T2-weighted tissue contrast. Furthermore, SPACE images can be acquired with isotropic spatial resolution, allowing multiplanar reformatting. Compared with other 3D techniques commonly used to assess cartilage, SPACE demonstrates better SNR and higher SNR efficiency (47). Diagnostic performance with use of this technique for the detection of cartilage lesions in vitro was comparable to that with use of 3D DESS imaging but worse than that achieved with a standard 2D proton density–weighted fast SE technique (48). A disadvantage of SPACE imaging is its long acquisition time. Furthermore, its cartilage-to-fluid CNR and its capability for distinguishing between cartilage and surrounding tissues are not as good as those of several other 3D techniques commonly used in cartilage assessment (47). This technique has not yet been well validated for use in clinical assessments of articular cartilage or other structures in the knee, such as menisci and ligaments (Fig 17).
Figure 17.

Sagittal 3D SPACE water image accurately depicts cartilage thinning at the medial femoral condyle (arrowheads) and tearing at the posterior horn of the medial meniscus (arrow). Note the anterior medial femoral osteophyte.
Compositional Imaging of Cartilage
Hyaline articular cartilage is composed of a fluid-filled macromolecular network that supports mechanical loads. During joint loading, the electrolyte-containing interstitial fluid, which represents about 75% of cartilage volume by weight, becomes pressurized to the extent that its movement is restricted by the macromolecular network that distributes and supports the mechanical load. This macromolecular network consists mainly of collagen and proteoglycans. Collagen is the most abundant macromolecule, accounting for about 20% of cartilage volume by weight, and aggrecan, a large aggregating proteoglycan, is the second most abundant. In normal joints, the collagen network acts as the structural framework for tissue, providing the main source of its tensile and shear strength. The ordered collagen network and its associated water content cause both magnetization transfer and magic angle artifacts. Proteoglycans have glycosaminoglycans that are covalently attached as side chains, with abundant negatively charged carboxyl and sulfate groups. Glycosaminoglycans give the cartilage considerable compressive strength. Because proteoglycans have a substantial net negative charge, mobile ions such as sodium (Na+) and charged gadolinium-based MR imaging contrast agents such as gadolinium diethylenetriaminepentaacetic acid (Gd-DTPA)2− are distributed in relation to the proteoglycan concentration in cartilage. Because collagen and proteoglycan-associated glycosaminoglycans are important to preserve the functional and structural integrity of cartilage, compositional MR imaging assessment of cartilage is focused on its molecular status, specifically in regard to its collagen and glycosaminoglycan content (4). The MR imaging techniques that are available for assessing the physiologic composition of articular cartilage in the knee, and their applications in clinical practice and research, are described in the following sections and in Table 2.
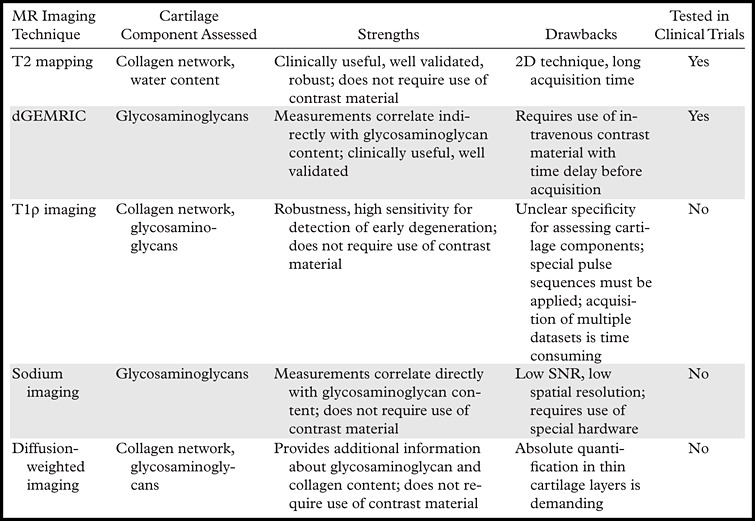
Table 2.
Characteristics, Strengths, and Drawbacks of MR Imaging Techniques for Assessment of Knee Cartilage Composition
T2 Mapping
T2 of hyaline articular cartilage reflects interactions among water molecules and between water molecules and surrounding macromolecules and is highly sensitive to alterations of the cartilage matrix. Increased interactions between water and macromolecules such as those of collagen result in decreased T2. Thus, T2 is highly sensitive to changes in hydration (or, nearly equivalently, collagen concentration) (49) and in the normally anisotropic orientation of the collagen fibrils within the extracellular cartilage matrix (50) that result from physiologic or pathophysiologic processes in cartilage.
In normal cartilage, regional and zonal differences in density and organization of the collagen matrix appear as variations in T2. A multiecho SE technique is used to measure T2 values. The signal intensity of each pixel is fitted to one or more decay exponentials, depending on whether more than one distribution of T2 is thought to be present within the sample. However, a single exponential fit is more appropriate for the TEs typically used in conventional MR imaging. Whereas routine MR imaging allows a subjective assessment of cartilage T2 changes, quantitative T2 mapping provides objective data by generating either a color or a gray-scale map representing the variations in relaxation time within cartilage.
There is good evidence that T2 mapping is useful for identifying sites of early-stage degeneration (early disruption of the collagen matrix) in cartilage, which appear as areas with T2 high-er than that of normal cartilage (Fig 18) (51). Compared with the T2 values mapped in normal hyaline cartilage, those found in osteoarthritic cartilage are more heterogeneous.
T2 maps obtained in knee cartilage in a 51-year-old man after anterior cruciate ligament repair show higher T2 values (yellow) in the medial (a) and lateral (b) tibiofemoral compartments, findings indicative of deterioration of the integrity and orientation of the collagen network. Maps were obtained at 3.0 T with a sagittal 3D T2-weighted multiecho SE sequence (TR/TE = 9.3/3.1, 13.5, 23.9, 44.8; recovery time = 1500 msec; field of view = 14 cm; matrix = 256 × 192; section thickness = 3 mm; bandwidth = 31.25-kHz). Scale is in milliseconds.
Figure 18a.

Figure 18b.

Increased T2 is most commonly associated with cartilage damage; however, low-signal-intensity lesions that may be due to increased water interaction with molecular fragments in cartilage are seen in some cases. Although T2 maps can be used to differentiate normal areas of cartilage from areas of degeneration, there does not appear to be any linear relationship between T2 and osteoarthritis grade that could aid differentiation between mild and more severe disease (52). Furthermore, physical activity seems to play a role in cartilage T2 values (53).
T2 maps may be used to monitor the effectiveness of cartilage repair over time, with eventual success signaled by the emergence of a collagen network that has a shape and overall and zonal organization similar to those seen in normal cartilage (Fig 19). In studies in which different techniques of cartilage repair were evaluated, T2 mapping showed promise for longitudinal monitoring of changes in cartilage (54).
(a) Preoperative sagittal 2D proton density–weighted fat-saturated fast SE image of the knee in a 20- year-old woman demonstrates a large osteochondral defect of the medial femoral condyle (arrows) with subchondral cyst formation (arrowhead). (b) Postoperative sagittal 2D proton density–weighted fat-saturated fast SE image obtained 18 months after autologous chondrocyte implantation shows heterogeneous repair tissue at the implant site with periosteal hypertrophy (arrows) and mild subchondral marrow edema (arrowheads). (c) Sagittal T2 map obtained with a multiecho SE sequence (TR/TE = 1500/9–99) at the same time as b depicts areas of repair tissue with heterogeneous T2 signal intensity (arrows). The normal pattern of depth-dependent variation, observed in the posterior femoral condyle (arrowheads), is absent.
Figure 19a.

Figure 19b.

Figure 19c.

T2 mapping can be implemented relatively easily on most clinical MR imaging systems, as pulse sequences for obtaining quantitative T2 maps and software for generating color T2 maps are now available in commercial packages.
dGEMRIC Technique
The dGEMRIC technique is based on the observation that ions within the interstitial fluid in hyaline cartilage are distributed in relation to the concentration of negatively charged glycosaminoglycan molecules, which in turn is related to the amount of proteoglycan content. When anionic molecules such as those of Gd-DTPA2− enter the cartilage, they concentrate in areas where the glycosaminoglycan content is relatively low. As the concentration of Gd-DTPA2− molecules can be approximated by measuring T1, T1 mapping of the cartilage after the intravenous administration of Gd-DTPA2− allows a quantitative assessment of glycosaminoglycan content. The term delayed in dGEMRIC reflects the time needed to allow the penetration of Gd-DTPA2− through the full cartilage thickness. Normally, the joint is moved for approximately 10 minutes after Gd-DTPA2− is administered, and only then are T1 measurements performed (90 minutes after the injection). dGEMRIC is often performed by using a 3D SPGR pulse sequence with a variable flip angle (55), but bSSFP and other techniques also have been used, with shorter acquisition times and better SNR for T1 and T2 measurements. In theory, Gd-DTPA2− is distributed in higher concentrations in areas of cartilage in which the glycosaminoglycan content is relatively low (a condition that leads to decreased T1) and in lower concentrations in areas of cartilage that are rich in glycosaminoglycans (Fig 20). However, because the concentration of Gd-DTPA2− in the blood in vivo varies over time, a state of equilibrium between Gd-DTPA2− and glycosaminoglycan content is never reached. The T1 measurement after penetration of Gd-DTPA2− is referred to as the dGEMRIC index. Areas of cartilage with a lower dGEMRIC index (often called “lesions” in the literature) are commonly observed in joints in which radiographic findings are indicative of osteoarthritis, as well as in joints that have been subjected to overloading (56).
Comparison of the dGEMRIC index obtained in a patient with knee osteoarthritis (b) with that obtained in a healthy subject (a) shows lower index values in b, findings representing depletion of the glycosaminoglycan content in articular cartilage at the medial tibial plateau (arrowheads) and degeneration of the medial meniscus. Scale is in milliseconds.
Figure 20a.

Figure 20b.

Variations in the dGEMRIC index may even be seen within a single articular compartment at an early (and potentially reversible) stage of osteoarthritis (56), which is characterized by a reduction in the concentration of glycosaminoglycan in hyaline cartilage. The dGEMRIC index has been shown to be affected by a number of physiologic factors, including exercise (57) and body mass index (58). It also may be influenced by acute physical stress. The dGEMRIC index was validated in clinical studies in which it was compared against the reference standards of histologic and biochemical measurements of glycosaminoglycan content (59). dGEMRIC has potential as a noninvasive method for monitoring the glycosaminoglycan content of cartilage after repair with various techniques (60). However, both contrast-enhanced and unenhanced measurements are necessary to maximize the sensitivity of the technique for evaluating the success of cartilage repair (60).
The dGEMRIC technique can be easily implemented clinically by using a standard 1.5 or 3.0 T magnet. Although the duration of the total acquisition time (up to 2 hours) diminishes its attractiveness for clinical use, dGEMRIC has potential value in clinical trials, where it has shown the ability to demonstrate changes in morphologically intact cartilage that may be predictive of progression to osteoarthritis (61).
T1ρ Imaging
T1ρ relaxation time (the duration of spin-lattice relaxation in the rotating frame) is similar to T2 relaxation time. However, to measure T1ρ, an additional radiofrequency pulse is applied after the magnetization is tipped into the transverse plane. There is a relationship between T1ρ and the energy changes between the spinning hydrogen protons and their environment. The interactions between motion-restricted water molecules and their local macromolecular environment can be monitored by measuring T1ρ, making this a promising technique for assessing the composition of cartilage, since its extracellular matrix provides a motion-restricted environment for the water molecules. Thus, changes to the extracellular matrix, such as proteoglycan depletion, may alter T1ρ values measured in cartilage (62). In the osteoarthritic knee, damaged hyaline cartilage demonstrates higher T1ρ values than normal cartilage, and T1ρ imaging has higher sensitivity than T2-weighted imaging for differentiating between normal cartilage and early-stage osteoarthritis (Fig 21) (63). There is evidence that several factors other than proteoglycan depletion may contribute to variations in T1ρ values; these factors include collagen fiber orientation and concentration and the concentration of other macromolecules (64). Even though T1ρ imaging cannot specify the macromolecular change in cartilage degeneration, its “nonspecific” sensitivity in the detection of early degenerative lesions may provide valuable etiologic, diagnostic, or prognostic information regarding knee osteoarthritis.
Comparison of T1ρ maps obtained in knee cartilage in a healthy subject (a) and a patient with severe osteoarthritis (Kellgren and Lawrence grade 3) (b) shows higher T1ρ values in b. The mean values in the medial femoral condyle were 32.9 msec ± 9.0 in a and 49.1 msec ± 14.2 in b, and those in the medial tibia were 35.8 msec ± 11.4 in a and 43.6 msec ± 12.0 in b. (Case courtesy of Xiaojuan Li, MD, University of California, San Francisco, Calif.)
Figure 21a.

Figure 21b.

T1ρ measurement requires special pulse sequences, which are typically available only at research institutions. It also requires time-consuming multiple datasets, which makes this technique less attractive clinically. To our knowledge, there have been no large clinical studies involving T1ρ measurement in patients after knee cartilage repair.
Sodium Imaging
As mentioned earlier, the sulfate and carboxyl groups in glycosaminoglycans impart a negative fixed charge density to the extracellular matrix of cartilage. In accordance with the principle of electrical neutrality, positive ions are distributed in concentrations equivalent to the density of the negative fixed charge within the extracellular matrix. Thus, the presence of the negatively charged glycosaminoglycans accounts for the higher concentrations of positively charged ions of sodium (23Na) in cartilaginous interstitial fluid than in surrounding synovial fluid or bone. Normal (glycosaminoglycan-rich) hyaline cartilage has high concentrations of sodium, and areas of cartilage with glycosaminoglycan depletion have lower concentrations. Because sodium possesses a nuclear spin momentum, it has a specific resonance frequency that is measurable at MR imaging.
Sodium MR imaging has shown promising results in the compositional assessment of articular cartilage. The advantages of the technique are that sodium occurs naturally in the cartilage matrix, that the signal intensity of cartilage is high in comparison with that of the background, and that sodium MR imaging can depict regions of proteoglycan depletion, which exhibit lower signal intensity than do areas of normal cartilage (65–67) (Fig 22). Therefore, sodium imaging may be useful for differentiating between early-stage degenerated cartilage and normal cartilage (65). Because of the short T2 relaxation times of sodium, this technique is commonly implemented by using a spectrally weighted twisted projection. Care should be taken when interpreting sodium MR images of cartilage, because some spatial variation in sodium concentration (and thus in signal intensity) may be present in normal cartilage.
Figure 22.

Whole-knee sodium MR image obtained with a proton density–weighted SPGR sequence in a healthy 20-year-old volunteer shows high signal intensity in cartilage at the medial compartment. Images were acquired at 3.0 T with a custom quadrature sodium coil and 3D cones readout trajectory, with a spatial resolution of 1.25 × 1.25 × 4 mm and acquisition time of 20 min. Scale is in millimoles.
Because the SNR (and hence the resolution) is significantly lower at sodium MR imaging than at proton MR imaging and because special hardware is required, clinical implementation of this technique is difficult, and it is available at only a few sites. To our knowledge, no large clinical studies of the use of sodium MR imaging in patients with knee osteoarthritis or knee cartilage repair have been performed.
Diffusion-weighted Imaging
Diffusion-weighted MR imaging is based on the motion of water molecules, which is influenced by intra- and extracellular barriers. Because the magnitude and direction of local tissue diffusivity are related to the macromolecular environment of bulk water diffusion, diffusion-weighted imaging can provide useful information about tissue ultrastructure.
Diffusion measurements are obtained by applying multiple diffusion-sensitizing gradient MR pulses to generate magnetization in water molecules. The magnetic phase is then reversed (reduced to zero if the spins are stationary). A random amount of the magnetization generated in mobile water molecules is lost and cannot be refocused, leading to a loss of signal intensity in tissues affected by diffusion, with the degree of signal intensity loss depending on the rate of diffusion. The diffusion of water in articular cartilage reflects the biochemical structure and architecture of the tissue. The apparent diffusion coefficient (ADC) is low at long diffusion times in healthy cartilage because the diffusion of water molecules is restricted by cartilage components. The term apparent is applied because tissue membranes may restrict water protons, and the diffusion coefficient is not simply that of bulk water. However, disruption of the cartilage matrix results in enhanced water mobility, which increases the ADC of cartilage (68). These variations in ADC values within cartilage and other tissues can be mapped (Fig 23).
Figure 23.

Sagittal ADC map obtained with diffusion-weighted MR imaging in the knee of an asymptomatic 28-year-old man shows a region of higher signal intensity at the posterior aspect of the medial femoral condyle, a finding suggestive of increased water proton mobility through a disruption in the cartilage matrix. Imaging was performed at 3.0 T (TR/TE = 2200/73, b = 600 sec/mm2, section thickness = 5 mm, matrix = 192 × 192).
Recently, diffusion-weighted imaging applied in conjunction with bSSFP sequences in the assessment of cartilage repair such as autologous chondrocyte implantation in vivo was reported to have good sensitivity for tracking changes in the diffusion behavior of implants over time (69). Since diffusion-weighted MR imaging does not require the use of a contrast agent and since its application with current sequences takes about 5 minutes, it is potentially useful in clinical settings. However, the technique has a disadvantage for use in clinical studies comparing various cartilage repair methods because it does not allow strictly quantitative measurement. To our knowledge, no large clinical studies involving the use of diffusion-weighted MR imaging for the evaluation of knee osteoarthritis or knee cartilage repair have been performed.
MR Imaging Assessment of Knee Cartilage with Different Field Strengths
Various magnetic field strengths are available for use in clinical practice and clinical research, and one might well wonder which strength is best for morphologic and compositional assessments of cartilage. A low magnetic field strength (0.18–0.2 T) is inadequate for morphologic assessment of cartilage and is not recommended for the evaluation of knee osteoarthritis or cartilage repair (70,71). Field strength of at least 1.0 T is recommended for morphologic assessment of knee cartilage. In large knee osteoarthritis trials, 1.0-T MR imaging demonstrated good to excellent intra- and interobserver reliability in the morphologic assessment of cartilage (72), even when compared with 1.5-T MR imaging (73). The current standard for cartilage imaging, widely available, is 1.5 T; this is the field strength that was used in most studies of MR imaging for morphologic and compositional assessments of knee cartilage. However, 3.0-T systems have demonstrated promising results for optimizing morphologic and compositional imaging of cartilage in the knee (25,41,54). The SNR at 3.0 T is roughly twice that at 1.5 T, allowing improved image quality and spatial resolution within a similar acquisition time. At 3.0 T, the time necessary to acquire images of satisfactory quality can be substantially reduced, helping to minimize motion artifacts and speeding patient turnover. Previous work has shown that field strength of 3.0 T allows better morphologic assessment of knee cartilage than 1.5 T (12). On the other hand, the use of high field strengths poses new challenges: Magnetic susceptibility in tissues is exacerbated; the energy deposited in the subject's tissues is higher (four times higher at 3.0 T than at 1.5 T); images are more vulnerable to flow artifacts, which may be a problem around the knee joint; and the severity of chemical shift effects increases in linear relationship with increases in magnetic field strength.
Even though several centers have a 7.0-T MR imaging capability (Fig 24), to date this capability has been applied only in research. Field strength of 7.0 T has been used in only a few studies for the morphologic and compositional assessment of knee cartilage in humans (66,74,75). In the future, it may become possible to achieve higher resolution within a shorter acquisition time with 7.0-T systems than with 3.0-T systems. However, currently available protocols for 7.0-T MR imaging have not shown superiority to 3.0-T MR imaging protocols in the assessment of knee cartilage.
Comparison of sagittal 3D SPGR MR images obtained at 3.0 T (a) and 7.0 T (b) in the knee of a healthy volunteer shows no substantial difference in the appearance of the articular cartilage, although magnetic susceptibility artifacts are exacerbated at the higher field strength in tissues such as trabecular bone (arrowheads in b).
Figure 24a.

Figure 24b.

Conclusions
MR imaging is a powerful tool for the morphologic and compositional imaging of cartilage in the knee. Recent advances in pharmacologic and surgical treatments of degenerative and traumatic lesions of knee cartilage have led to a resurgence of interest in the use of MR imaging in clinical practice and clinical research. For routine clinical examinations of the knee joint, most departments are still applying a multiplanar 2D fast SE sequence, alone or in combination with a 3D GRE sequence (SPGR, in most cases), to improve cartilage assessment. Novel 3D fast SE sequences are available for the assessment of knee cartilage and other internal structures but have not yet replaced the standard MR imaging sequences. However, it is possible that in the near future a single 3D fast SE sequence with multiplanar reformatting will surpass standard 2D fast SE techniques in clinical practice and clinical research by substantially reducing acquisition time. The combined use of high-resolution morphologic imaging techniques and compositional imaging techniques may lead to increased sensitivity of MR imaging for the detection of early cartilaginous degeneration and increased utility for the assessment of cartilage repair techniques.
Acknowledgments
The authors thank Ty Subhawong, MD, for help with image preparation.
Financial Disclosures.—M.D.C. holds shares in Boston Imaging Core Lab. F.W.R. holds shares in Boston Imaging Core Lab. M.D.M. holds shares in Boston Imaging Core Lab. G.E.G. consults for Zimmer Holdings and ICON and received research support from General Electric. F.E. co-owns and is CEO of Chondrometrics and consults for Pfizer and Merck. T.J.M. consults for Kensey Nash and holds stock in Johnson & Johnson. J.A.C. consults for General Electric and received research support from Siemens and Carestream Health. A.G. is president of Boston Imaging Core Lab; consults for Merck, Facet Solutions, Novartis, Genzyme, and Stryker; holds stock in CCBR-SYNARC; and received research support from General Electric.
Footnotes
Recipient of a Certificate of Merit award for an education exhibit at the 2009 RSNA Annual Meeting.
M.D.C., F.W.R., M.D.M., G.E.G., F.E., T.J.M., J.A.C., and A.G. have disclosed various financial relationships (see p 58); all remaining authors have no financial relationships to disclose.
References
- 1.Felson DT. Osteoarthritis of the knee. N Engl J Med 2006;354(8):841–848. [DOI] [PubMed] [Google Scholar]
- 2.Gold GE, Chen CA, Koo S, Hargreaves BA, Bangerter NK. Recent advances in MRI of articular cartilage. AJR Am J Roentgenol 2009;193(3):628–638. [DOI] [PMC free article] [PubMed] [Google Scholar]
- 3.Gold GE, McCauley TR, Gray ML, Disler DG. What's new in cartilage? RadioGraphics 2003;23(5):1227–1242. [DOI] [PubMed] [Google Scholar]
- 4.Burstein D, Gray M, Mosher T, Dardzinski B. Measures of molecular composition and structure in osteoarthritis. Radiol Clin North Am 2009;47(4):675–686. [DOI] [PubMed] [Google Scholar]
- 5.Trattnig S, Domayer S, Welsch GW, Mosher T, Eckstein F. MR imaging of cartilage and its repair in the knee: a review. Eur Radiol 2009;19(7):1582–1594. [DOI] [PubMed] [Google Scholar]
- 6.Choi YS, Potter HG, Chun TJ. MR imaging of cartilage repair in the knee and ankle. RadioGraphics 2008;28(4):1043–1059. [DOI] [PubMed] [Google Scholar]
- 7.Link TM, Stahl R, Woertler K. Cartilage imaging: motivation, techniques, current and future significance. Eur Radiol 2007;17(5):1135–1146. [DOI] [PubMed] [Google Scholar]
- 8.Black C, Clar C, Henderson R, et al. The clinical effectiveness of glucosamine and chondroitin sup-plements in slowing or arresting progression of osteoarthritis of the knee: a systematic review and economic evaluation. Health Technol Assess 2009;13(52):1–148. [DOI] [PubMed] [Google Scholar]
- 9.Gudas R, Kalesinskas RJ, Kimtys V, et al. A prospective randomized clinical study of mosaic osteochondral autologous transplantation versus microfracture for the treatment of osteochondral defects in the knee joint in young athletes. Arthroscopy 2005;21(9):1066–1075. [DOI] [PubMed] [Google Scholar]
- 10.Knutsen G, Drogset JO, Engebretsen L, et al. A randomized trial comparing autologous chondrocyte implantation with microfracture: findings at five years. J Bone Joint Surg Am 2007;89(10):2105–2112. [DOI] [PubMed] [Google Scholar]
- 11.Jungius KP, Schmid MR, Zanetti M, Hodler J, Koch P, Pfirrmann CW. Cartilaginous defects of the femorotibial joint: accuracy of coronal short inversion time inversion-recovery MR sequence. Radiology 2006;240(2):482–488. [DOI] [PubMed] [Google Scholar]
- 12.Kijowski R, Blankenbaker DG, Davis KW, Shinki K, Kaplan LD, De Smet AA. Comparison of 1.5- and 3.0-T MR imaging for evaluating the articular cartilage of the knee joint. Radiology 2009;250(3): 839–848. [DOI] [PubMed] [Google Scholar]
- 13.Peterfy CG, Guermazi A, Zaim S, et al. Whole-Organ Magnetic Resonance Imaging Score (WORMS) of the knee in osteoarthritis. Osteoarthritis Cartilage 2004;12(3):177–190. [DOI] [PubMed] [Google Scholar]
- 14.Hunter DJ, Lo GH, Gale D, Grainger AJ, Guermazi A, Conaghan PG. The reliability of a new scoring system for knee osteoarthritis MRI and the validity of bone marrow lesion assessment: BLOKS (Boston Leeds Osteoarthritis Knee Score). Ann Rheum Dis 2008;67(2):206–211. [DOI] [PubMed] [Google Scholar]
- 15.Kornaat PR, Ceulemans RY, Kroon HM, et al. MRI assessment of knee osteoarthritis: Knee Osteoarthritis Scoring System (KOSS)—inter-observer and intra-observer reproducibility of a compartment-based scoring system. Skeletal Radiol 2005;34(2):95–102. [DOI] [PubMed] [Google Scholar]
- 16.Disler DG, McCauley TR, Kelman CG, et al. Fat-suppressed three-dimensional spoiled gradient-echo MR imaging of hyaline cartilage defects in the knee: comparison with standard MR imaging and arthroscopy. AJR Am J Roentgenol 1996;167(1):127–132. [DOI] [PubMed] [Google Scholar]
- 17.Gerdes CM, Kijowski R, Reeder SB. IDEAL imaging of the musculoskeletal system: robust water fat separation for uniform fat suppression, marrow evaluation, and cartilage imaging. AJR Am J Roentgenol 2007;189(5):W284–W291. [DOI] [PubMed] [Google Scholar]
- 18.Meyer CH, Pauly JM, Macovski A, Nishimura DG. Simultaneous spatial and spectral selective excitation. Magn Reson Med 1990;15(2):287–304. [DOI] [PubMed] [Google Scholar]
- 19.Roemer FW, Guermazi A, Lynch JA, et al. Short tau inversion recovery and proton density-weighted fat suppressed sequences for the evaluation of osteoarthritis of the knee with a 1.0 T dedicated extremity MRI: development of a time-efficient sequence protocol. Eur Radiol 2005;15(5):978–987. [DOI] [PubMed] [Google Scholar]
- 20.Mohr A, Priebe M, Taouli B, Grimm J, Heller M, Brossmann J. Selective water excitation for faster MR imaging of articular cartilage defects: initial clinical results. Eur Radiol 2003;13(4):686–689. [DOI] [PubMed] [Google Scholar]
- 21.Graichen H, Springer V, Flaman T, et al. Validation of high-resolution water-excitation magnetic resonance imaging for quantitative assessment of thin cartilage layers. Osteoarthritis Cartilage 2000;8(2):106–114. [DOI] [PubMed] [Google Scholar]
- 22.Duc SR, Pfirrmann CW, Schmid MR, et al. Articular cartilage defects detected with 3D water-excitation true FISP: prospective comparison with sequences commonly used for knee imaging. Radiology 2007;245(1):216–223. [DOI] [PubMed] [Google Scholar]
- 23.Vallotton JA, Meuli RA, Leyvraz PF, Landry M. Comparison between magnetic resonance imaging and arthroscopy in the diagnosis of patellar cartilage lesions: a prospective study. Knee Surg Sports Traumatol Arthrosc 1995;3(3):157–162. [DOI] [PubMed] [Google Scholar]
- 24.Freeman DM, Bergman G, Glover G. Short TE MR microscopy: accurate measurement and zonal differentiation of normal hyaline cartilage. Magn Reson Med 1997;38(1):72–81. [DOI] [PubMed] [Google Scholar]
- 25.Kijowski R, Davis KW, Woods MA, et al. Knee joint: comprehensive assessment with 3D isotropic resolution fast spin-echo MR imaging—diagnostic performance compared with that of conventional MR imaging at 3.0 T. Radiology 2009;252(2):486–495. [DOI] [PMC free article] [PubMed] [Google Scholar]
- 26.Roemer FW, Zhang Y, Niu J, et al. Tibiofemoral joint osteoarthritis: risk factors for MR-depicted fast cartilage loss over a 30-month period in the multicenter osteoarthritis study. Radiology 2009;252(3):772–780. [DOI] [PMC free article] [PubMed] [Google Scholar]
- 27.Bobic V. ICRS articular cartilage imaging committee. ICRS MR imaging protocol for knee articular cartilage. Zollikon, Switzerland: International Cartilage Repair Society, 2000;12. [Google Scholar]
- 28.Roemer FW, Hunter DJ, Guermazi A. MRI-based semiquantitative assessment of subchondral bone marrow lesions in osteoarthritis research. Osteoarthritis Cartilage 2009;17(3):414–415; author reply 416–417. [DOI] [PubMed] [Google Scholar]
- 29.Kijowski R, Blankenbaker DG, Klaers JL, Shinki K, De Smet AA, Block WF. Vastly undersampled isotropic projection steady-state free precession imaging of the knee: diagnostic performance compared with conventional MR. Radiology 2009;251(1):185–194. [DOI] [PubMed] [Google Scholar]
- 30.Ristow O, Steinbach L, Sabo G, et al. Isotropic 3D fast spin-echo imaging versus standard 2D imaging at 3.0 T of the knee: image quality and diagnostic performance. Eur Radiol 2009;19(5):1263–1272. [DOI] [PubMed] [Google Scholar]
- 31.Disler DG, McCauley TR, Wirth CR, Fuchs MD. Detection of knee hyaline cartilage defects using fat-suppressed three-dimensional spoiled gradient-echo MR imaging: comparison with standard MR imaging and correlation with arthroscopy. AJR Am J Roentgenol 1995;165(2):377–382. [DOI] [PubMed] [Google Scholar]
- 32.Eckstein F, Guermazi A, Roemer FW. Quantitative MR imaging of cartilage and trabecular bone in osteoarthritis. Radiol Clin North Am 2009;47(4):655–673. [DOI] [PubMed] [Google Scholar]
- 33.Crema MD, Guermazi A, Li L, et al. The association of prevalent medial meniscal pathology with cartilage loss in the medial tibiofemoral compartment over a 2-year period. Osteoarthritis Cartilage 2010;18(3):336–343. [DOI] [PubMed] [Google Scholar]
- 34.Siepmann DB, McGovern J, Brittain JH, Reeder SB. High-resolution 3D cartilage imaging with IDEAL SPGR at 3 T. AJR Am J Roentgenol 2007;189(6):1510–1515. [DOI] [PubMed] [Google Scholar]
- 35.Wirth W, Nevitt M, Hellio Le Graverand MP, et al. Sensitivity to change of cartilage morphometry using coronal FLASH, sagittal DESS, and coronal MPR DESS protocols: comparative data from the Osteoarthritis Initiative (OAI). Osteoarthritis Cartilage 2010;18(4):547–554. [DOI] [PMC free article] [PubMed] [Google Scholar]
- 36.Glaser C, Tins BJ, Trumm CG, Richardson JB, Reiser MF, McCall IW. Quantitative 3D MR evaluation of autologous chondrocyte implantation in the knee: feasibility and initial results. Osteoarthritis Cartilage 2007;15(7):798–807. [DOI] [PubMed] [Google Scholar]
- 37.Hargreaves BA, Gold GE, Lang PK, et al. MR imaging of articular cartilage using driven equilibrium. Magn Reson Med 1999;42(4):695–703. [DOI] [PubMed] [Google Scholar]
- 38.Gold GE, Fuller SE, Hargreaves BA, Stevens KJ, Beaulieu CF. Driven equilibrium magnetic resonance imaging of articular cartilage: initial clinical experience. J Magn Reson Imaging 2005;21(4): 476–481. [DOI] [PubMed] [Google Scholar]
- 39.Radlbauer R, Lomoschitz F, Salomonowitz E, Eberhardt KE, Stadlbauer A. MR imaging of the knee: improvement of signal and contrast efficiency of T1-weighted turbo spin echo sequences by applying a driven equilibrium (DRIVE) pulse. Eur J Radiol 2010;75(2):e82–e87. [DOI] [PubMed] [Google Scholar]
- 40.Moriya S, Miki Y, Yokobayashi T, Ishikawa M. Three-dimensional double-echo steady-state (3D-DESS) magnetic resonance imaging of the knee: contrast optimization by adjusting flip angle. Acta Radiol 2009;50(5):507–511. [DOI] [PubMed] [Google Scholar]
- 41.Eckstein F, Hudelmaier M, Wirth W, et al. Double echo steady state magnetic resonance imaging of knee articular cartilage at 3 Tesla: a pilot study for the Osteoarthritis Initiative. Ann Rheum Dis 2006;65(4):433–441. [DOI] [PMC free article] [PubMed] [Google Scholar]
- 42.Duc SR, Koch P, Schmid MR, Horger W, Hodler J, Pfirrmann CW. Diagnosis of articular cartilage abnormalities of the knee: prospective clinical evaluation of a 3D water-excitation true FISP sequence. Radiology 2007;243(2):475–482. [DOI] [PubMed] [Google Scholar]
- 43.Duc SR, Pfirrmann CW, Koch PP, Zanetti M, Hodler J. Internal knee derangement assessed with 3-minute three-dimensional isovoxel true FISP MR sequence: preliminary study. Radiology 2008;246(2):526–535. [DOI] [PubMed] [Google Scholar]
- 44.Vasnawala SS, Pauly JM, Nishimura DG, Gold GE. MR imaging of knee cartilage with FEMR. Skeletal Radiol 2002;31(10):574–580. [DOI] [PubMed] [Google Scholar]
- 45.Gold GE, Hargreaves BA, Vasanawala SS, et al. Articular cartilage of the knee: evaluation with fluctuating equilibrium MR imaging—initial experience in healthy volunteers. Radiology 2006;238(2): 712–718. [DOI] [PubMed] [Google Scholar]
- 46.Gold GE, Reeder SB, Yu H, et al. Articular cartilage of the knee: rapid three-dimensional MR imaging at 3.0 T with IDEAL balanced steady-state free precession—initial experience. Radiology 2006;240(2): 546–551. [DOI] [PubMed] [Google Scholar]
- 47.Friedrich KM, Reiter G, Kaiser B, et al. High-resolution cartilage imaging of the knee at 3T: basic evaluation of modern isotropic 3D MR-sequences. Eur J Radiol 2010 Feb 5. [Epub ahead of print] [DOI] [PubMed] [Google Scholar]
- 48.Schaefer FK, Kurz B, Schaefer PJ, et al. Accuracy and precision in the detection of articular cartilage lesions using magnetic resonance imaging at 1.5 Tesla in an in vitro study with orthopedic and histopathologic correlation. Acta Radiol 2007;48(10): 1131–1137. [DOI] [PubMed] [Google Scholar]
- 49.Liess C, Lüsse S, Karger N, Heller M, Glüer CC. Detection of changes in cartilage water content using MRI T2-mapping in vivo. Osteoarthritis Cartilage 2002;10(12):907–913. [DOI] [PubMed] [Google Scholar]
- 50.Mosher TJ, Smith H, Dardzinski BJ, Schmithorst VJ, Smith MB. MR imaging and T2 mapping of femoral cartilage: in vivo determination of the magic angle effect. AJR Am J Roentgenol 2001;177(3):665–669. [DOI] [PubMed] [Google Scholar]
- 51.Dunn TC, Lu Y, Jin H, Ries MD, Majumdar S. T2 relaxation time of cartilage at MR imaging: comparison with severity of knee osteoarthritis. Radiology 2004;232(2):592–598. [DOI] [PMC free article] [PubMed] [Google Scholar]
- 52.Koff MF, Amrami KK, Kaufman KR. Clinical evaluation of T2 values of patellar cartilage in patients with osteoarthritis. Osteoarthritis Cartilage 2007;15(2):198–204. [DOI] [PubMed] [Google Scholar]
- 53.Stehling C, Liebl H, Krug R, et al. Patellar cartilage: T2 values and morphologic abnormalities at 3.0-T MR imaging in relation to physical activity in asymptomatic subjects from the osteoarthritis initiative. Radiology 2010;254(2):509–520. [DOI] [PMC free article] [PubMed] [Google Scholar]
- 54.Welsch GH, Mamisch TC, Domayer SE, et al. Cartilage T2 assessment at 3-T MR imaging: in vivo differentiation of normal hyaline cartilage from reparative tissue after two cartilage repair procedures—initial experience. Radiology 2008;247(1):154–161. [DOI] [PubMed] [Google Scholar]
- 55.McKenzie CA, Williams A, Prasad PV, Burstein D. Three-dimensional delayed gadolinium-enhanced MRI of cartilage (dGEMRIC) at 1.5T and 3.0T. J Magn Reson Imaging 2006;24(4):928–933. [DOI] [PubMed] [Google Scholar]
- 56.Williams A, Sharma L, McKenzie CA, Prasad PV, Burstein D. Delayed gadolinium-enhanced magnetic resonance imaging of cartilage in knee osteoarthritis: findings at different radiographic stages of disease and relationship to malalignment. Arthritis Rheum 2005;52(11):3528–3535. [DOI] [PubMed] [Google Scholar]
- 57.Tiderius CJ, Svensson J, Leander P, Ola T, Dahlberg L. dGEMRIC (delayed gadolinium-enhanced MRI of cartilage) indicates adaptive capacity of human knee cartilage. Magn Reson Med 2004;51(2): 286–290. [DOI] [PubMed] [Google Scholar]
- 58.Anandacoomarasamy A, Giuffre BM, Leibman S, et al. Delayed gadolinium-enhanced magnetic resonance imaging of cartilage: clinical associations in obese adults. J Rheumatol 2009;36(5):1056–1062. [DOI] [PubMed] [Google Scholar]
- 59.Bashir A, Gray ML, Hartke J, Burstein D. Nondestructive imaging of human cartilage glycosaminoglycan concentration by MRI. Magn Reson Med 1999;41(5):857–865. [DOI] [PubMed] [Google Scholar]
- 60.Watanabe A, Wada Y, Obata T, et al. Delayed gadolinium-enhanced MR to determine glycosaminoglycan concentration in reparative cartilage after autologous chondrocyte implantation: preliminary results. Radiology 2006;239(1):201–208. [DOI] [PubMed] [Google Scholar]
- 61.Owman H, Tiderius CJ, Neuman P, Nyquist F, Dahlberg LE. Association between findings on delayed gadolinium-enhanced magnetic resonance imaging of cartilage and future knee osteoarthritis. Arthritis Rheum 2008;58(6):1727–1730. [DOI] [PubMed] [Google Scholar]
- 62.Duvvuri U, Charagundla SR, Kudchodkar SB, et al. Human knee: in vivo T1(rho)-weighted MR imaging at 1.5 T—preliminary experience. Radiology 2001;220(3):822–826. [DOI] [PubMed] [Google Scholar]
- 63.Stahl R, Luke A, Li X, et al. T1rho, T2 and focal knee cartilage abnormalities in physically active and sedentary healthy subjects versus early OA patients: a 3.0-Tesla MRI study. Eur Radiol 2009;19(1): 132–143. [DOI] [PubMed] [Google Scholar]
- 64.Mlynárik V, Trattnig S, Huber M, Zembsch A, Imhof H. The role of relaxation times in monitoring pro-teoglycan depletion in articular cartilage. J Magn Reson Imaging 1999;10(4):497–502. [DOI] [PubMed] [Google Scholar]
- 65.Borthakur A, Shapiro EM, Beers J, Kudchodkar S, Kneeland JB, Reddy R. Sensitivity of MRI to proteoglycan depletion in cartilage: comparison of sodium and proton MRI. Osteoarthritis Cartilage 2000;8(4):288–293. [DOI] [PubMed] [Google Scholar]
- 66.Wang L, Wu Y, Chang G, et al. Rapid isotropic 3D-sodium MRI of the knee joint in vivo at 7T. J Magn Reson Imaging 2009;30(3):606–614. [DOI] [PMC free article] [PubMed] [Google Scholar]
- 67.Wheaton AJ, Borthakur A, Shapiro EM, et al. Proteoglycan loss in human knee cartilage: quantitation with sodium MR imaging—feasibility study. Radiology 2004;231(3):900–905. [DOI] [PubMed] [Google Scholar]
- 68.Burstein D, Gray ML, Hartman AL, Gipe R, Foy BD. Diffusion of small solutes in cartilage as measured by nuclear magnetic resonance (NMR) spectroscopy and imaging. J Orthop Res 1993;11(4): 465–478. [DOI] [PubMed] [Google Scholar]
- 69.Mamisch TC, Menzel MI, Welsch GH, et al. Steady-state diffusion imaging for MR in-vivo evaluation of reparative cartilage after matrix-associated autologous chondrocyte transplantation at 3 tesla: preliminary results. Eur J Radiol 2008;65(1):72–79. [DOI] [PubMed] [Google Scholar]
- 70.Kladny B, Glückert K, Swoboda B, Beyer W, Weseloh G. Comparison of low-field (0.2 Tesla) and high-field (1.5 Tesla) magnetic resonance imaging of the knee joint. Arch Orthop Trauma Surg 1995;114(5):281–286. [DOI] [PubMed] [Google Scholar]
- 71.Woertler K, Strothmann M, Tombach B, Reimer P. Detection of articular cartilage lesions: experimental evaluation of low- and high-field-strength MR imaging at 0.18 and 1.0 T. J Magn Reson Imaging 2000;11(6):678–685. [DOI] [PubMed] [Google Scholar]
- 72.Crema MD, Roemer FW, Zhu Y, et al. Subchondral cystlike lesions develop longitudinally in areas of bone marrow edema-like lesions in patients with or at risk for knee osteoarthritis: detection with MR imaging—the MOST study. Radiology 2010;256(3): 855–862. [DOI] [PMC free article] [PubMed] [Google Scholar]
- 73.Roemer FW, Lynch JA, Niu J, et al. A comparison of dedicated 1.0 T extremity MRI vs large-bore 1.5 T MRI for semiquantitative whole organ assessment of osteoarthritis: the MOST study. Osteoarthritis Cartilage 2010;18(2):168–174. [DOI] [PMC free article] [PubMed] [Google Scholar]
- 74.Stahl R, Krug R, Kelley DA, et al. Assessment of cartilage-dedicated sequences at ultra-high-field MRI: comparison of imaging performance and diagnostic confidence between 3.0 and 7.0 T with respect to osteoarthritis-induced changes at the knee joint. Skeletal Radiol 2009;38(8):771–783. [DOI] [PMC free article] [PubMed] [Google Scholar]
- 75.Krug R, Carballido-Gamio J, Banerjee S, et al. In vivo bone and cartilage MRI using fully-balanced steady-state free-precession at 7 tesla. Magn Reson Med 2007;58(6):1294–1298. [DOI] [PubMed] [Google Scholar]